Name
双EMA黄金交叉突破策略Dual-EMA-Crossover-Breakout-Strategy
Author
ChaoZhang
Strategy Description
[trans]
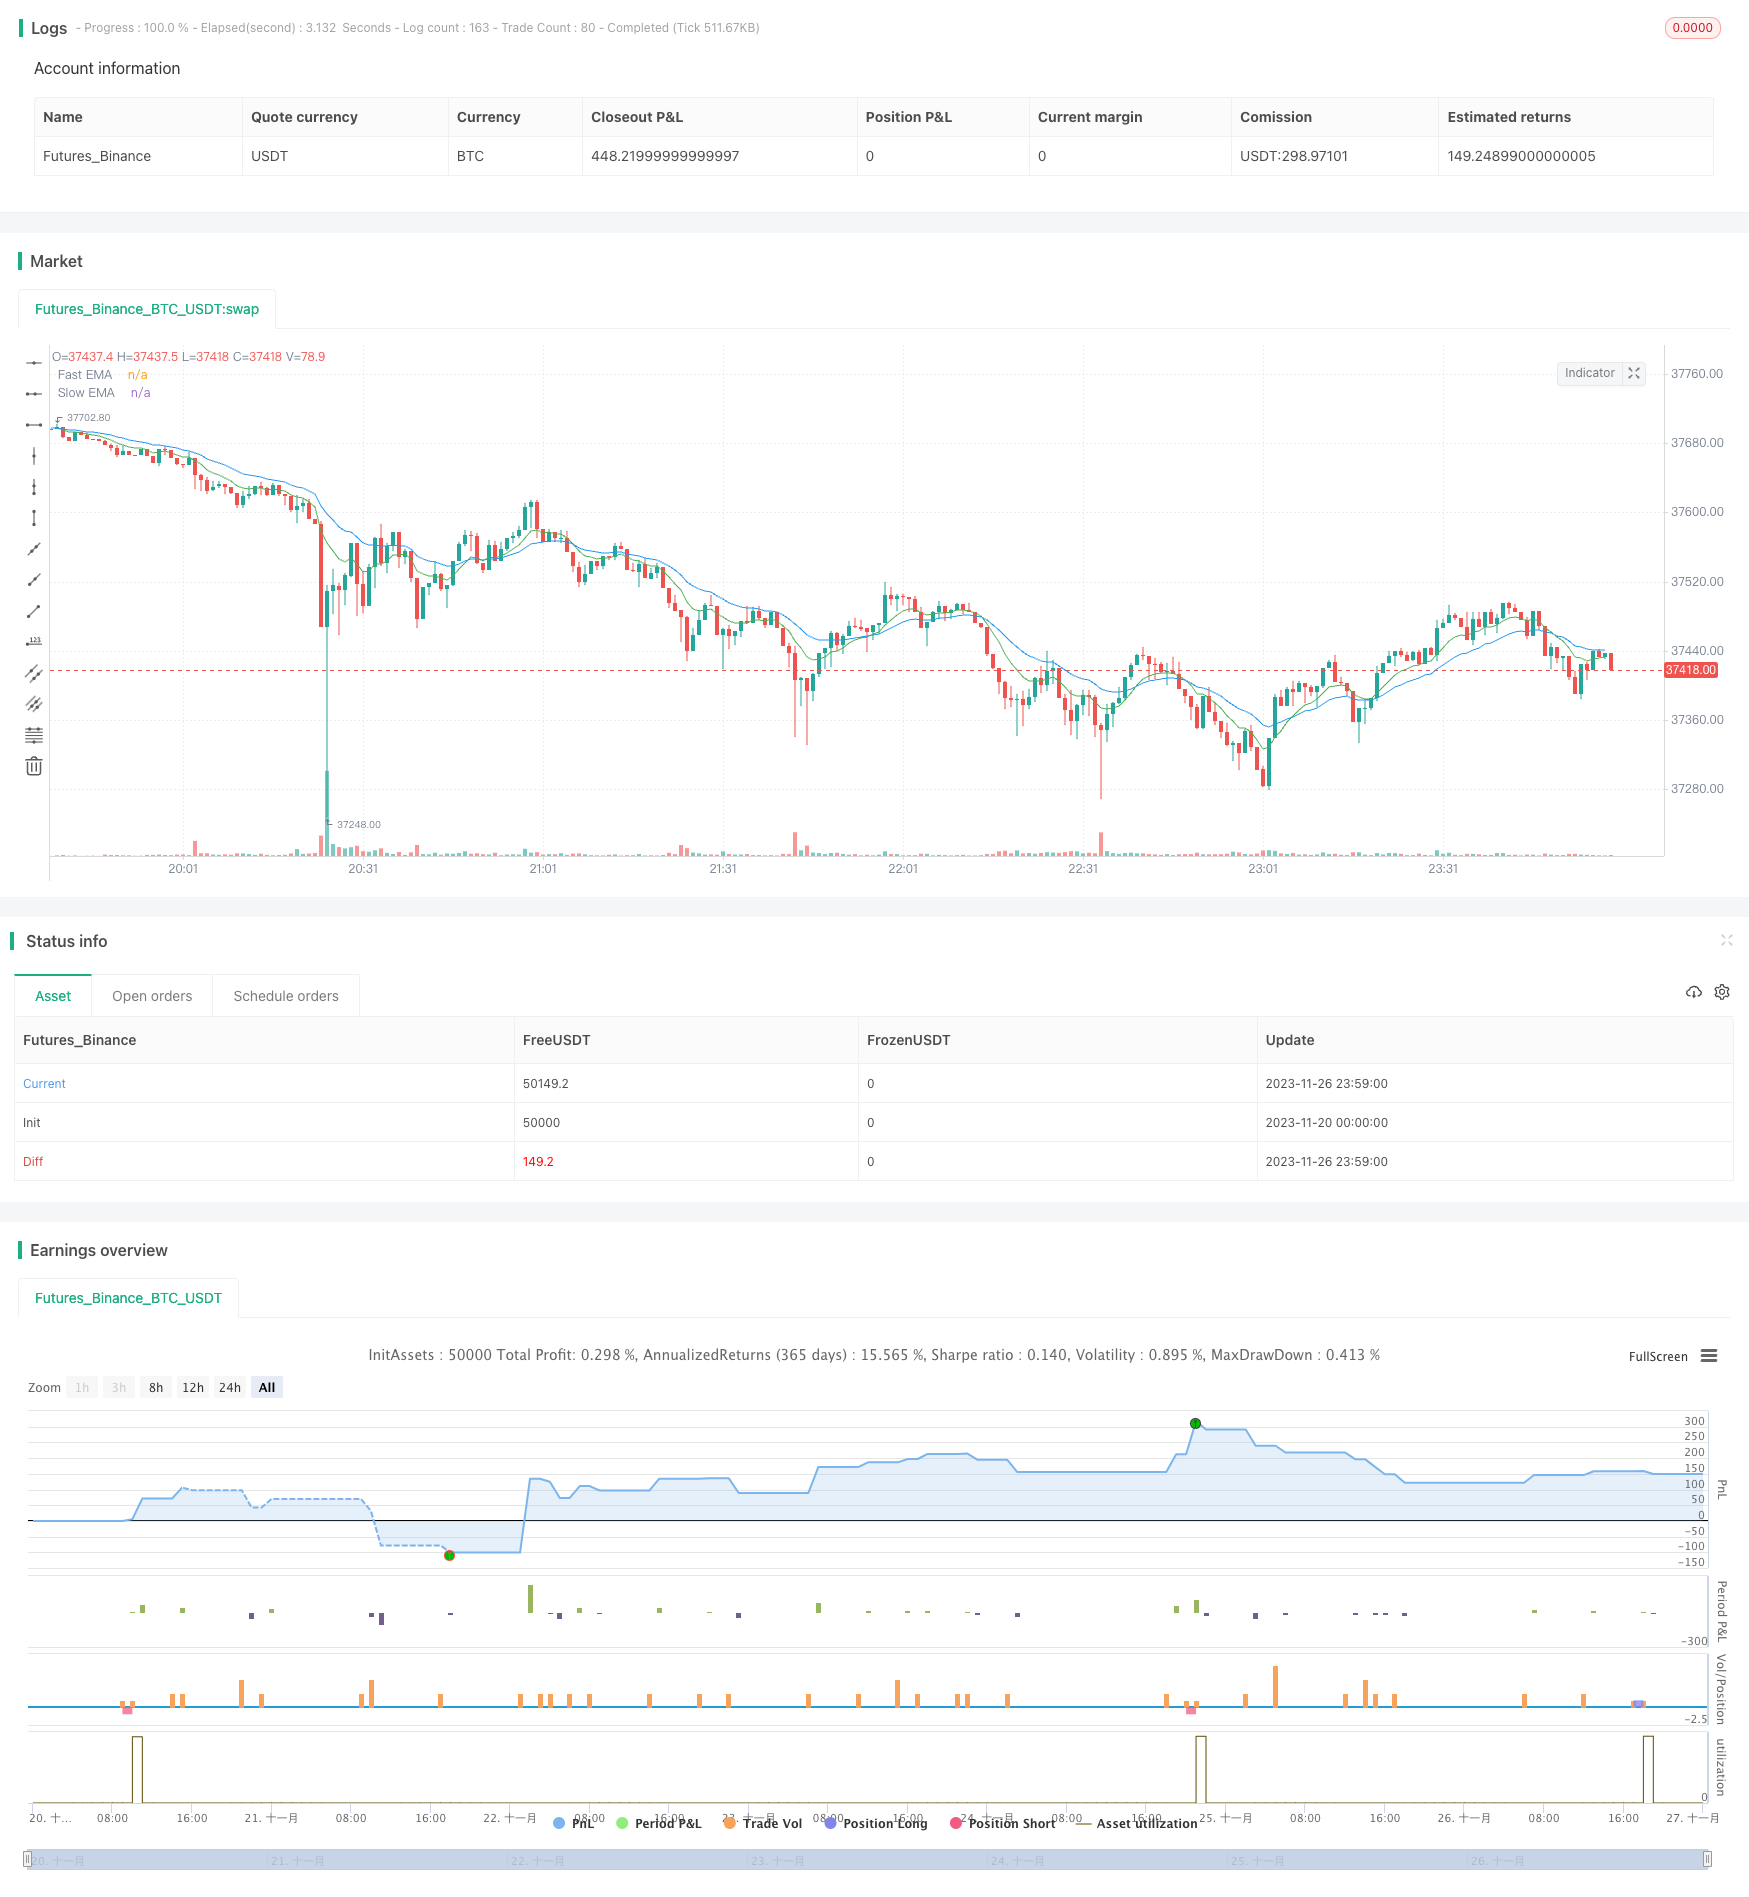
双EMA黄金交叉突破策略通过计算快线EMA和慢线EMA的交叉情况,结合交易量突破、K线形态以及价格突破判断来产生买入和卖出信号。该策略综合多种技术指标,旨在提高信号的可靠性,在捕捉价格趋势的同时控制风险。
双EMA黄金交叉突破策略的核心逻辑基于双EMA的黄金交叉理论。该理论认为,当短期EMA上穿较长期EMA时,代表价格上涨势头较强,应该建立多头仓位;当短期EMA下穿较长期EMA时,代表价格下跌势头较强,应该建立空头仓位。
具体来说,该策略首先计算9日EMA和21日EMA。当9日EMA上穿21日EMA时,产生“长”信号;当9EMA下穿21EMA时,产生“短”信号。为了过滤假信号,策略还设置了以下判断条件:
-
交易量条件。最近K线的交易量需要大于前5根K线的平均交易量的85%。这个条件可以过滤出交易量不足的假信号。
-
价格突破条件。价格需要突破9日EMA,作为进场确认。
-
K线形态条件。需要识别出反转K线形态,包括向上吞没形态或向下吞没形态。这可以避免在盘整震荡时重复进出场。
在多头仓位中,当价格跌破9日EMA时,执行平仓退出。在空头仓位中,当价格涨破9日EMA时,同样执行平仓退出。
双EMA黄金交叉突破策略结合多种技术指标信号,可以有效识别价格趋势,提高交易胜率。其主要优势有:
-
使用双EMA判断主要趋势方向,可靠性较高。
-
增加交易量过滤,避免在交易量不足时发出错误信号。
-
增加K线形态判断,可以过滤震荡盘整市场的噪音。
-
价格突破EMA时进场,可以确认趋势。
-
设定止损退出机制,可以主动控制风险。
双EMA黄金交叉突破策略也存在一定的风险,主要集中在以下几个方面:
-
在震荡行情中,EMA可能发出错误信号,从而导致交易亏损。可以通过整体趋势判断来决定是否开仓。
-
固定的EMA周期设置可能无法适应市场的变化,可以尝试采用自适应EMA。
-
反转K线形态判断依然存在一定误判概率,停损机制可以用来控制风险。
-
策略可能会错过部分行情,无法完美追踪价格。可以适当调整参数,或与其他策略组合使用。
双EMA黄金交叉突破策略还有以下几点主要优化方向:
-
测试更多的EMA组合,寻找最佳参数。
-
增加自适应EMA,根据市场变化调整EMA参数。
-
优化仓位管理,不同行情采用不同的仓位。
-
结合更多指标进行优化,如MACD、KDJ等,形成策略组合。
-
引入机器学习等高级技术进行模型融合,提高策略稳定性。
双EMA黄金交叉突破策略通过双EMA判断趋势方向,并增加交易量/价格/K线形态多重过滤,可以有效识别趋势,在控制风险的同时提高交易效率。该策略操作简单,容易实施,同时还留有很多优化空间,是一种值得推荐的突破交易策略。
||
The Dual EMA Crossover Breakout strategy generates buy and sell signals based on the crossover of fast and slow EMA lines, combined with trading volume breakout, candlestick patterns and price breakout filters to improve reliability. By integrating multiple technical indicators, it aims to identify trends while controlling risks.
The core logic of the Dual EMA Crossover Breakout strategy lies in the golden crossover theory of two EMAs. The theory believes that when the shorter-term EMA crosses above the longer-term EMA, it signals an uptrend, so long positions should be established. When the shorter-term EMA crosses below the longer-term EMA, it signals a downtrend, so short positions should be established.
Specifically, the strategy first calculates the 9-period and 21-period EMAs. When the 9-EMA crosses above the 21-EMA, a "long" signal is generated. When the 9-EMA crosses below the 21-EMA, a "short" signal is generated. To filter out false signals, the following conditions are checked:
-
Volume condition - Volume of recent candle should exceed 85% of average volume of previous 5 candles. This filters out signals with insufficient trading volumes.
-
Price breakout condition - Price needs to breakout above 9-EMA as entry confirmation.
-
Candlestick pattern condition - Identify bullish or bearish reversal patterns, avoiding whipsaws during sideways markets.
For long positions, exits are triggered when price breaks below 9-EMA. For short positions, exits are triggered when price breaks above 9-EMA.
By combining signals from multiple technical indicators, the Dual EMA Crossover Breakout strategy can effectively identify trends and improve win rate. The main advantages are:
-
Using dual EMAs to determine major trend direction is highly reliable.
-
Adding volume filter avoids wrong signals when volume is insufficient.
-
Adding candlestick pattern filter eliminates noise from range-bound markets.
-
Entering after price breaks EMA confirms trend.
-
The stop loss mechanism actively controls risks.
There are still some risks with the strategy:
-
EMA may generate false signals during choppy markets, causing losses. Overall trend judgement can help decide on opening positions.
-
Fixed EMA periods may fail to adapt to changing markets. Adaptive EMAs can be tested.
-
There are still probabilities of misidentifying candlestick patterns. Stop losses control risk.
-
The strategy may miss some price moves and have imperfect trend tracking. Parameter tuning or combining with other strategies can help.
The main optimization directions are:
-
Test more EMA combinations to find optimal parameters.
-
Add adaptive EMAs based on changing market conditions.
-
Optimize position sizing for different market conditions.
-
Incorporate more indicators like MACD, KDJ to form ensemble strategies.
-
Introduce machine learning models to improve robustness.
The Dual EMA Crossover Breakout strategy effectively identifies trends using dual EMA directional analysis, and adds multiple volume/price/pattern filters to improve efficiency while controlling risks. Easy to implement with optimization flexibility, it is a recommended breakout trend following strategy.
[/trans]
Source (PineScript)
/*backtest
start: 2023-11-20 00:00:00
end: 2023-11-27 00:00:00
period: 1m
basePeriod: 1m
exchanges: [{"eid":"Futures_Binance","currency":"BTC_USDT"}]
*/

//@version=5
//Author: Andrew Shubitowski
strategy("Buy/Sell Strat", overlay = true)

//Define EMAs & Crossovers (Feature 2)
a = ta.ema(close, 9)
b = ta.ema(close, 21)
crossUp = ta.crossover(a, b)
crossDown = ta.crossunder(a, b)


//Define & calc volume averages (Feature 1)
float volAvg = 0
for i = 1 to 5
    volAvg := volAvg + volume[i]
volAvg := volAvg / 5

//Define candlestick pattern recongition (Feature 4)
bool reversalPatternUp = false
bool reversalPatternDown = false
if (close > close[1] and close[1] > close [2] and close[3] > close[2] and close > close[3])
    reversalPatternUp := true

if (close < close[1] and close[1] < close [2] and close[3] < close[2] and close < close[3])
    reversalPatternDown := true

//Execute trade (Feature 3 + 5)
if (crossUp)
    strategy.entry("long", strategy.long, when = ((volume * 0.85) > volAvg and close > a and reversalPatternUp == true))

if (crossDown)
    strategy.entry("short", strategy.short, when = ((volume * 0.85) > volAvg and close < a and reversalPatternDown == true))

//Exit strategy (New Feature)
close_condition_long = close < a
close_condition_short = close > a
if (close_condition_long)
    strategy.close("long")

if (close_condition_short)
    strategy.close("short")

//plot the EMAs
plot(a, title = "Fast EMA", color = color.green)
plot(b, title = "Slow EMA", color = color.blue)


//Some visual validation parameters
//plotchar(volAvg, "Volume", "", location.top, color.aqua) //*TEST* volume calc check
//plotshape(reversalPatternUp, style = shape.arrowup, color = color.aqua) //*TEST* reversal check
//plotshape(reversalPatternDown, style = shape.arrowup, location = location.belowbar, color = color.red) //*TEST* reversal check
Detail
https://www.fmz.com/strategy/433566
Last Modified
2023-11-28 15:39:37
