Name
双EMA黄金交叉长线策略Dual-EMA-Golden-Cross-Long-Line-Strategy
Author
ChaoZhang
Strategy Description
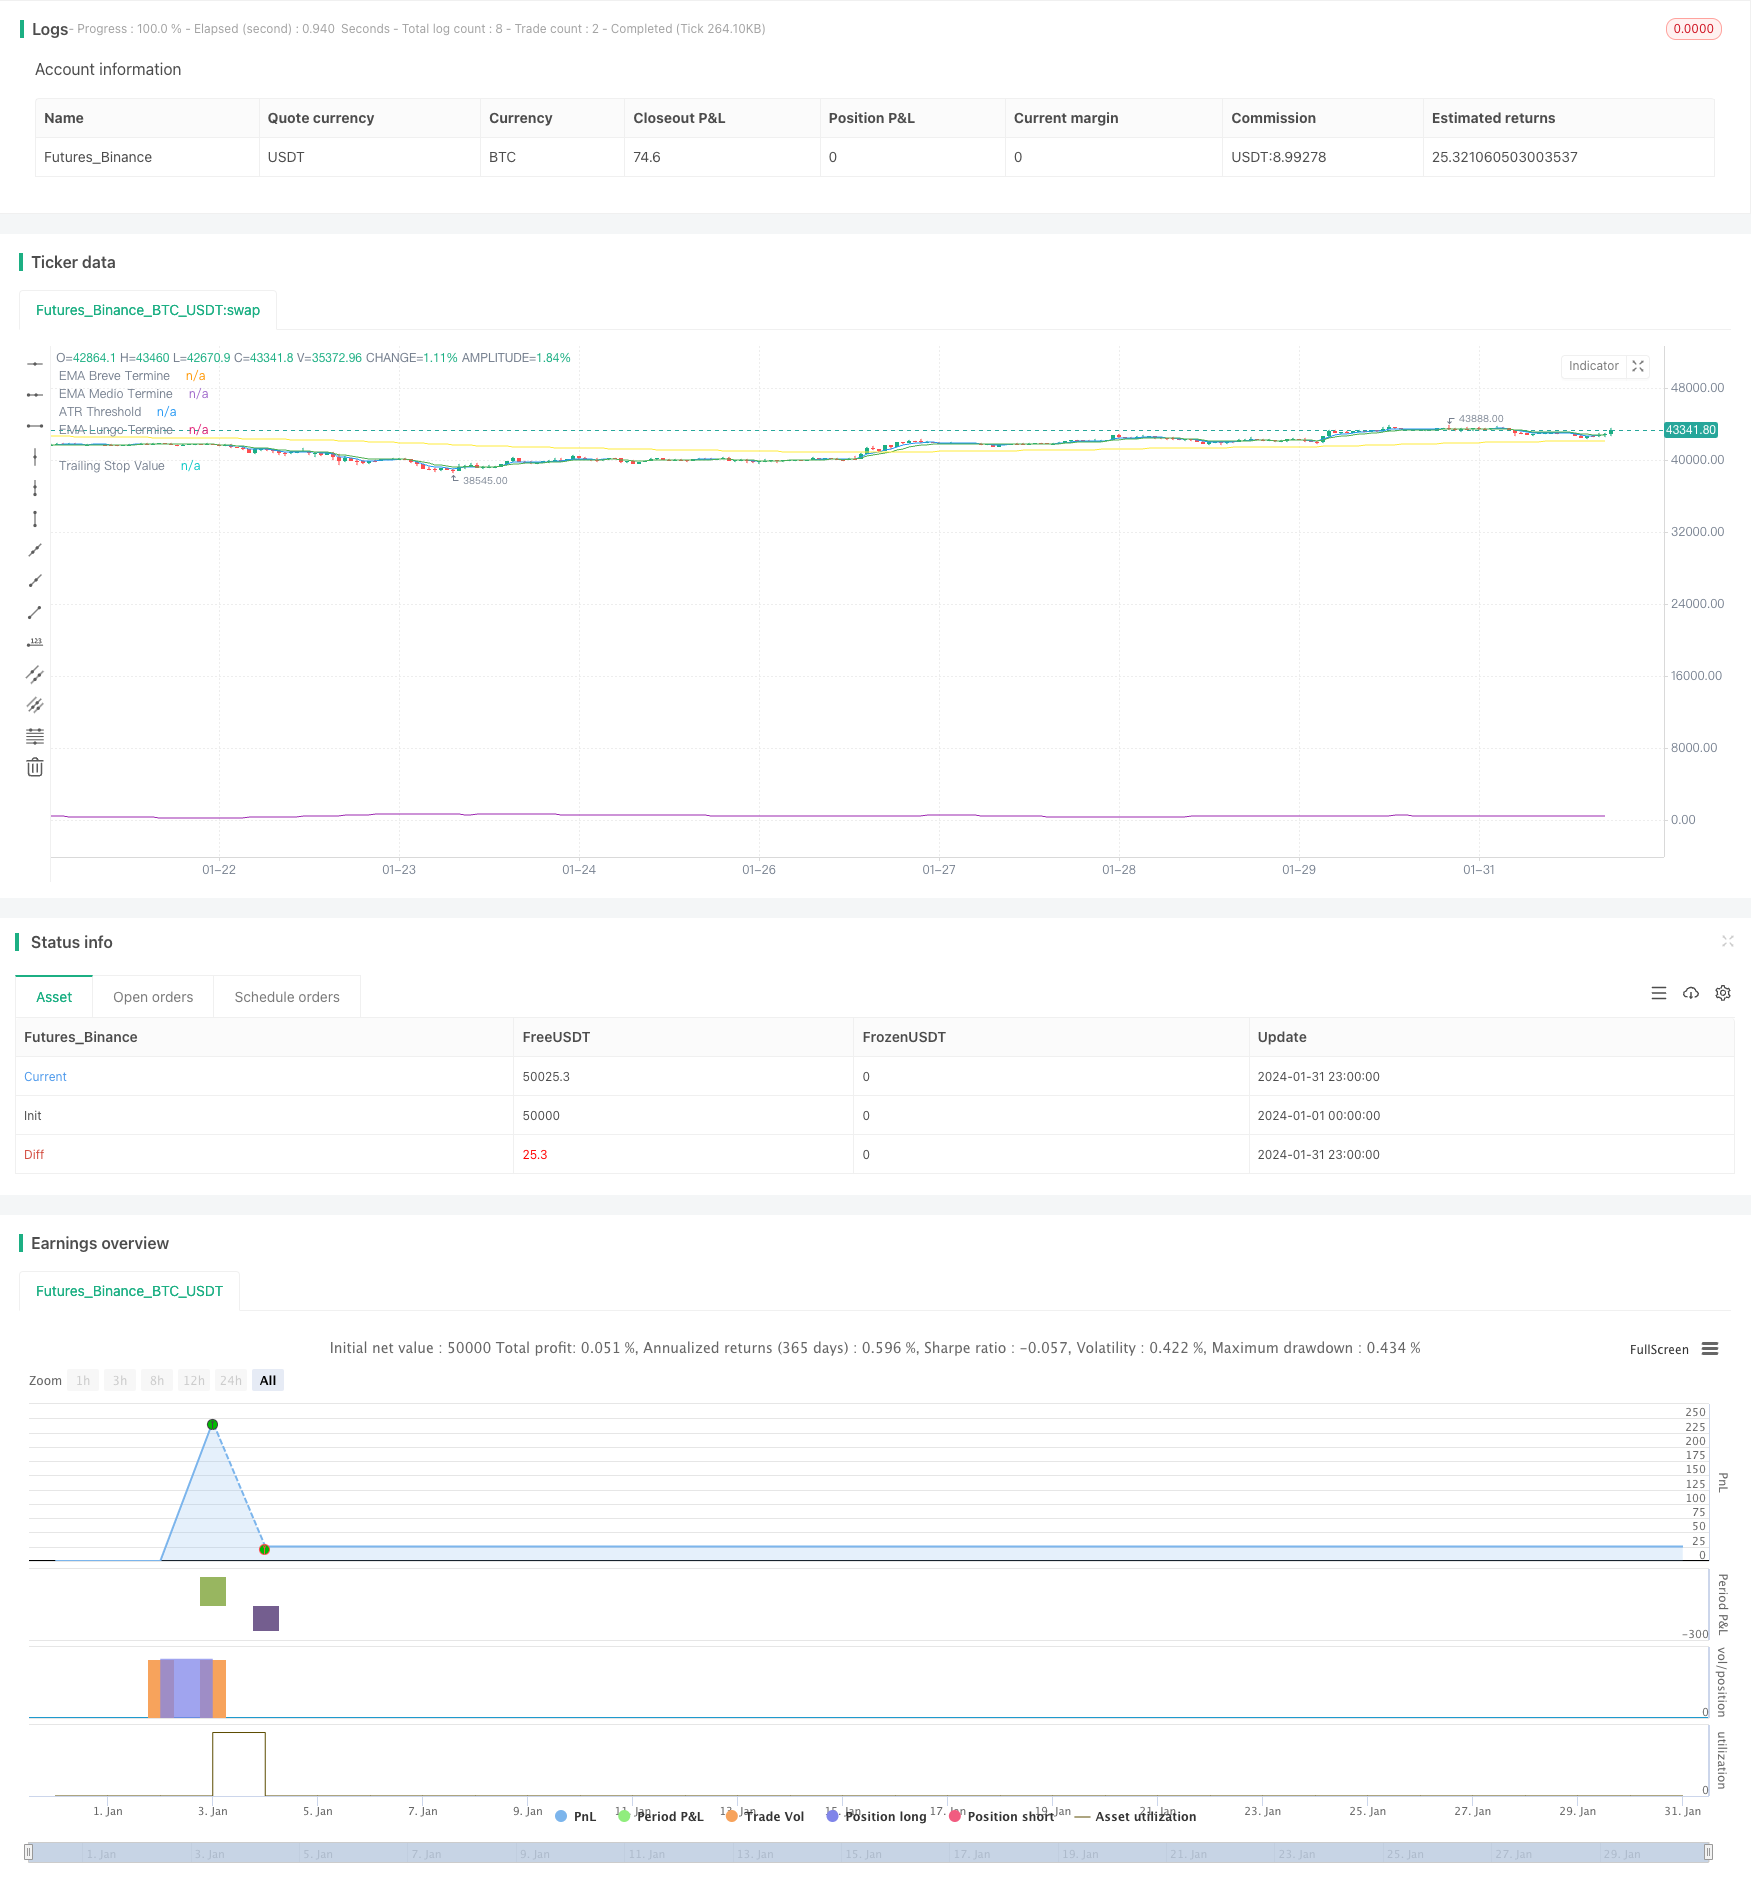
双EMA黄金交叉长线策略是一种仅开启做多头仓位的趋势跟踪策略。该策略同时使用短期EMA、中期EMA和长期EMA三条移动平均线。具体进入规则是:价格高于长期EMA,同时短期EMA从下方上穿中期EMA构成黄金交叉时,开仓做多。
-
使用三条EMA周期可配置,分别计算出短期EMA、中期EMA和长期EMA。
-
如果价格高于长期EMA,则证明目前处于多头趋势中。
-
如果短期EMA从下方上穿中期EMA,形成黄金交叉,则进一步证实多头趋势加强中。
-
当上述两个条件同时满足时,开仓做多。
该策略最大的优势是能够有效识别趋势,采用多周期EMA结合判断,避免被短期市场噪音误导。同时,配置停损作为风险控制手段,能够将损失控制在一定范围。
该策略主要风险在于多头仓位。当行情反转时,无法及时关闭头寸,导致亏损扩大的风险。此外,EMAS周期设置不当也会导致交易频繁,增加交易成本。
-
增加仓位数量管理,当回撤达到一定比例时降低仓位。
-
增加突破新高停损设置。
-
优化EMAS周期参数,降低交易频率。
本策略整体为稳定优质的长线持仓策略。识别趋势能力较强,风险控制到位。通过进一步优化,可望获得更好的稳定收益。
||
The Dual EMA Golden Cross Long Line strategy is a trend tracking strategy that only opens long positions. The strategy uses three moving averages, short-term EMA, medium-term EMA and long-term EMA. The specific entry rule is: open long when the price is above the long-term EMA and the short-term EMA crosses above the medium-term EMA to form a golden cross.
-
Calculate short-term EMA, medium-term EMA and long-term EMA using three EMA periods that are configurable.
-
If the price is above the long-term EMA, it proves that it is currently in a bullish trend.
-
If the short-term EMA crosses above the medium-term EMA from below to form a golden cross, it further proves that the bullish trend is strengthening.
-
When both conditions above are met at the same time, open long.
The biggest advantage of this strategy is that it can effectively identify trends by using multi-period EMAs combined judgment to avoid being misled by short-term market noise. At the same time, stop loss is configured as a risk control means to keep losses within a certain range.
The main risk of this strategy is the long position. When the market reverses, it is unable to close positions in time, leading to the risk of expanding losses. In addition, improper EMAs period setting can also lead to frequent trading and increase transaction costs.
-
Increase position sizing management to reduce positions when drawdowns reach a certain percentage.
-
Increase stop loss settings when breaking new highs.
-
Optimize EMAs period parameters to reduce trading frequency.
This strategy is overall a stable high-quality long-term holding strategy. It has strong ability to identify trends with proper risk control. With further optimization, it is expected to obtain better stable returns.
[/trans]
Strategy Arguments
| Argument | Default | Description |
|---|---|---|
| v_input_bool_1 | true | Usa Filtro di Volatilità |
| v_input_int_1 | 14 | Periodi ATR |
| v_input_float_1 | 1.5 | Moltiplicatore ATR |
| v_input_bool_2 | true | Usa Trailing Stop |
| v_input_float_2 | 15 | Percentuale Trailing Stop |
| v_input_bool_3 | true | Usa Uscita EMA Corta incrocia EMA Media al Ribasso |
| v_input_int_2 | 200 | Periodo EMA Lungo Termine |
| v_input_int_3 | 5 | Periodo EMA Breve Termine |
| v_input_int_4 | 10 | Periodo EMA Medio Termine |
Source (PineScript)
/*backtest
start: 2024-01-01 00:00:00
end: 2024-01-31 23:59:59
period: 1h
basePeriod: 15m
exchanges: [{"eid":"Futures_Binance","currency":"BTC_USDT"}]
*/

//@version=5
strategy("Strategia EMA Long con Opzioni di Uscita Avanzate e Periodi EMA Personalizzabili", overlay=true)

// Parametri di input generali
useVolatilityFilter = input.bool(true, title="Usa Filtro di Volatilità")
atrPeriods = input.int(14, title="Periodi ATR", minval=1)
atrMultiplier = input.float(1.5, title="Moltiplicatore ATR", step=0.1)
useTrailingStop = input.bool(true, title="Usa Trailing Stop")
trailingStopPercent = input.float(15.0, title="Percentuale Trailing Stop", minval=0.1, step=0.1) / 100.0
useEMAExit = input.bool(true, title="Usa Uscita EMA Corta incrocia EMA Media al Ribasso")

// Parametri di input per periodi EMA personalizzabili
emaLongTermPeriod = input.int(200, title="Periodo EMA Lungo Termine", minval=1)
emaShortTermPeriod = input.int(5, title="Periodo EMA Breve Termine", minval=1)
emaMidTermPeriod = input.int(10, title="Periodo EMA Medio Termine", minval=1)

// Calcolo delle EMA con periodi personalizzabili
longTermEMA = ta.ema(close, emaLongTermPeriod)
shortTermEMA = ta.ema(close, emaShortTermPeriod)
midTermEMA = ta.ema(close, emaMidTermPeriod)

// Calcolo ATR e soglia di volatilità
atr = ta.atr(atrPeriods)
atrThreshold = ta.sma(atr, atrPeriods) * atrMultiplier

// Condizione di entrata
enterLongCondition = close > longTermEMA and shortTermEMA > midTermEMA
enterLong = useVolatilityFilter ? (enterLongCondition and atr > atrThreshold) : enterLongCondition

if (enterLong)
    strategy.entry("Enter Long", strategy.long)

// Tracking del prezzo di entrata e del massimo prezzo raggiunto per il trailing stop
var float entryPrice = na
var float maxPriceSinceEntry = na
if (strategy.position_size > 0)
    maxPriceSinceEntry := math.max(na(maxPriceSinceEntry) ? high : maxPriceSinceEntry, high)
    entryPrice := na(entryPrice) ? strategy.position_avg_price : entryPrice
else
    maxPriceSinceEntry := na
    entryPrice := na

// Calcolo del valore del trailing stop
trailStopPrice = maxPriceSinceEntry * (1 - trailingStopPercent)

// Implementazione delle condizioni di uscita
exitCrossUnder = close < longTermEMA
emaCross = ta.crossunder(shortTermEMA, midTermEMA)

if (useEMAExit and emaCross)
    strategy.close("Enter Long", comment="EMA Cross Exit")

if (useTrailingStop)
    strategy.exit("Trailing Stop", from_entry="Enter Long", stop=trailStopPrice)

// Visualizzazioni
plot(longTermEMA, color=color.yellow, title="EMA Lungo Termine")
plot(shortTermEMA, color=color.blue, title="EMA Breve Termine")
plot(midTermEMA, color=color.green, title="EMA Medio Termine")
plot(useVolatilityFilter ? atrThreshold : na, color=color.purple, title="ATR Threshold")
plot(strategy.position_size > 0 ? trailStopPrice : na, color=color.orange, title="Trailing Stop Value", style=plot.style_linebr)
Detail
https://www.fmz.com/strategy/442623
Last Modified
2024-02-23 12:17:40
