Name
双MACD量化交易策略Dual-MACD-Quantitative-Trading-Strategy
Author
ChaoZhang
Strategy Description
[trans]
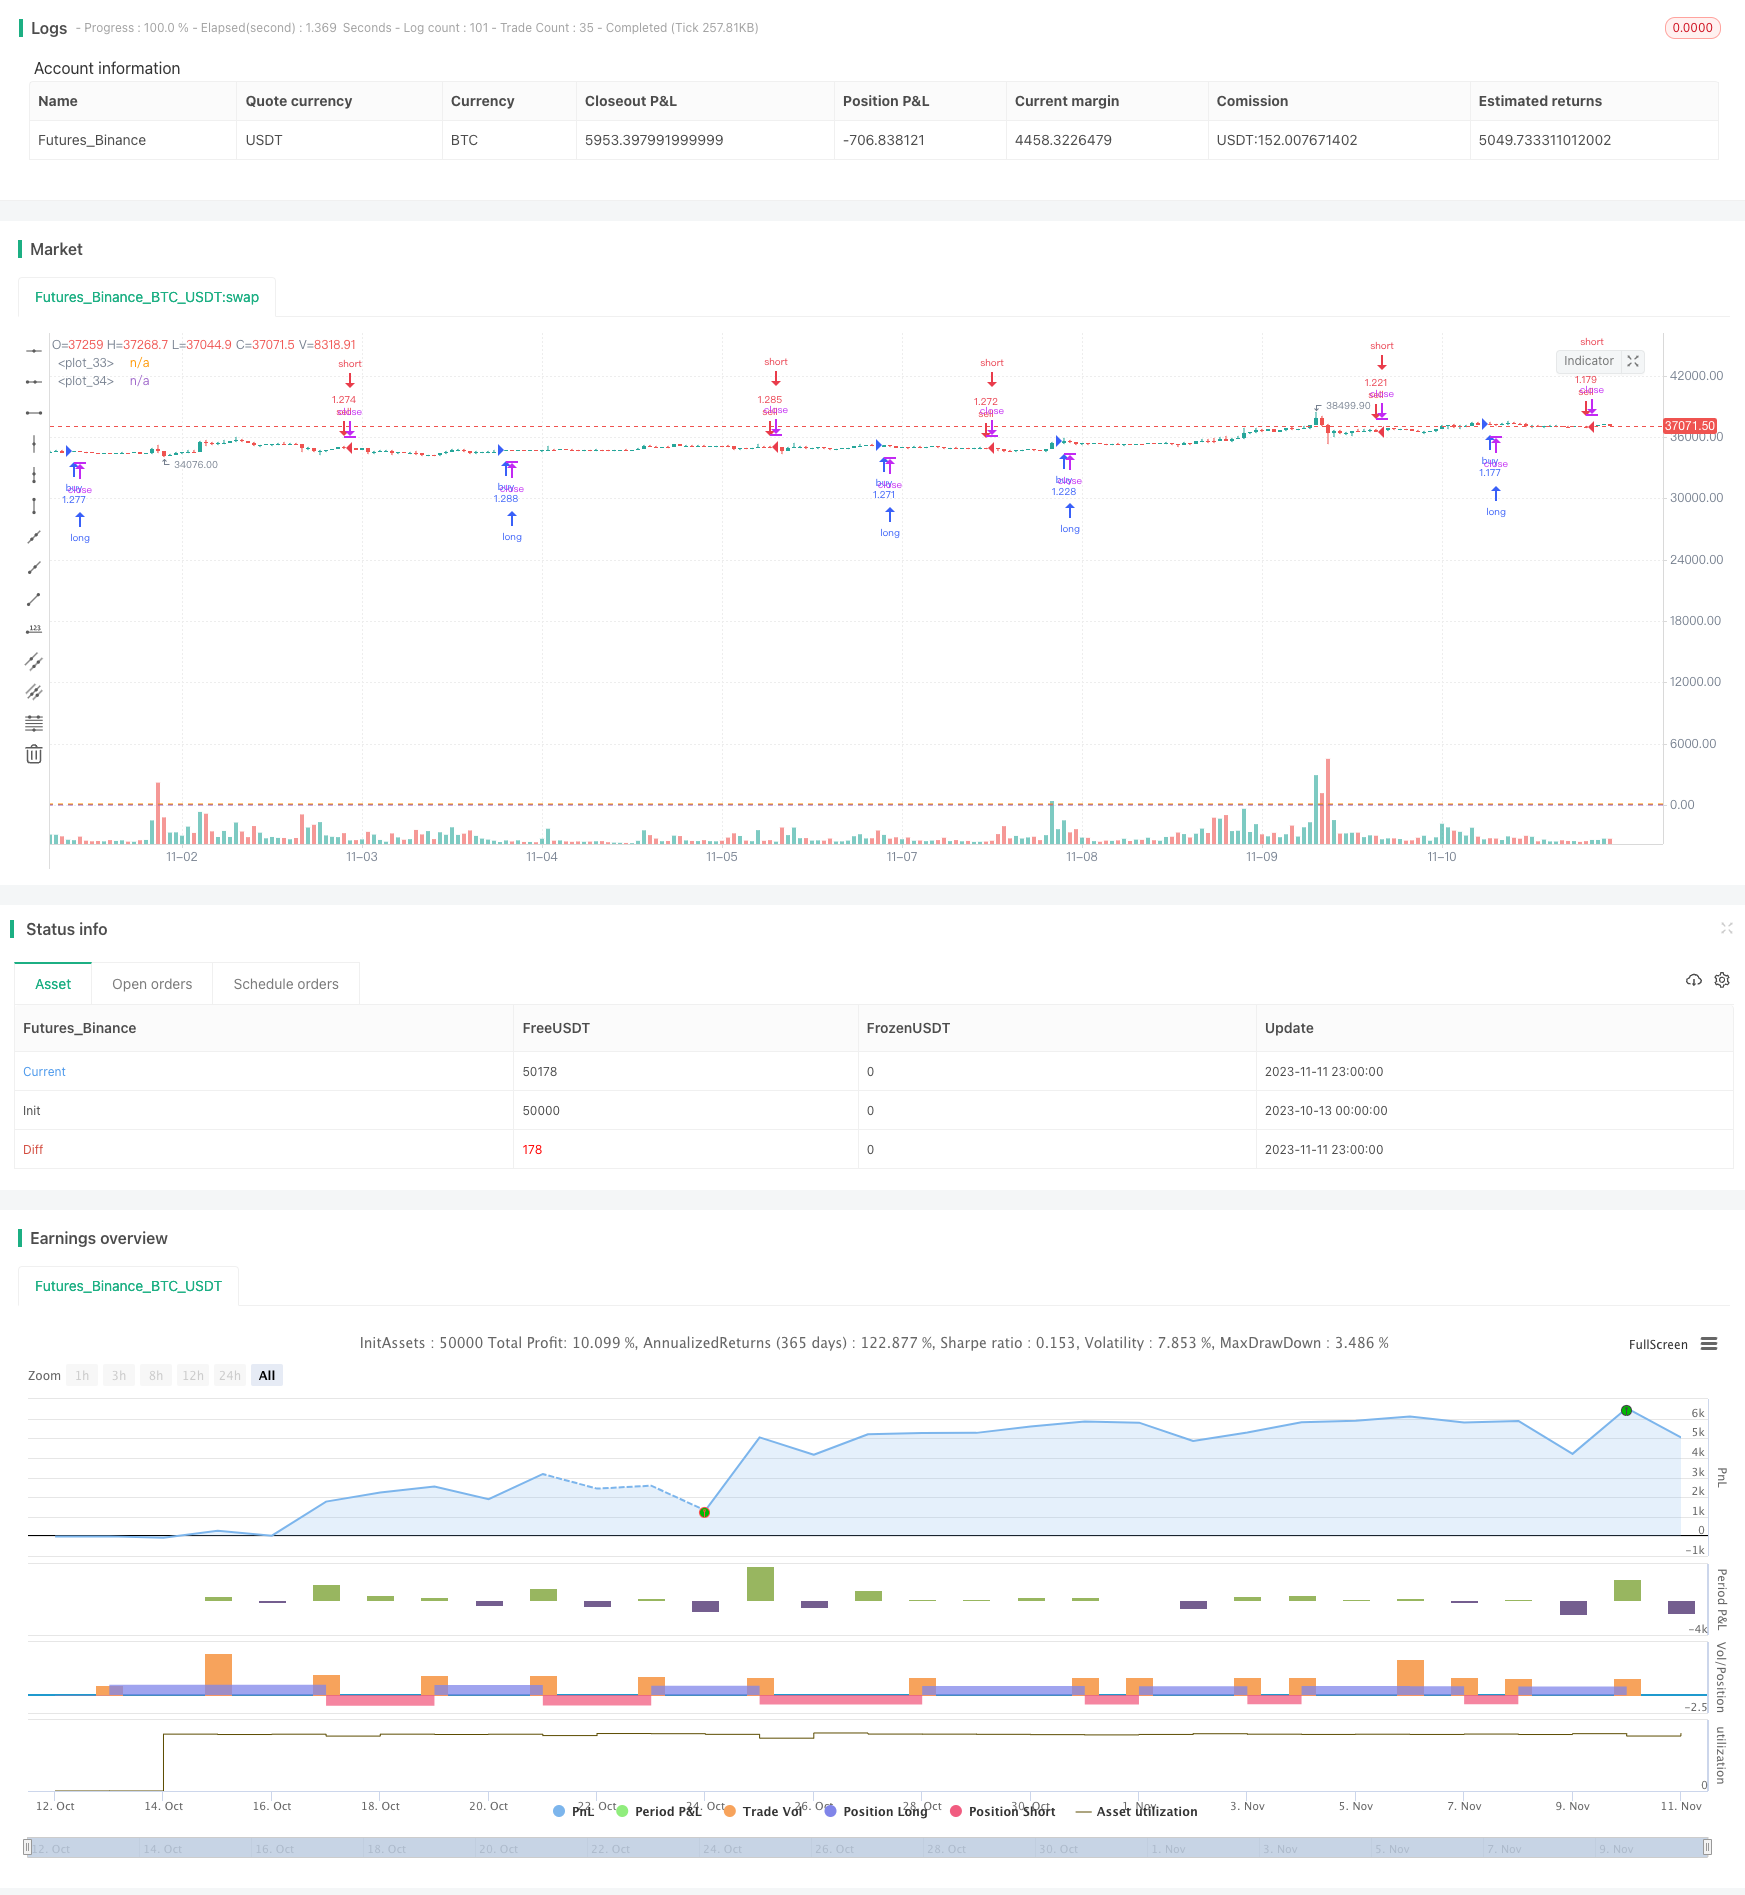
该策略运用双EMA均线系统与RSI指标的组合,在判断市场趋势的同时辅助发出交易信号,属于趋势跟踪策略。该策略简单易用,适用于多种大盘指数和数字货币,在2013年至今的回测中取得了500%以上的累计收益。
该策略使用两个不同参数设置的MACD作为主要交易指标。第一个MACD采用10周期短均线和22周期长均线,辅助线为9周期均线。第二个MACD采用21周期短均线和45周期长均线,辅助线为20周期均线。
当第一个MACD的DIFF线上穿零轴时产生买入信号,下穿零轴时产生卖出信号。第二个MACD的DIFF线发出的信号作用于确认第一个MACD信号。
同时,该策略还采用了计算价格动量的公式,以最新K线的收盘价+最高价除以前一根K线的收盘价+最高价,结果大于1表示当前处于上升趋势,产生买入信号,反之则产生卖出信号。
最后,Stoch RSI的K线大于20也会确认卖出信号。
该策略采用双EMA组合判断趋势,可以有效过滤假突破。辅助的动量公式也可避免因震荡产生错误信号。Stoch RSI指标的运用,可在超买超卖区发出卖出信号,避免追顶。
该策略仅仅使用了几个常见指标的简单组合,没有过于复杂的逻辑关系,非常易于理解与修改。参数设置也非常通用,无需针对不同品种做优化,适应性强。
根据回测结果,该策略在多种品种如股票指数、数字货币等上都取得了不错的累计收益,最大回撤控制也较为理想。可以作为一个非常通用的趋势跟踪策略来使用。
该策略主要风险在于使用均线进行判定,当价格出现大幅震荡时容易出现 whipsaw,从而亏损。此外,也没有设置止损来控制单笔损失。
Stoch RSI指标对超买超卖判定的效果并不是非常理想,容易发生错过反转信号的情况。
如果遇到价格剧烈下跌但MACD指标尚未形成死叉时,该策略也会持有仓位继续损失。
可以考虑设置止损来控制单笔损失。例如设置ATR止损或按收盘价较低的均线进行止损。
可以增加其他指标进行辅助,例如将KD指标或布林带指标与Stoch RSI组合,来更可靠的判断超买超卖。
可以增加成交量的分析,例如大量减仓时调高止损,或量能不足时避免建仓。
可以测试不同的参数组合,优化MACD的周期参数。也可以测试添加不同周期的MACD,组成多重确认。
该双MACD量化交易策略整体思路简单清晰,采用双EMA组合判断趋势,辅以动量指标避免错误信号,可以筛选出较好的交易时机。该策略参数设置通用,实际表现稳定,可以作为基础策略来进行优化调整。下一步可以通过修正止损方式、增加成交量分析、组合其他指标等手段来进一步增强策略的稳定性和收益率。
||
This strategy utilizes the combination of dual EMA systems and RSI indicators to determine market trends while generating trading signals. It belongs to the trend following strategies. This simple and easy-to-use strategy is applicable to various major indices and cryptocurrencies. It has achieved over 500% cumulative returns in backtests from 2013 to present.
This strategy employs two MACDs with different parameter settings as the primary trading indicators. The first MACD adopts 10-period short EMA, 22-period long EMA, and 9-period signal line. The second MACD uses 21-period short EMA, 45-period long EMA, and 20-period signal line.
The first MACD generates buy signals when the DIFF line crosses above zero, and sell signals when crossing below zero. The signals from the second MACD act to confirm those from the first MACD.
In addition, the strategy utilizes a price momentum formula to determine the trend. The latest close + high divided by previous close + high above 1 indicates an upward trend and generates buy signals, and vice versa for sell signals.
Lastly, Stoch RSI K line above 20 helps confirm sell signals.
The dual EMA mechanism in this strategy can effectively filter false breakouts. The supplementary momentum formula also avoids wrong signals caused by volatility. The incorporation of Stoch RSI avoids chasing tops by issuing sell signals around overbought areas.
This strategy only uses simple combinations of several common indicators without overly complex logic relationships, which makes it very easy to understand and modify. The parameter settings are also quite universal without the need for optimization for different products, giving the strategy great adaptability.
According to backtest results, this strategy has achieved decent cumulative returns and maximum drawdown control across various products like stock indices and cryptocurrencies. It can serve as a versatile trend following strategy.
The main risk of this strategy lies in using moving averages for determinations, which can easily cause whipsaws and losses when prices fluctuate violently. In addition, there is no stop loss mechanism to control losses on single positions.
The effectiveness of Stoch RSI in detecting overbought/oversold levels is not ideal. It may miss reversal signals frequently.
If prices crash sharply but MACD has not formed a death cross yet, this strategy will hold onto losing positions and continue taking losses.
Consider adding stop loss to control single position losses, e.g. ATR stop loss or stop loss based on lower moving averages.
Add other indicators for confirmation, such as combining KD or Bollinger Bands with Stoch RSI for more reliable overbought/oversold detection.
Incorporate volume analysis, like raising stop loss when significant selling volume appears, or avoiding new positions when volume is weak.
Test different parameter combinations and optimize MACD periods. Also test adding MACDs of other timeframes for multiple confirmation.
The dual MACD quantitative trading strategy has simple and clear logic, using dual EMA crossovers to determine trends, supplemented by momentum indicators to avoid wrong signals. It can filter out high-probability trading opportunities. The universal parameter settings and solid performance make it a good foundation strategy to build upon. The next steps are to further enhance its stability and profitability by improving stop loss mechanisms, adding volume analysis, combining other indicators, etc.
[/trans]
Strategy Arguments
| Argument | Default | Description |
|---|---|---|
| v_input_1 | 10 | fastLength |
| v_input_2 | 22 | slowlength |
| v_input_3 | 9 | MACDLength |
| v_input_4 | 21 | fastLength2 |
| v_input_5 | 45 | slowlength2 |
| v_input_6 | 20 | MACDLength2 |
| v_input_7 | 2 | K smoothing Stoch RSI |
| v_input_8 | 3 | D smoothing for Stoch RSI |
| v_input_9 | 7 | RSI Length |
| v_input_10 | 8 | Stochastic Length |
| v_input_11_close | 0 | RSI Source: close |
| v_input_12 | 2018 | Year to start backtesting from |
Source (PineScript)
/*backtest
start: 2023-10-13 00:00:00
end: 2023-11-12 00:00:00
period: 1h
basePeriod: 15m
exchanges: [{"eid":"Futures_Binance","currency":"BTC_USDT"}]
*/

//@version=2
strategy("Multiple MACD RSI simple strategy", overlay=true, initial_capital=5000, default_qty_type=strategy.percent_of_equity, default_qty_value=80, pyramiding=0, calc_on_order_fills=true)

fastLength = input(10)
slowlength = input(22)
MACDLength = input(9)

MACD = ema(close, fastLength) - ema(close, slowlength)
aMACD = sma(MACD, MACDLength)
delta = MACD - aMACD

fastLength2 = input(21)
slowlength2 = input(45)
MACDLength2 = input(20)

MACD2 = ema(open, fastLength2) - ema(open, slowlength2)
aMACD2 = sma(MACD2, MACDLength2)
delta2 = MACD2 - aMACD2


uptrend = (close + high)/(close[1] + high[1])
downtrend = (close + low)/(close[1] + low[1])

smoothK = input(2, minval=1, title="K smoothing Stoch RSI")
smoothD = input(3, minval=1, title= "D smoothing for Stoch RSI")
lengthRSI = input(7, minval=1, title="RSI Length")
lengthStoch = input(8, minval=1, title="Stochastic Length")
src = input(close, title="RSI Source")

rsi1 = rsi(src, lengthRSI)
k = sma(stoch(rsi1, rsi1, rsi1, lengthStoch), smoothK)
d = sma(k, smoothD)
h0 = hline(80)
h1 = hline(20)

yearin = input(2018, title="Year to start backtesting from")

if (delta > 0) and (year>=yearin) and (delta2 > 0) and (uptrend > 1)
    strategy.entry("buy", strategy.long, comment="buy")

if (delta < 0) and (year>=yearin) and (delta2 < 0) and (downtrend < 1) and (d > 20)
    strategy.entry("sell", strategy.short, comment="sell")

//plot(strategy.equity, title="equity", color=red, linewidth=2, style=areabr)
Detail
https://www.fmz.com/strategy/431974
Last Modified
2023-11-13 18:04:07
