Name
反转动量破窗策略Reversal-Momentum-Breakout-Strategy
Author
ChaoZhang
Strategy Description
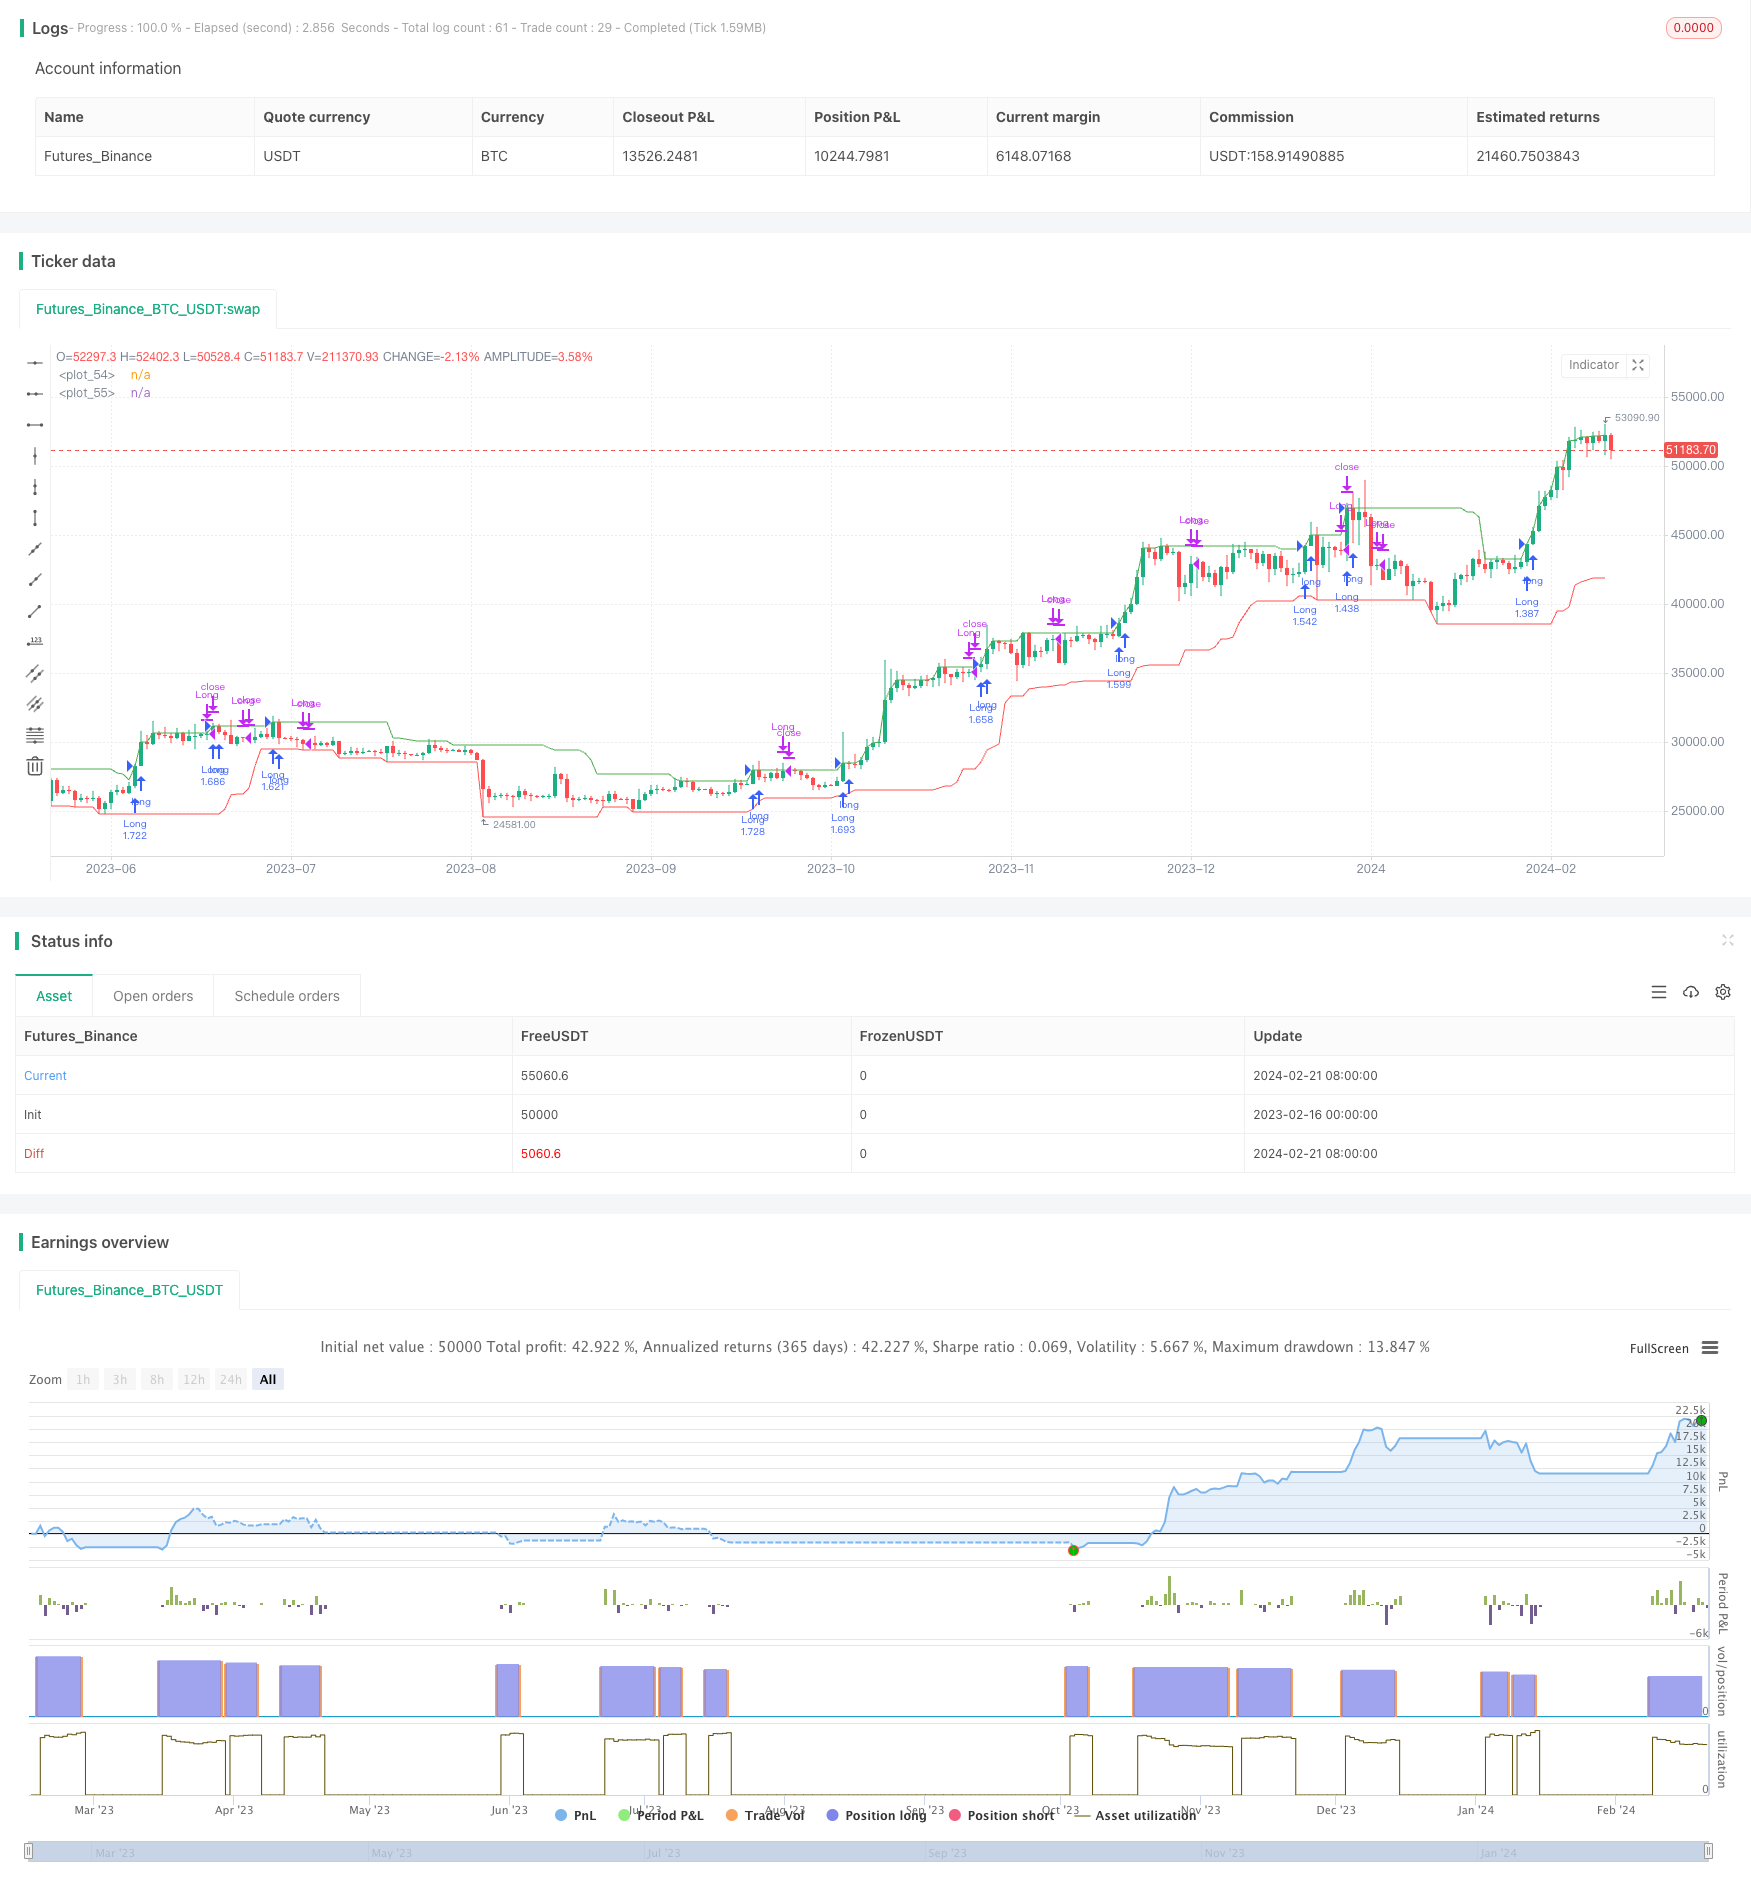
反转动量破窗策略(Reversal Momentum Breakout Strategy)是一个利用价格反转和动量指标来产生交易信号的量化交易策略。该策略基于“动量先行”的理论,通过追踪一定周期内的最高价和最低价,判断市场是否处于反转的关键点,以捕捉反转机会。
该策略主要通过计算指定周期(如20天)内的最高价和最低价,判断市场是否处于关键的反转点。具体逻辑如下:
-
计算最近20天的最高价(window_high)和最低价(window_low)。
-
如果当前K线的最高价高于过去20天的最高价(即出现新高),则进入高点反转监测期,计数器置为5天。
-
如果最高价未创出新高,则每日计数器减1。当计数器减为0时,高点反转监测期结束。
-
对最低价的判断逻辑相似,如果出现新低,则进入低点反转监测期。
-
在反转监测期内,进行做多或做空操作。如果在反转关键点附近出现反转信号,则可以捕捉较大的行情。
该策略同时设定了开始交易的时间,避免在历史数据中产生交易信号。
反转动量破窗策略具有以下主要优势:
-
捕捉反转机会,适合反转行情。在市场持续上涨或下跌后,常出现一定程度的反转。该策略可以捕捉这些转折点。
-
动量先行,比较灵敏。计算一定周期的最高价和最低价,可以比较敏感地判断价格反转的趋势和时机。
-
设定反转监测期,避免假信号。仅在反转关键点附近出信号,可以过滤掉部分噪音。
-
允许做多做空操作。根据行情方向进行长短头交替操作。
-
规则相对简单,容易实现。该策略主要依赖简单的价格和动量指标,容易转化为代码实现。
反转动量破窗策略也存在以下主要风险:
-
反转预判不准。市场持续directional时,该策略会产生损失。
-
无法全面考量大盘走势。个股反转不一定代表大盘反转,需要结合大盘分析。
-
回撤可能较大。反转没有出现时,NetDevice可能扩大。
-
数据拟合风险。策略可能过于依赖历史数据,实盘中效果可能差于回测。
-
参数敏感。窗口期和反转计数器等参数的设置会影响策略稳定性。
对应风险的解决方法包括:优化止损策略,考量大盘因素,调整参数组合进行稳定性检验等。
该策略的主要优化方向包括:
-
结合大盘指标。比较大盘强弱,避免在大盘不利的环境中进行反转。
-
多因子筛选标的。选择财务状况优良,基本面向好,价格被高估的个股。
-
优化参数组合。调整窗口期,反转计数器参数,寻找最优参数组合。
-
添加止损策略。如跟踪型止损、幅度止损等,控制最大回撤。
-
增加机器学习。使用AI模型预测价格反转概率,提高信号准确性。
反转动量破窗策略通过跟踪价格和动量指标,寻找反转机会。它反应灵敏,可以识别反转的趋势和时点。但也存在一定程度的风险,需要进行适当优化和风险控制。总体而言,在掌握该策略的原理并做出优化后,它可以成为量化交易体系的有效组成部分。
||
The Reversal Momentum Breakout Strategy is a quantitative trading strategy that generates trading signals using price reversal and momentum indicators. Based on the theory of "momentum leads price", this strategy tracks the highest and lowest prices over a certain period to determine whether the market is at a key reversal point to capture reversal opportunities.
The core logic of this strategy is to identify market reversal points by calculating the highest and lowest prices over a specified lookback window (e.g. 20 days). The specific logic is:
-
Calculate the highest price (window_high) and lowest price (window_low) over the past 20 days.
-
If today's high is higher than the maximum of the past 20 days (a new 20-day high), enter the high reversal monitoring period and set the counter to 5 days.
-
If no new high occurs, deduct the counter by 1 each day. When the counter reaches 0, the high reversal monitoring period ends.
-
The judgment logic for the lowest price is similar. If a new low occurs, enter the low reversal monitoring period.
-
long and short positions are taken within the reversal monitoring periods. Reversal signals near the key reversal points allow capturing larger moves.
The strategy also sets the start trading time to avoid generating signals on historical data.
The Reversal Momentum Breakout Strategy has the following main advantages:
-
Captures reversal opportunities, suitable for reversal trends. Markets often show some degree of reversal after a sustained uptrend or downtrend. This strategy aims to capture these turning points.
-
Momentum leads, relatively sensitive. Tracking the highest and lowest prices over a window can sensitively identify price reversal trends and timing.
-
Reversal monitoring periods avoid false signals. Signals are generated only around key reversal points, filtering out some noise.
-
Allows long and short positions. Alternates between long and short following market direction.
-
Relatively simple logic, easy to implement. Mainly relies on price and simple momentum indicators, easy to code.
The main risks of this strategy include:
-
Inaccurate reversal prediction. The strategy can incur losses if the market trends directionally.
-
Overall market trends not considered. Individual stock reversals do not necessarily represent market reversals. Market analysis should be combined.
-
Potentially large drawdowns. Drawdown may expand without actual reversals.
-
Data fitting bias. Performance may significantly differ from backtests.
-
Parameter sensitivity. Window period, counter parameters etc. affect stability.
Corresponding risk control methods include optimizing stop loss, incorporating market factors, adjusting parameter combinations and verifying stability.
The main optimization directions include:
-
Incorporate market indicators. Assess market strength to avoid unfavorable big picture environments.
-
Multi-factor stock selection. Select stocks with sound fundamentals and overvaluation.
-
Parameter optimization. Adjust window period and counter parameters to find optimal parameter combinations.
-
Add stop loss strategies e.g trailing stops, volatility stops to control max drawdown.
-
Increase machine learning predictive accuracy of price reversals.
The Reversal Momentum Breakout Strategy identifies reversal opportunities by tracking price and momentum. It reacts sensitively and identifies reversal trends and timing. But it has risks that require proper optimizations and risk control. Overall, when thoroughly understood and optimized, it can form an effective component of a quantitative trading system.
[/trans]
Strategy Arguments
| Argument | Default | Description |
|---|---|---|
| v_input_int_1 | 20 | New Highs and Lows Window |
| v_input_int_2 | 5 | Decay |
| v_input_1 | timestamp(1 Jan 2023) | Start Date |
| v_input_bool_1 | false | Allow shorting |
Source (PineScript)
/*backtest
start: 2023-02-16 00:00:00
end: 2024-02-22 00:00:00
period: 1d
basePeriod: 1h
exchanges: [{"eid":"Futures_Binance","currency":"BTC_USDT"}]
*/

//@version=5
strategy("New Highs and Lows Momentum Strategy", overlay = true, default_qty_type = strategy.percent_of_equity, default_qty_value = 100)

window = input.int(20, title="New Highs and Lows Window", minval=1)
decay = input.int(5, title="Decay", minval=1)
startDate = input(timestamp("1 Jan 2023"), title = "Start Date")
allowShort = input.bool(false, title = "Allow shorting")

var int highDecayCounter = 0
var bool isHighPeriod = false
var int lowDecayCounter = 0
var bool isLowPeriod = false

inTradeWindow = true

window_high = ta.highest(close, window)
window_low = ta.lowest(low, window)

// Logic for Highs
if window_high > ta.highest(close, window)[1]
    highDecayCounter := decay
    isHighPeriod := true
else
    if highDecayCounter > 0
        highDecayCounter := highDecayCounter - 1
    else
        isHighPeriod := false

// Logic for Lows
if window_low < ta.lowest(low, window)[1]
    lowDecayCounter := decay
    isLowPeriod := true
else
    if lowDecayCounter > 0
        lowDecayCounter := lowDecayCounter - 1
    else
        isLowPeriod := false

// Strategy Execution
if inTradeWindow
    if isHighPeriod and highDecayCounter == decay
        strategy.entry("Long", strategy.long)

    if isHighPeriod and highDecayCounter == 0
        strategy.close("Long")

    if isLowPeriod and lowDecayCounter == decay and allowShort
        strategy.entry("Short", strategy.short)

    if isLowPeriod and lowDecayCounter == 0 and allowShort
        strategy.close("Short")

// Plotting
plot(window_high, color=color.green)
plot(window_low, color=color.red)
Detail
https://www.fmz.com/strategy/442621
Last Modified
2024-02-23 12:11:32
