Name
反转向量RSI趋势跟踪ETF交易策略Reversal-RSI-Trend-Tracking-ETF-Trading-Strategy
Author
ChaoZhang
Strategy Description
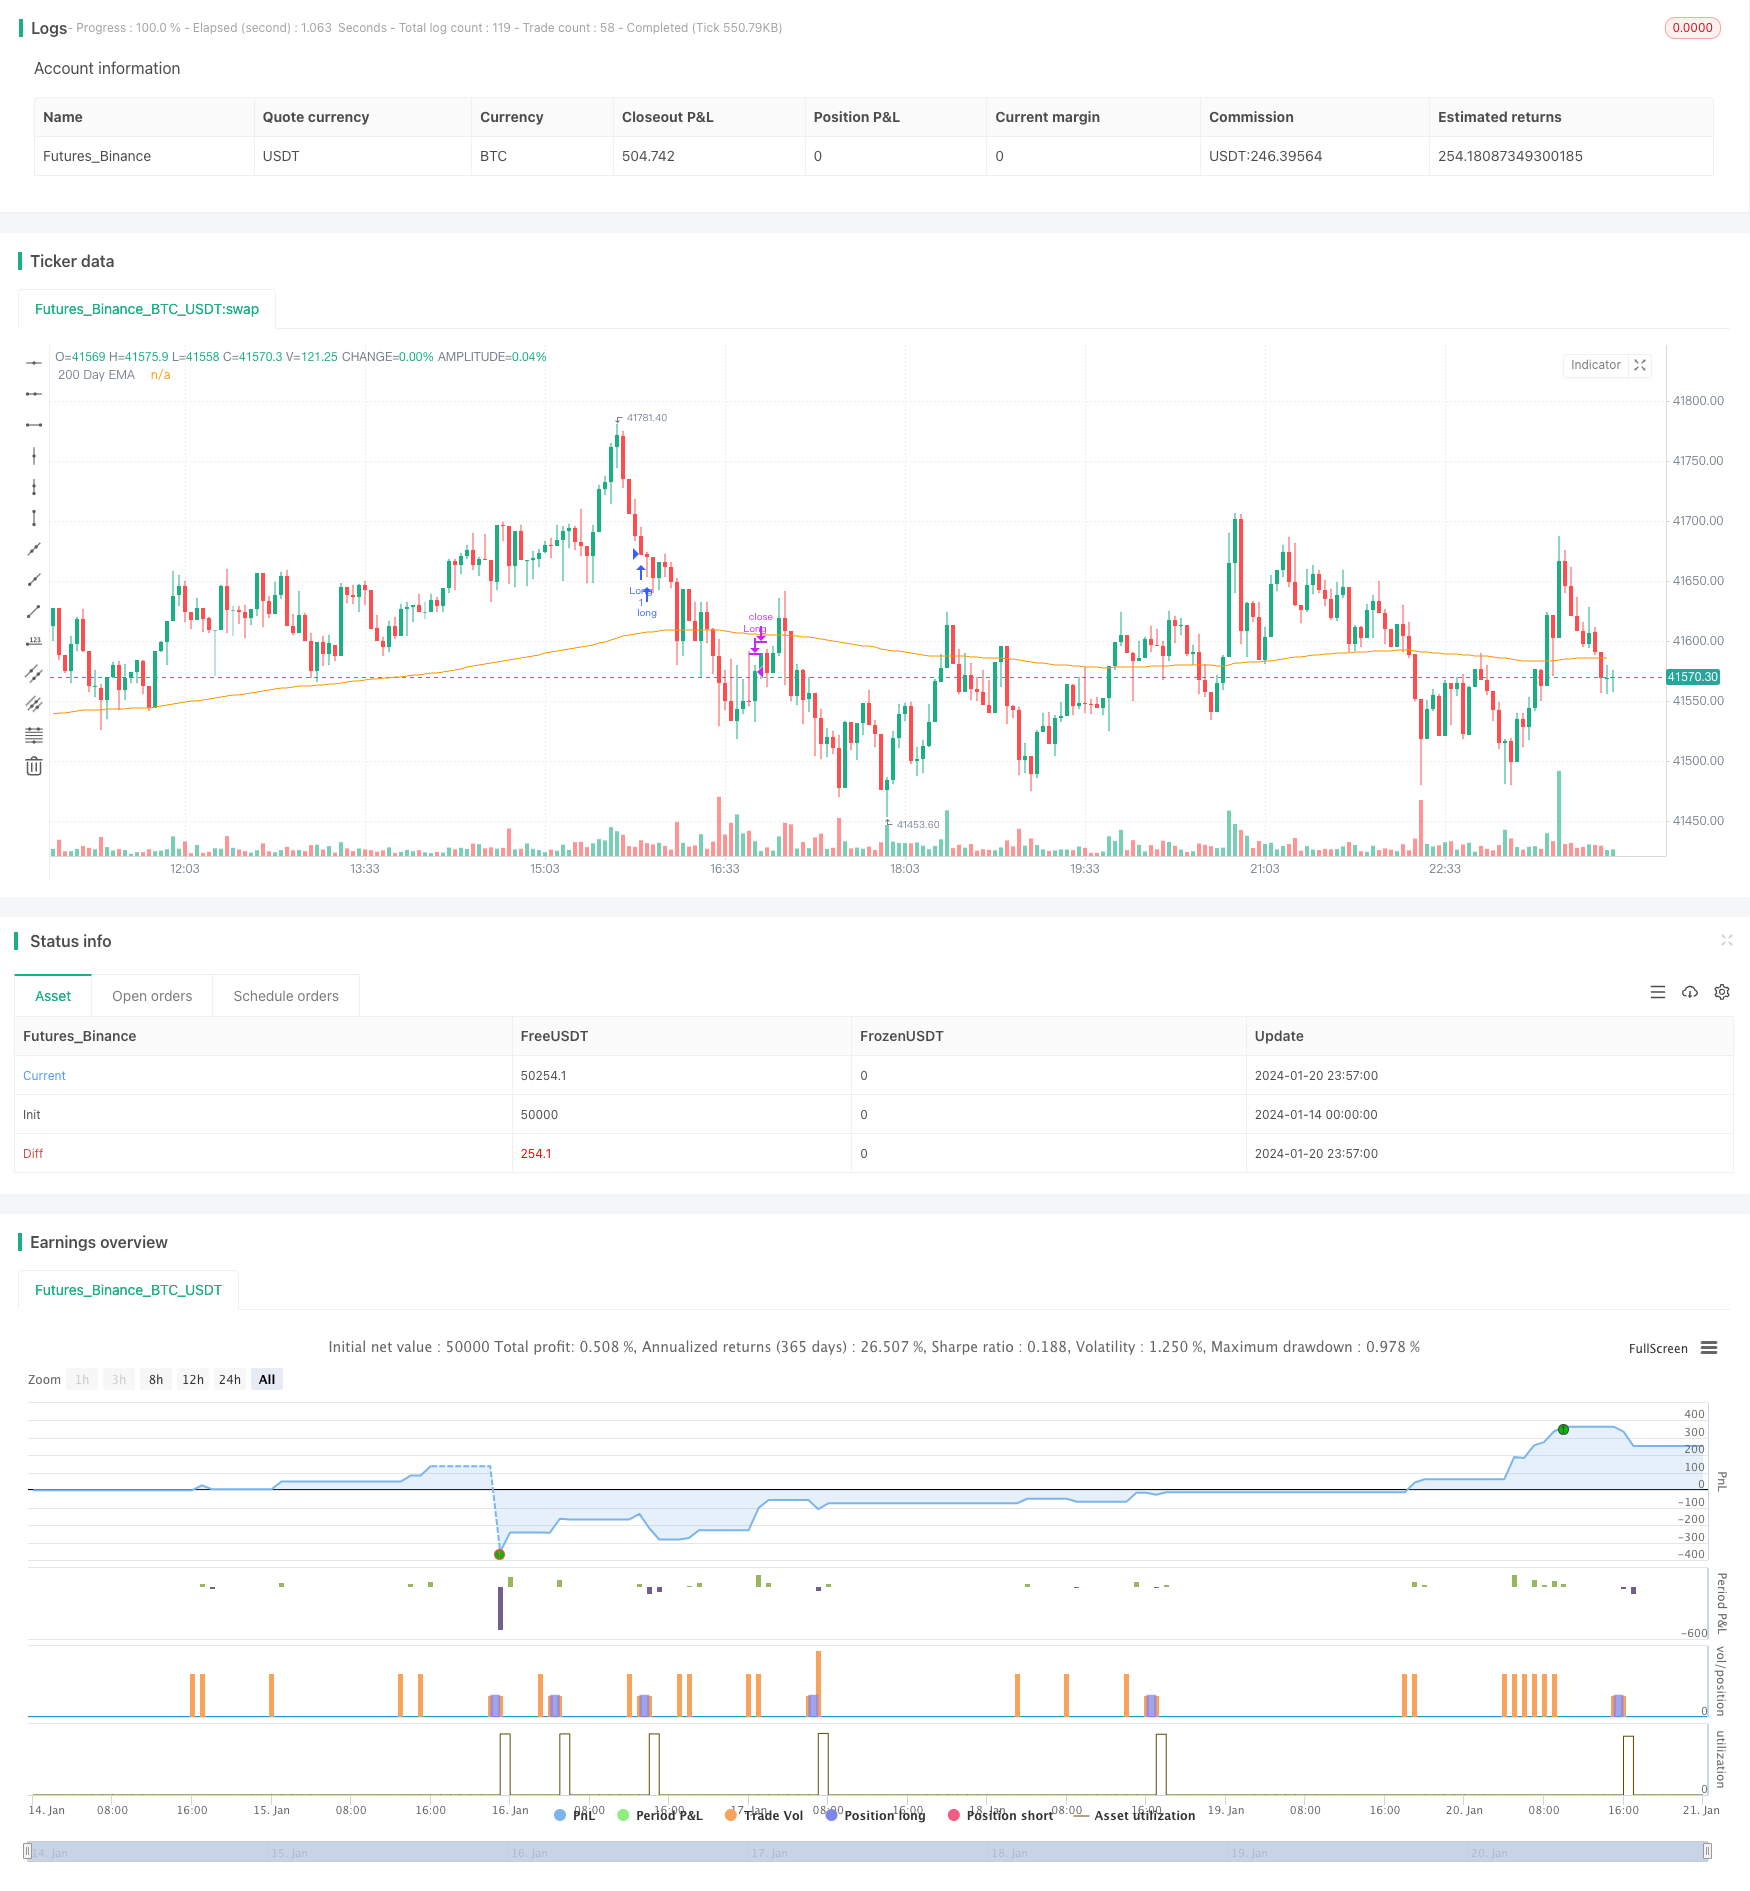
本策略是一个基于相对强弱指数(RSI)的反转趋势追踪ETF交易策略。它通过RSI指标判断短期超买超卖现象,进行反转entries和exits。同时结合200日移动平均线来判断整体趋势方向。
该策略的核心逻辑基于RSI指标的反转原理。RSI指标通过计算一段时间内的平均涨跌幅度,来判断该交易品种是否处于超买或超卖状态。当RSI高于70时代表超买,RSI低于30时代表超卖。这时就有可能出现反转行情。
本策略利用此原理,设定了当日RSI低于可调参数TodaysMinRSI,且3天前RSI低于可调参数Day3RSIMax时,可以进行买入。这表示价格可能处于短期超卖区域,有反弹的可能。同时要求3天内RSI呈下降趋势,即RSI持续下滑才买入,避免假反弹。
策略的退出机制是当RSI指标再次超过可调参数Exit RSI的阈值时,认为反弹结束,此时进行平仓退出。
该策略还引入200日移动平均线作为整体趋势判断。只有当价格高于200日线时,才可以进行买入操作。这有助于确保只在趋势向上阶段买入,避免逆势交易带来的风险。
- 利用RSI指标判断超买超卖区域,bellion的可能性大。
- 结合200日线判断大趋势方向,有助于避免逆势交易。
- RSI反转交易原理经典且可靠,成功率高。
- 可调参数提供灵活性,可以针对不同品种进行优化。
- RSI指标存在假突破的可能,无法完全避免亏损单。可以设置止损来控制单笔损失。
- 反转失败可能导致亏损扩大。可以缩短持仓时间,及时止损退出。
- 参数设置不当可能导致过于激进,也可能过于保守从而错过交易机会。必须针对品种进行参数优化测试。
- 增加其他指标结合,如KDJ、布林带等,形成指标组合,提高信号的准确性。
- 增加移动止损策略,让止损水平可变,减少亏损。
- 增加交易量或资金管理模块,控制每个交易的风险敞口。
- 针对不同品种参数进行优化和回测,制定适应该品种的参数组合。
本策略利用RSI指标的经典买卖点原理,通过判断超买超卖区域进行反转entries和exits。同时考虑大趋势判断和参数优化空间,是一个可靠性较高的短期反转ETF策略。通过进一步优化,可以成为具有实战效果的量化策略。
||
This strategy is a reversal trend tracking ETF trading strategy based on the Relative Strength Index (RSI). It judges the short-term overbought and oversold conditions through the RSI indicator to make reversal entries and exits. Meanwhile, it uses the 200-day moving average to determine the overall trend direction.
The core logic of this strategy is based on the reversal principle of the RSI indicator. The RSI indicator calculates the average amplitude of rises and falls over a period of time to judge whether the trading variety is in an overbought or oversold state. An RSI above 70 represents overbought conditions, while an RSI below 30 represents oversold conditions. At this point, a reversal trend may occur.
This strategy utilizes this principle by setting the buy trigger when today's RSI is below the adjustable parameter TodaysMinRSI, and the RSI 3 days ago is below the adjustable parameter Day3RSIMax. This indicates the price may be in a short-term oversold region and a bounce is likely. It also requires a downward RSI trend in the last 3 days, i.e. continuous RSI decline before buying to avoid false breakouts.
The exit mechanism of the strategy is when the RSI indicator once again exceeds the threshold value of the adjustable parameter Exit RSI, it is considered that the rebound has ended and positions should be closed there.
The strategy also introduces the 200-day moving average to judge the overall trend direction. Only when the price is above the 200-day line, long entry orders can be made. This helps ensure only buying in uptrend phases and avoids the risks of countertrend trading.
- Utilize RSI indicator to determine overbought and oversold zones where rebounds are likely.
- Incorporate 200-day line to determine major trend direction, which helps avoid countertrend trading.
- The RSI reversal trading principle is classic and reliable with high success rate.
- Adjustable parameters provide flexibility that can be optimized for different varieties.
- RSI indicator has the possibility of false breakouts, unable to completely avoid losing trades. Stop loss can be set to control single trade loss.
- Failed reversals may lead to enlarged losses. Holding period can be shortened with timely stop loss.
- Improper parameter settings may lead to over-aggressiveness or over-conservativeness, missing trade opportunities. Parameters must be optimized for each variety through backtesting.
- Incorporate other indicators like KDJ, Bollinger Bands etc to form indicator combinations, improving signal accuracy.
- Add moving stop loss strategies to make the stop loss level dynamic, reducing losses.
- Add position sizing or money management modules to control risk exposure per trade.
- Optimize parameters and backtest for different varieties to come up with parameter sets fitting each variety.
This strategy utilizes the classic RSI entry and exit points by judging overbought and oversold zones for reversal trades. Meanwhile, considering major trend and parameter optimization, it is a highly reliable short-term reversal ETF strategy. With further optimizations, it can become a quant strategy with practical effects.
[/trans]
Strategy Arguments
| Argument | Default | Description |
|---|---|---|
| v_input_1 | timestamp(01 Jan 2012 05:00 +0000) | Start Time |
| v_input_2 | timestamp(01 Jan 2099 00:00 +0000) | End Time |
| v_input_int_1 | 2 | RSI Length |
| v_input_int_2 | 10 | Today's Min RSI for Entry |
| v_input_int_3 | 60 | Max RSI 3 Days Ago for Entry |
| v_input_int_4 | 70 | Exit RSI |
Source (PineScript)
/*backtest
start: 2024-01-14 00:00:00
end: 2024-01-21 00:00:00
period: 3m
basePeriod: 1m
exchanges: [{"eid":"Futures_Binance","currency":"BTC_USDT"}]
*/

// This source code is subject to the terms of the Mozilla Public License 2.0 at https://mozilla.org/MPL/2.0/
// @version = 5
// Author = TradeAutomation


strategy(title="R3 ETF Strategy", shorttitle="R3 ETF Strategy", overlay=true)


// Backtest Date Range Inputs //
StartTime = input(defval=timestamp('01 Jan 2012 05:00 +0000'), title='Start Time')
EndTime = input(defval=timestamp('01 Jan 2099 00:00 +0000'), title='End Time')
InDateRange = true

// Calculations and Inputs //
RSILen = input.int(2, "RSI Length")
RSI = ta.rsi(close, RSILen)
TodaysMinRSI = input.int(10, "Today's Min RSI for Entry", tooltip = "The RSI must be below this number today to qualify for trade entry")
Day3RSIMax = input.int(60, "Max RSI 3 Days Ago for Entry", tooltip = "The RSI must be below this number 3 days ago to qualify for trade entry")
EMA = ta.ema(close, 200)

// Strategy Rules //
Rule1 = close>ta.ema(close, 200)
Rule2 = RSI[3]<Day3RSIMax and RSI<TodaysMinRSI
Rule3 = RSI<RSI[1] and RSI[1]<RSI[2] and RSI[2]<RSI[3]
Exit = ta.crossover(RSI, input.int(70, "Exit RSI", tooltip = "The strategy will sell when the RSI crosses over this number"))

// Plot //
plot(EMA, "200 Day EMA")

// Entry & Exit Functions //
if (InDateRange)
    strategy.entry("Long", strategy.long, when = Rule1 and Rule2 and Rule3)
//    strategy.close("Long", when = ta.crossunder(close, ATRTrailingStop))
    strategy.close("Long", when = Exit)
if (not InDateRange)
    strategy.close_all()
Detail
https://www.fmz.com/strategy/439643
Last Modified
2024-01-22 17:15:18
