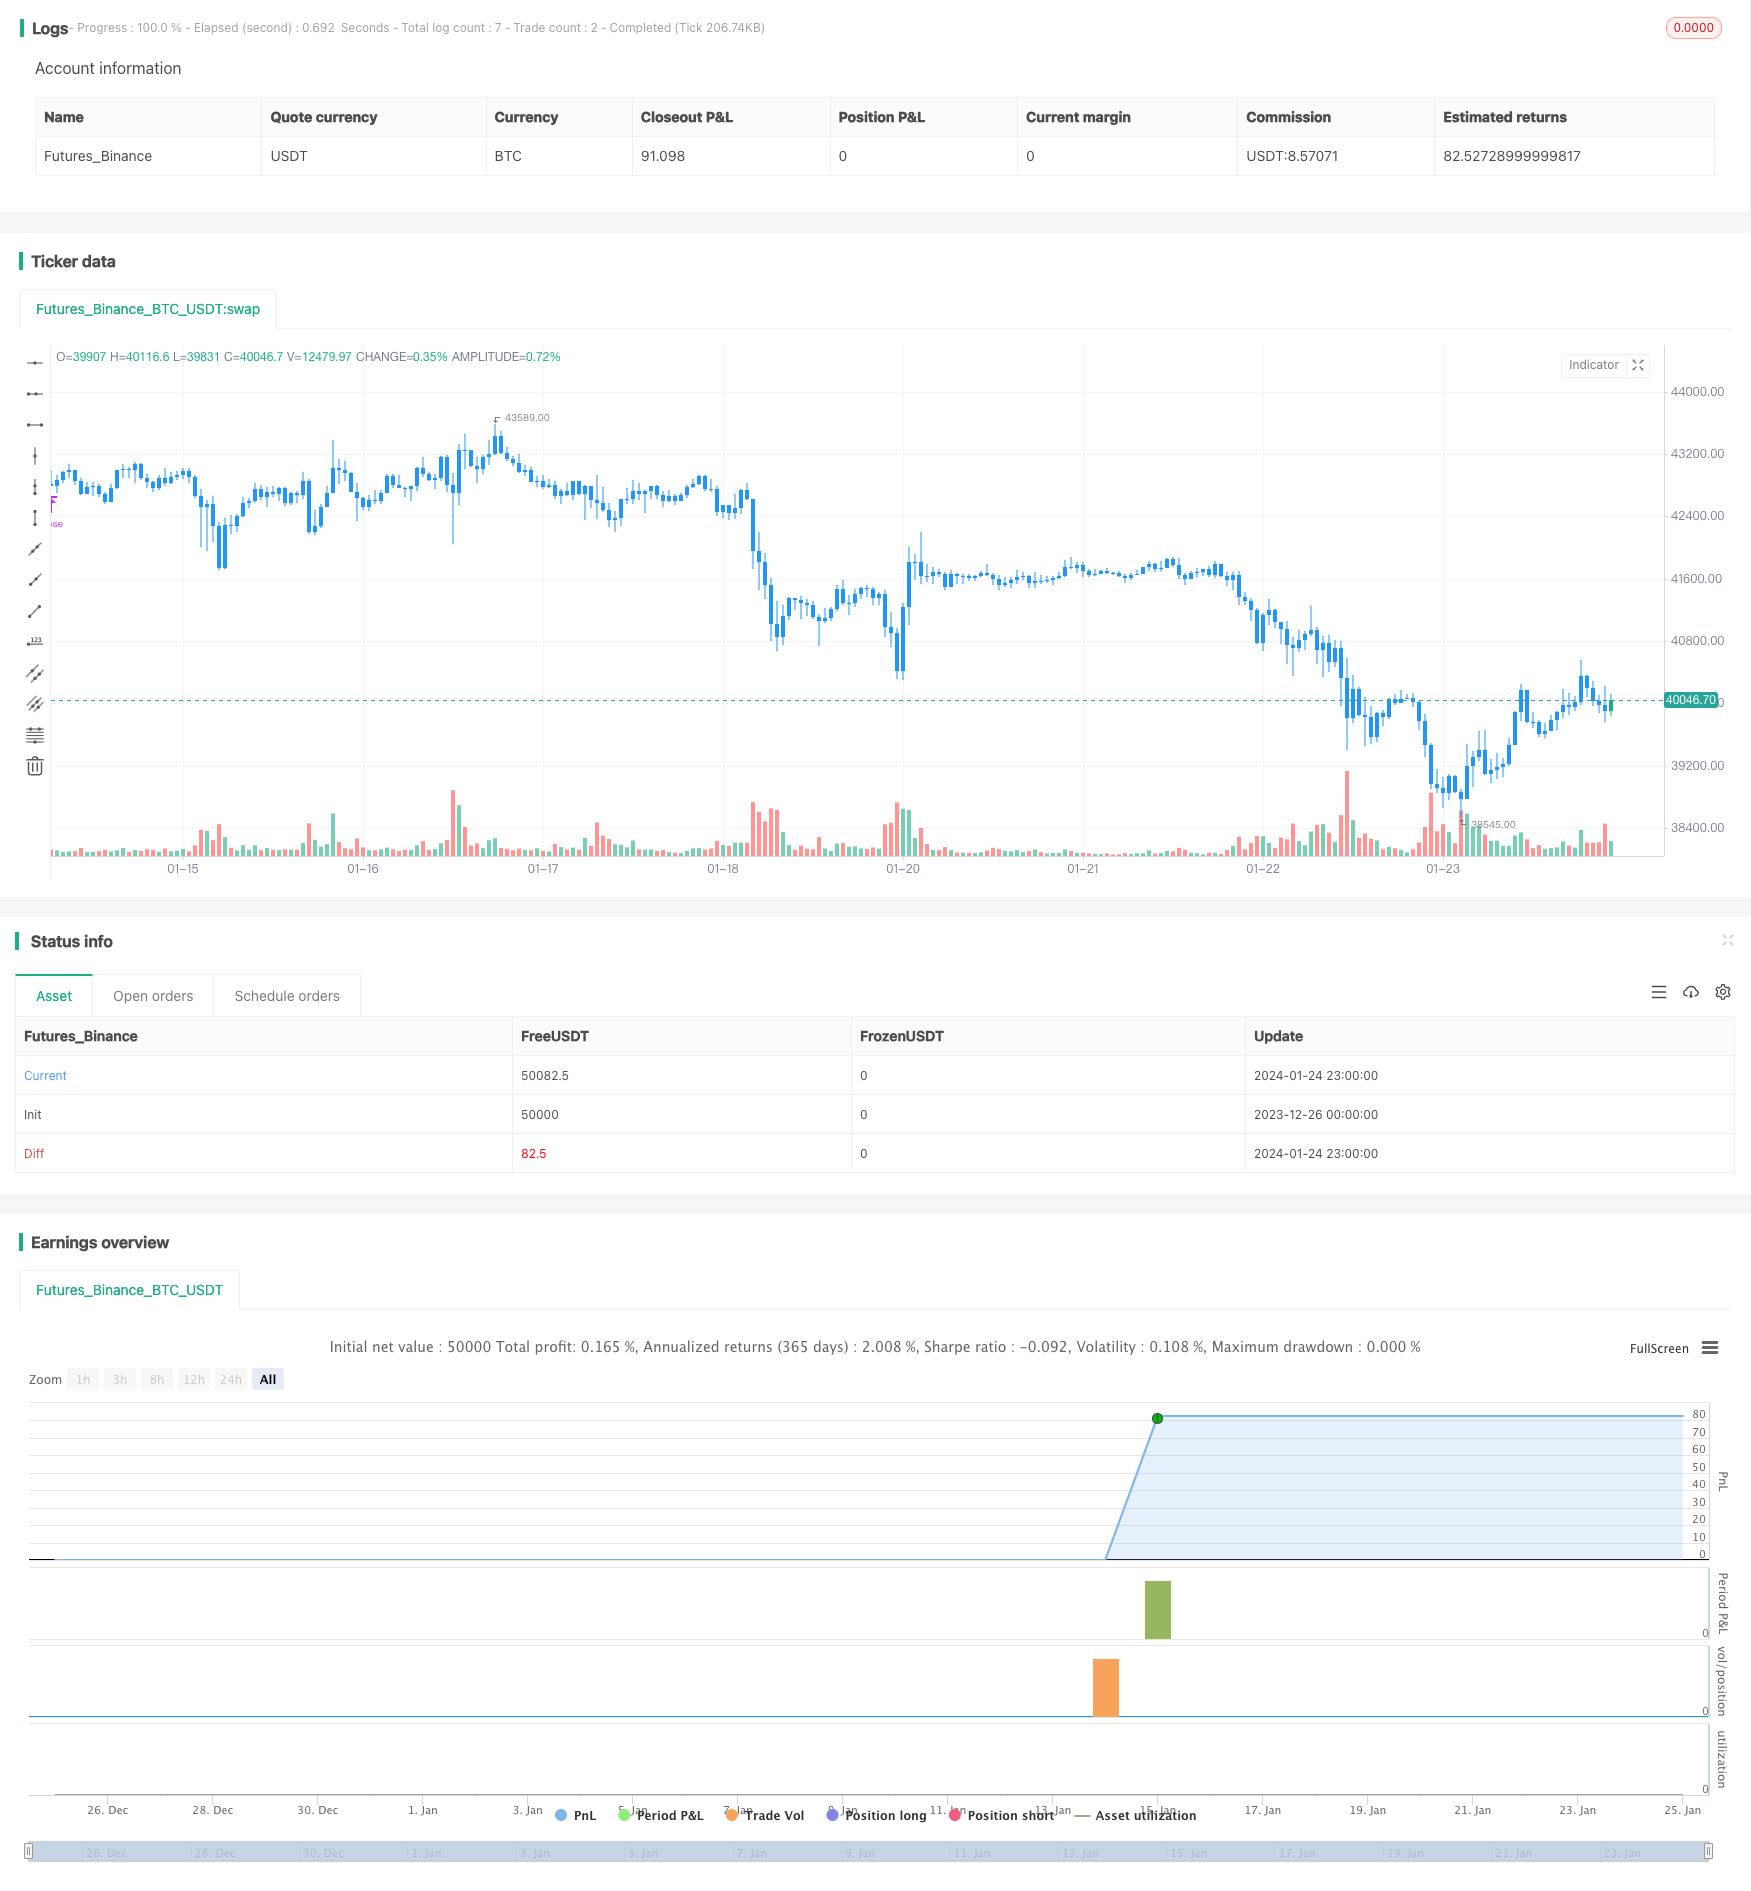
Name
反转追踪蜡烛形态策略Reversal-Candlestick-Backtesting-Strategy
Author
ChaoZhang
Strategy Description
本策略通过识别蜡烛形态,实现追踪交易信号,并结合止盈止损逻辑进行自动交易。当识别到反转形态时做多做空,达到止盈或止损后平仓。
-
识别蜡烛形态:当蜡烛实体大小小于设定阈值,且开盘价与收盘价相等时,确认为追踪交易信号。
-
做多做空:当识别到反转蜡烛形态时,若前日收盘价高于前二日,则做多;若前日收盘价低于前二日,则做空。
-
止盈止损:做多后当价格达到入场价加止盈点时止盈;做空后当价格达到入场价减止盈点时止盈;做多做空后当价格触发止损点时止损。
-
利用蜡烛反转形态,可以有效捕捉股价转折点,增强交易信号的有效性。
-
结合止盈止损机制,可以有效控制风险,锁定盈利,避免亏损扩大。
-
自动化交易,无需人工干预,降低交易成本,提高交易效率。
-
蜡烛形态判断存在一定主观性,可能出现误判的情况。
-
止盈止损点设置不当,可能错过较大行情或过早止损。
-
策略参数需要不断测试优化,否则可能导致过拟合。
-
优化蜡烛形态判断条件,结合更多K线指标提高判断准确性。
-
测试不同交易品种,调整止盈止损点位,优化参数。
-
增加算法判断更多交易信号,丰富策略逻辑。
-
添加仓位管理模块,可以根据参考指标动态调整仓位。
本策略通过蜡烛形态识别反转信号,设置止盈止损规则,实现自动化交易。策略简单易于理解,有一定的实用价值。但识别准确性和参数优化空间还有待提高,建议作进一步测试和优化,才能推荐实盘应用。
||
This strategy identifies candlestick patterns to track trading signals and incorporates take profit and stop loss logic for automated trading. It goes long or short when reversal patterns are identified and closes positions when take profit or stop loss is triggered.
-
Identify candlestick patterns: When candle body size is smaller than threshold and open equals close, it is identified as tracking signal.
-
Long/short: When reversal candlestick pattern identified, go long if previous close higher than 2 days ago, go short if previous close lower than 2 days ago.
-
Take profit/Stop loss: When price reaches entry price + take profit points when long, take profit; When price reaches entry price - take profit points when short, take profit; When price triggers stop loss point after long/short, stop loss.
-
Candlestick reversal patterns effectively capture turning points of price, enhancing validity of trading signals.
-
Take profit/Stop loss mechanism effectively controls risks, locks in profits, avoids enlarging losses.
-
Automated trading without manual intervention reduces trading costs and improves efficiency.
-
Subjectivity in candlestick pattern identification may lead to misjudgements.
-
Improper take profit/stop loss point settings may miss larger trends or stop loss prematurely.
-
Strategy parameters need constant testing and optimization, otherwise overfitting.
-
Optimize candlestick identification conditions with more indicators to improve accuracy.
-
Test on different trading instruments, adjust take profit/stop loss points, optimize parameters.
-
Enrich strategy logic by adding algorithms to identify more trading signals.
-
Add position sizing module to dynamically adjust positions based on reference indicators.
This strategy identifies reversal signals through candlestick patterns and sets take profit/stop loss rules for automated trading. The strategy is simple and practical to a certain extent. But there is room for improvement in terms of identification accuracy and parameter optimization. Further testing and optimization are recommended before applying in live trading.
[/trans]
Strategy Arguments
| Argument | Default | Description |
|---|---|---|
| v_input_1 | 10 | Take Profit pip |
| v_input_2 | 10 | Stop Loss pip |
| v_input_3 | 0.5 | Min. Size Body pip |
Source (PineScript)
/*backtest
start: 2023-12-26 00:00:00
end: 2024-01-25 00:00:00
period: 1h
basePeriod: 15m
exchanges: [{"eid":"Futures_Binance","currency":"BTC_USDT"}]
*/

//@version=3
////////////////////////////////////////////////////////////
//  Copyright by HPotter v1.0 30/01/2019
//   This is a candlestick where the open and close are the same.
// WARNING:
// - For purpose educate only
// - This script to change bars colors.
////////////////////////////////////////////////////////////
strategy(title = "Doji Backtest", overlay = true)
input_takeprofit = input(10, title="Take Profit pip", step=0.01)
input_stoploss = input(10, title="Stop Loss pip", step=0.01)
input_minsizebody = input(0.5, title="Min. Size Body pip", step=0.01)
barcolor(abs(close - open) <= input_minsizebody ? open == close ? yellow : na : na)
possell = 0.0
posbuy = 0.0
pospricebuy = 0.0
pospricesell = 0.0
barcolornow = blue
pospricesell := close< close[2] ? abs(close - open) <= input_minsizebody ? open == close ? close : nz(pospricesell[1], 0) : nz(pospricesell[1], 0) : nz(pospricesell[1], 0)
possell := iff(pospricesell > 0 , -1, 0)
barcolornow := possell == -1 ? red: posbuy == 1 ? green : blue
pospricesell := iff(low <= pospricesell - input_takeprofit and pospricesell > 0, 0 ,  nz(pospricesell, 0))
pospricesell := iff(high >= pospricesell + input_stoploss and pospricesell > 0, 0 ,  nz(pospricesell, 0))
pospricebuy := close > close[2] ? abs(close - open) <= input_minsizebody ? open == close ? close : nz(pospricebuy[1], 0) : nz(pospricebuy[1], 0) : nz(pospricebuy[1], 0)
posbuy := iff(pospricebuy > 0 , 1, 0)
barcolornow := posbuy == 1 ? green: barcolornow
pospricebuy := iff(high >= pospricebuy + input_takeprofit and pospricebuy > 0, 0 ,  nz(pospricebuy, 0))
pospricebuy := iff(low <= pospricebuy - input_stoploss and pospricebuy > 0, 0 ,  nz(pospricebuy, 0))
barcolor(barcolornow)
if (posbuy == 0 and possell == 0)
    strategy.close_all()
if (posbuy == 1)
    strategy.entry("Long", strategy.long)
if (possell == -1)
    strategy.entry("Short", strategy.short)
pospricebuy := iff(high <= pospricebuy + input_takeprofit and pospricebuy > 0, 0 ,  nz(pospricebuy, 0))
pospricebuy := iff(low >= pospricebuy - input_stoploss and pospricebuy > 0, 0 ,  nz(pospricebuy, 0))
pospricesell := iff(low <= pospricesell - input_takeprofit and pospricesell > 0, 0 ,  nz(pospricesell, 0))
pospricesell := iff(high >= pospricesell + input_stoploss and pospricesell > 0, 0 ,  nz(pospricesell, 0))
Detail
https://www.fmz.com/strategy/440100
Last Modified
2024-01-26 16:04:26
