Name
唐氏趋势策略Donchian-Trend-Strategy
Author
ChaoZhang
Strategy Description
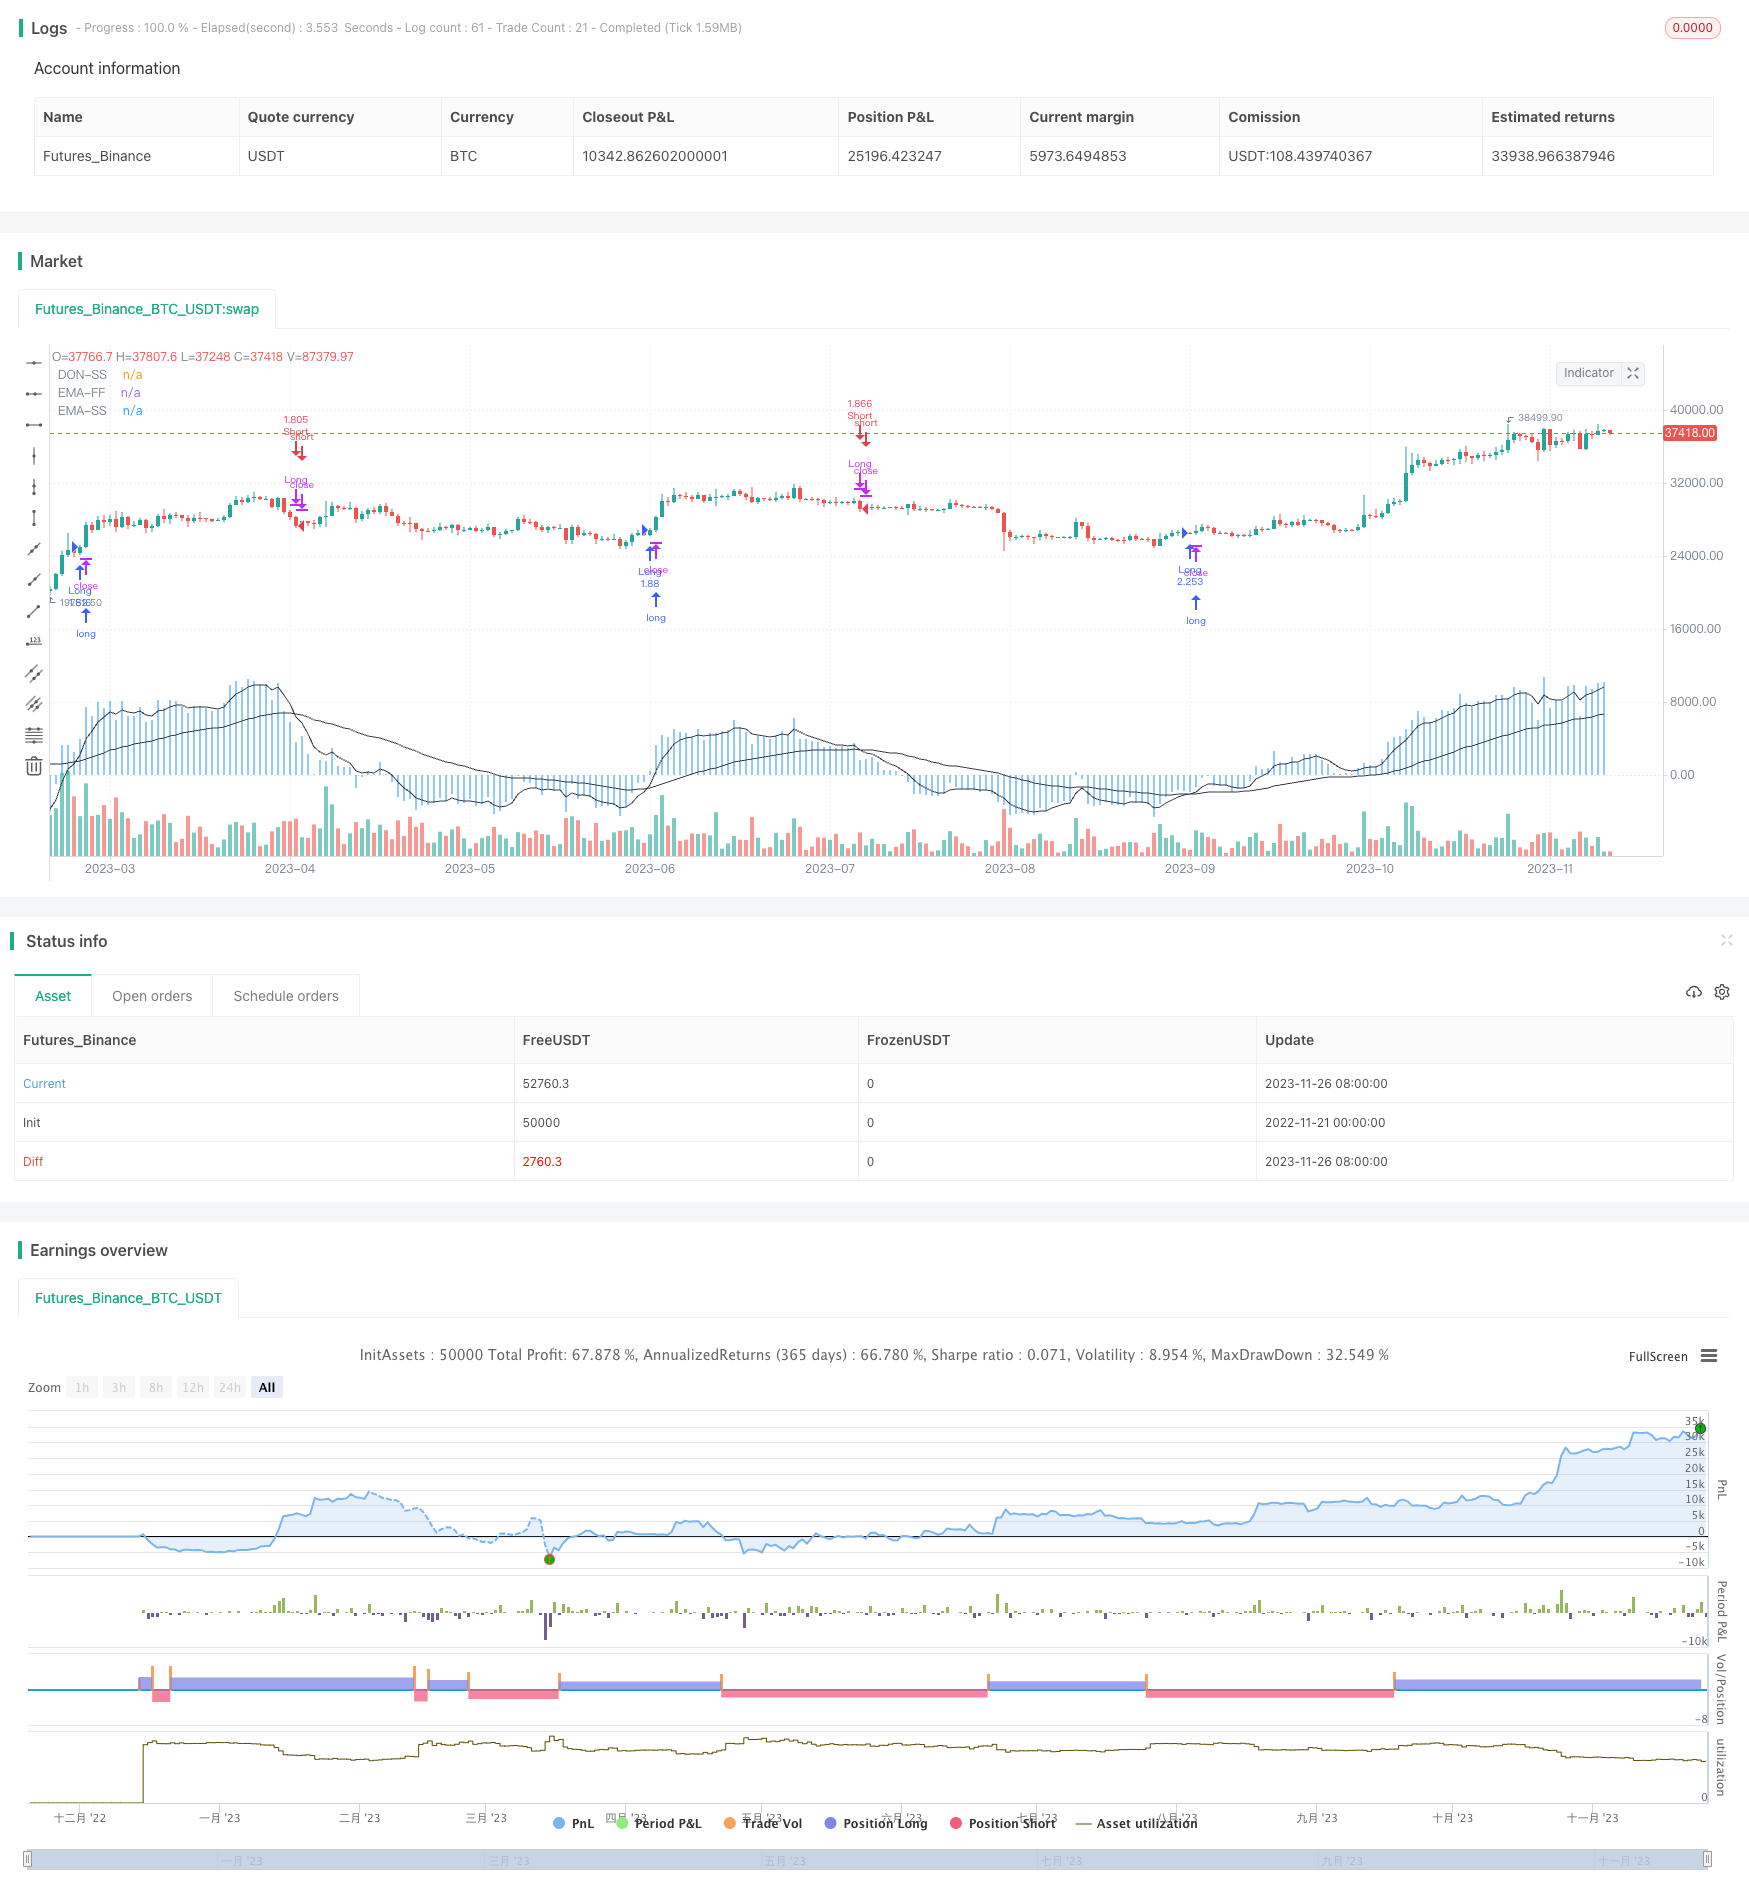
唐氏趋势策略是一种基于唐氏通道指标识别市场趋势的趋势跟随策略。该策略利用唐氏通道上下轨来判断价格走势,以发现潜在的入市和退出点。当价格高于上轨时,代表上涨趋势;当价格低于下轨时,代表下跌趋势。该策略的关键参数是唐氏通道的长度,它决定了计算高点和低点的回望周期。
为了更准确地生成交易信号,该策略额外使用两条移动平均线,一条快线(5日线)和一条慢线(45日线)。当快线上穿慢线时生成买入信号;当快线下穿慢线时生成卖出信号。
该策略的核心指标是唐氏通道。唐氏通道由给定周期内的最高价和最低价绘制,上轨线和下轨线分别连接这些高点和低点。通道宽度反映了市场的波动性。
策略利用唐氏通道判断价格趋势方向。具体来说,价格高于上轨表示行情处于上涨趋势,该策略将在下一次价格接近上轨时考虑建立多头头寸。相反,价格低于下轨表示行情处于下跌趋势,策略将在下一次价格接近下轨时考虑建立空头头寸。
为过滤假突破,该策略结合快速移动平均线(5日线)和慢速移动平均线(45日线)产生交易信号。当快线从下方上穿慢线时,产生买入信号;当快线从上方下穿慢线时,产生卖出信号。
入场后的止损退出根据价格再次接近唐氏通道设置。
该策略显著的优势在于它只在趋势明确形成后才入场,从而有效减少了因错买入假突破造成的损失。 唐氏通道本身就具有很强的趋势识别能力,再结合双移动平均线进行过滤,可靠性较高。
另外,唐氏通道参数的调整也为该策略提供了灵活性。通道长度越长,代表参考的历史数据时间越长,对趋势判断越保守,避免假突破的概率越高,但可能错过部分短线机会。我们可以根据市场环境和个人偏好选择通道参数。
该策略最大回撤控制得也较好。由于其趋势跟随属性,在市场大幅波动时也能有效控制亏损。
该策略的主要风险在于趋势判断失误,从而在错位的时间建立多头或空头头寸。这可能发生在价格隐藏了一个更大的止跌反弹或下跌行情的情况下。我们可以通过适当调整移动平均线参数来减少这样的情况。
另一个潜在风险是在震荡行情中过于频繁地进行买卖。这将增加交易次数和手续费的支出。我们可以通过增加止损幅度或适当延长持仓时间来解决。
该策略具有很大的优化空间,主要集中在以下几个方面:
-
唐氏通道长度。我们可以测试不同的参数值,找到最优参数。
-
移动平均线期数。我们可以尝试更多组合,找到一组匹配的快慢均线。
-
止损方式。我们可以尝试绝对点数止损或ATR止损。
-
入场过滤条件。我们可以在基本交易信号之外添加RSI,MACD等指标进行过滤。
综上所述,唐氏趋势策略利用唐氏通道判断趋势方向,再辅以双移动平均线进行入场,是一个稳定的趋势跟随策略。它只在趋势明确形成后进场,有效控制了损失。同时参数优化空间较大,可根据市场环境进行调整。如果风险得到有效控制,该策略有望获得稳定的长线收益。
||
The Donchian Trend strategy is a trend-following approach that uses the Donchian Channels indicator to identify potential entry and exit points in the market. The key parameter of this strategy is the length of the Donchian Channels, which determines the lookback period for calculating the high and low prices.
To further refine the trading signals, the strategy incorporates two moving averages – a fast MA (5-period) and a slow MA (45-period). Buy signals are generated when the fast MA crosses above the slow MA, and sell signals are generated when the fast MA crosses below the slow MA.
The core indicator of this strategy is the Donchian Channels. The Donchian Channels are plotted by taking the highest high and lowest low over a specified period, with the upper and lower channel lines connecting those highs and lows respectively. The width of the channels represents the volatility of the market.
The strategy utilizes the Donchian Channels to determine the trend direction. Specifically, prices above the upper channel indicate an uptrend, and the strategy will consider establishing long positions next time when prices approach the upper channel. Conversely, prices below the lower channel represent a downtrend, and the strategy will consider building short positions when prices approach the lower channel next time.
To filter false breakouts, the strategy combines fast moving average (5-period) and slow moving average (45-period) to generate trading signals. Buy signals are generated when the fast MA crosses above the slow MA. Sell signals are generated when the fast MA crosses below the slow MA.
Stop loss exits are set based on prices approaching the Donchian Channels again after entry.
A significant advantage of this strategy is that it only enters the market after a trend is firmly established, thus effectively reducing losses caused by wrongly buying into false breakouts. The Donchian Channels themselves already have very strong trend identification capabilities, and when combined with the dual moving averages for filtration, the reliability is higher.
In addition, the adjustability of the Donchian Channel parameters also provides flexibility to this strategy. The longer the channel length, the longer the reference historical data time, the more conservative the trend judgment, and the higher the probability of avoiding false breakouts, but some short-term opportunities may be missed. We can choose the channel parameters based on market conditions and personal preferences.
The maximum drawdown of this strategy is also well controlled. Thanks to its trend following properties, it can also effectively control losses during major market fluctuations.
The main risk of this strategy is the misjudgment of trend, thus establishing long or short positions at the wrong time. This may occur when prices have concealed a larger reversal or decline. We can reduce such situations by appropriately adjusting the moving average parameters.
Another potential risk is over-trading in range-bound markets. This will increase the number of trades and commission expenses. We can address this by increasing the stop loss margin or appropriately extending the holding period.
This strategy has great optimization space, mainly focused on the following aspects:
-
Donchian Channel length. We can test different parameter values to find the optimal parameters.
-
Moving average periods. We can try more combinations to find a matching set of fast and slow moving averages.
-
Stop loss method. We can try absolute point or ATR stops.
-
Entry filters. We can add indicators like RSI, MACD etc. for filtration in addition to the basic trading signals.
In summary, the Donchian Trend strategy utilizes the Donchian Channels to determine the trend direction, supplemented by dual moving averages for entry, making it a steady trend following strategy. It only enters the market after the trend is clearly formed, effectively controlling losses. At the same time, the strategy has large optimization space on parameters, which can be adjusted based on market conditions. If risks are effectively controlled, this strategy has the potential to achieve steady long-term returns.
[/trans]
Strategy Arguments
| Argument | Default | Description |
|---|---|---|
| v_input_int_1 | 42 | length |
| v_input_int_2 | 45 | emalength |
| v_input_int_3 | 5 | emalength1 |
Source (PineScript)
/*backtest
start: 2022-11-21 00:00:00
end: 2023-11-27 00:00:00
period: 1d
basePeriod: 1h
exchanges: [{"eid":"Futures_Binance","currency":"BTC_USDT"}]
*/

//@version=5
strategy(title="DON-SS-TREND", overlay=true,default_qty_type = strategy.percent_of_equity,default_qty_value=100,initial_capital=1000,pyramiding=0,commission_value=0.01)//@version=5
length = input.int(42, minval=1)

lower = ta.lowest(length)
upper = ta.highest(length)
basis = math.avg(upper, lower)

updiff = upper - close
downdiff = lower - close

dontrend = updiff + downdiff
emalength = input.int(45, minval=1)
emax = ta.ema(-dontrend,emalength)
plot(-dontrend, "DON-SS", color=color.blue,style = plot.style_histogram)
plot(emax, "EMA-SS", color=color.black)
emalength1 = input.int(5, minval=1)
emax1 = ta.ema(-dontrend,emalength1)
plot(emax1, "EMA-FF", color=color.black)

/////////////////////// STRATEGY
// Check for Long Entry
longCondition = ta.crossover(emax1,emax)
if longCondition
    strategy.entry('Long', strategy.long, comment = "BUY")

buyclose = ta.crossunder(emax1,emax)
// Exit condition with trailing stop and take profit
strategy.close('Long', when=buyclose, comment = "BUY STOP")

// Check for Short Entry
ShortCondition = ta.crossunder(emax1,emax)
if ShortCondition
    strategy.entry('Short', strategy.short, comment = "SELL")

sellclose = ta.crossover(emax1,emax)
// Exit condition with trailing stop and take profit
strategy.close('Short', when=sellclose, comment = "SELL STOP")
Detail
https://www.fmz.com/strategy/433561
Last Modified
2023-11-28 15:13:00
