Name
均线回归交易策略Linear-Regression-Moving-Average-Trading-Strategy
Author
ChaoZhang
Strategy Description
[trans]
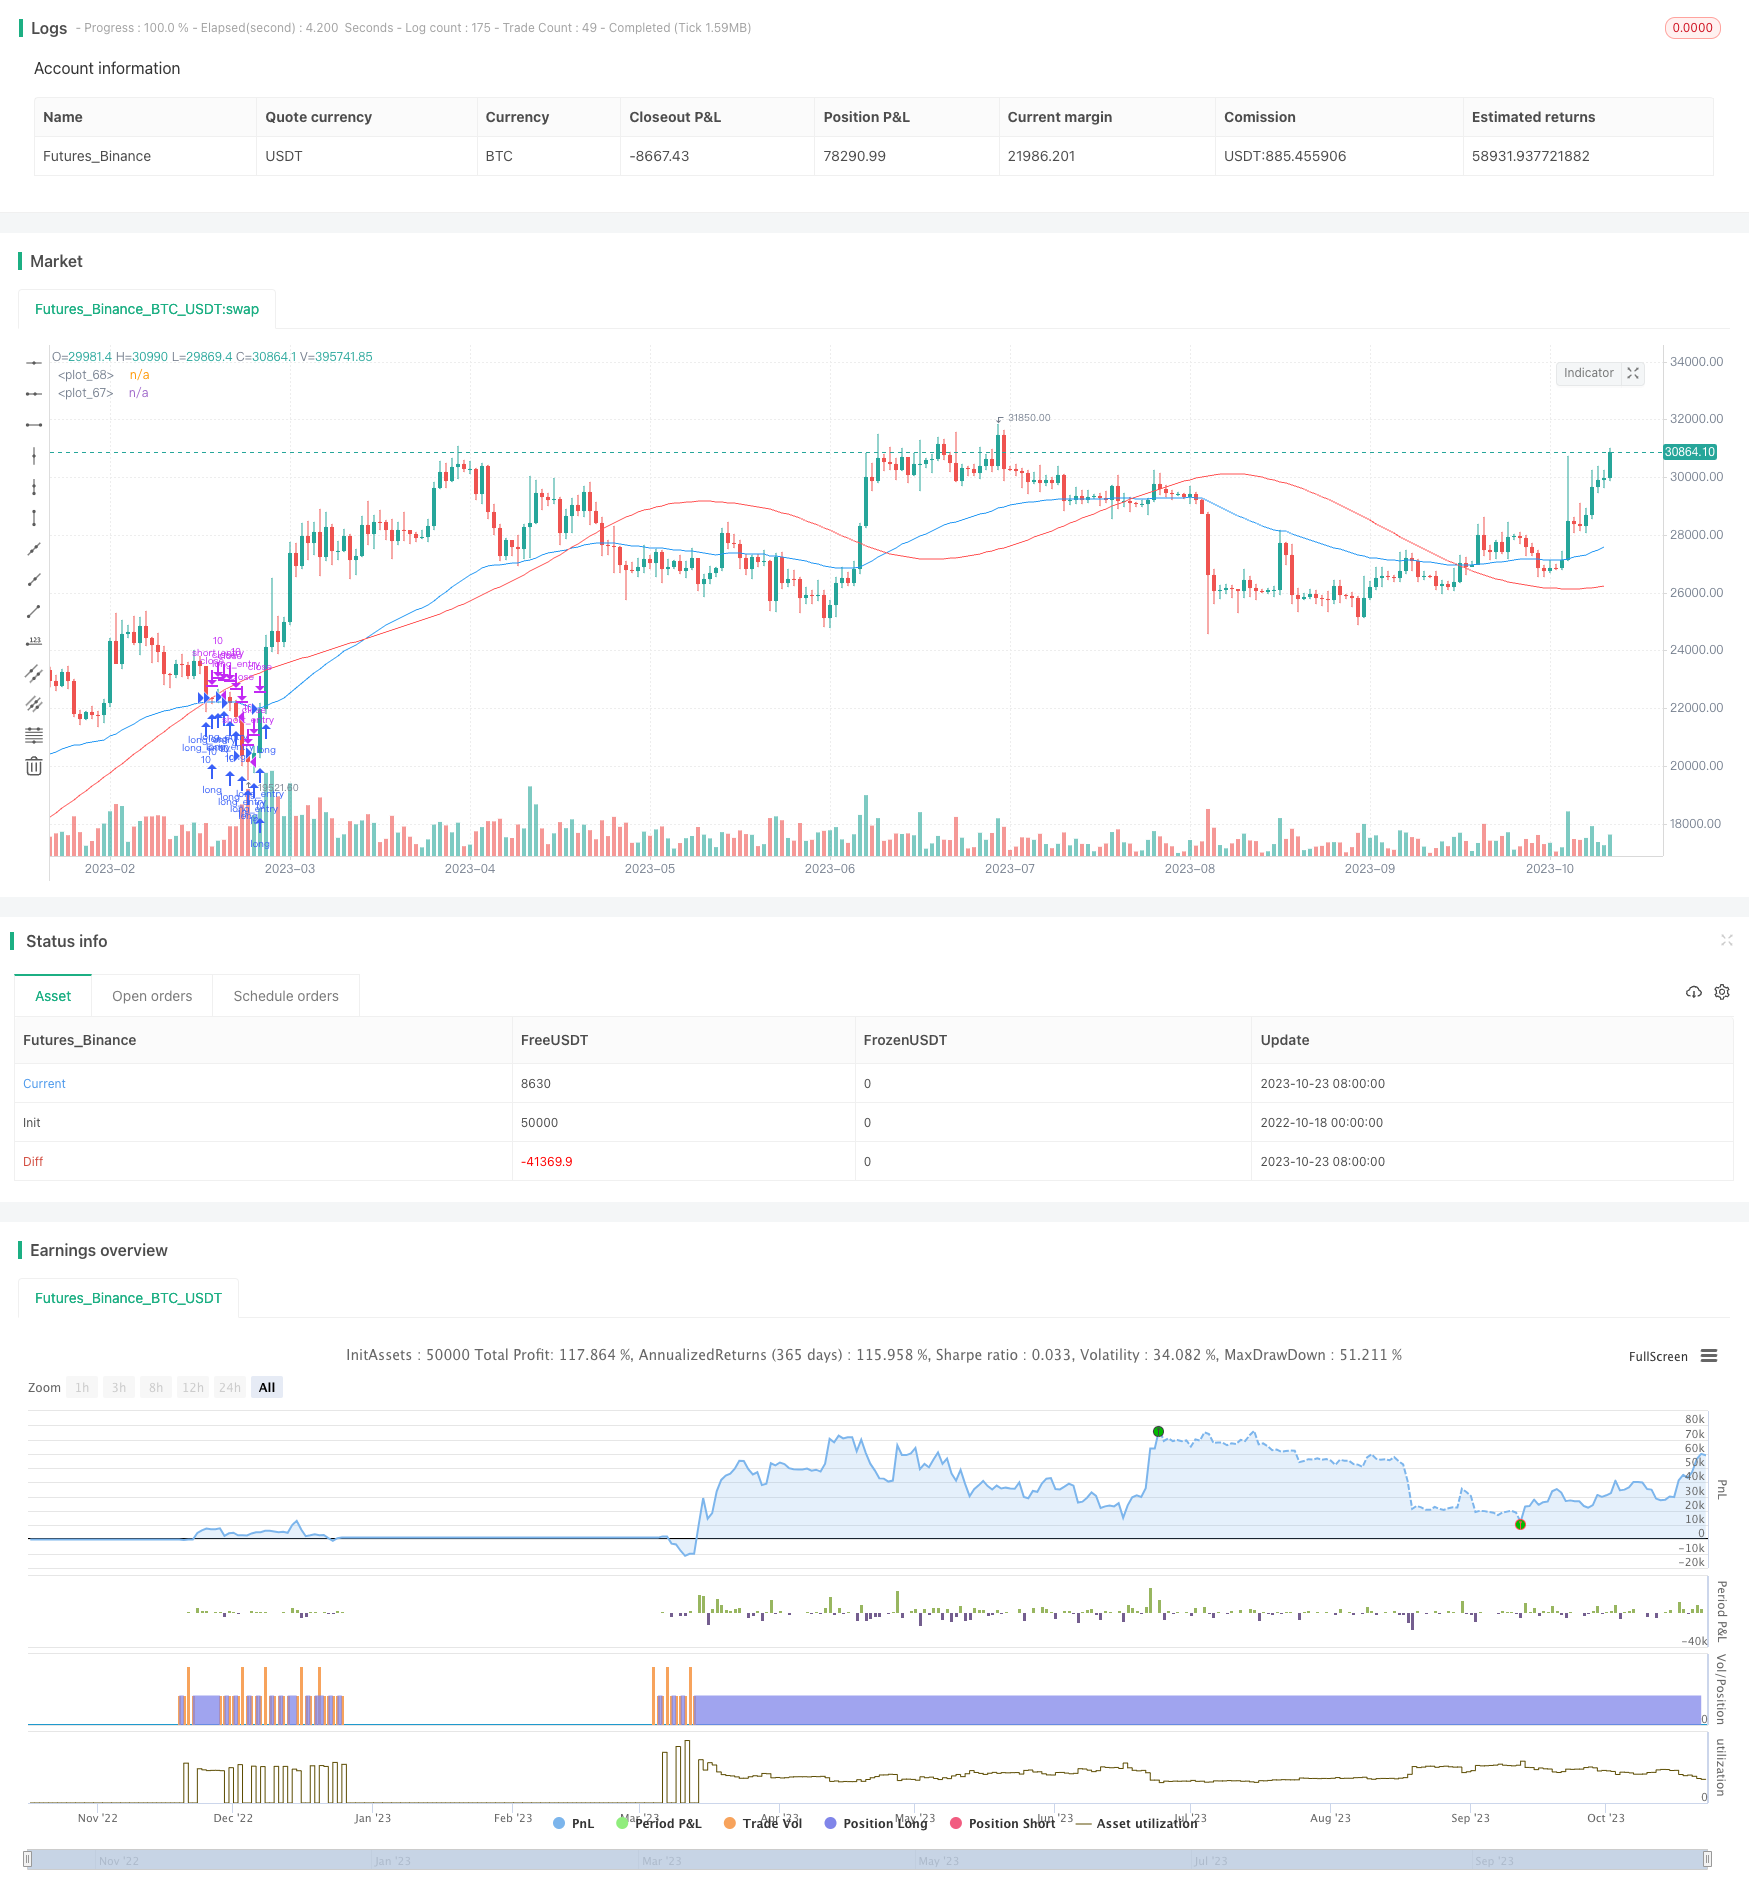
均线回归交易策略通过计算股价的线性回归线和均线的交叉来决定买入和卖出信号。该策略结合了均线和线性回归分析,既考虑了股价趋势,也考虑了统计学特征,可以有效判断股价反转点,实现低买高卖。
该策略首先计算n日股价的线性回归线和m日均线。线性回归线反映了股价的长期统计趋势,均线反映了股价的短期动向。
当均线上穿线性回归线时,表示股价上涨势头增强,产生买入信号。当均线下穿线性回归线时,表示股价上涨乏力,产生卖出信号。
具体来说,策略通过以下几步判断交易信号:
-
计算n日股价线性回归线lrLine
-
计算线性回归线的m日简单移动平均线lrMA
-
计算股价的m日指数移动平均线ema
-
当ema上穿lrMA时,产生买入信号longEntry
-
当ema下穿lrMA时,产生卖出信号longExit
-
同时结合大盘判断,只有大盘为牛市时才考虑买入信号
-
根据信号执行买入卖出交易
通过均线和回归线的交叉判定买卖时机,可以有效过滤假破和捕捉反转点,实现低买高卖。
- 回归线反映长期趋势,均线反映短期动向,结合双重指标可以准确判断买卖点
- 回归线计算简单,容易实现
- 利用了大盘判断,可以过滤不适宜的交易信号
- 可自定义参数调整买卖策略
- 实现了低买高卖,收益Space较大
- 股价剧烈波动时,均线和回归线交叉频繁,可能产生错误信号
- 大盘判断不准确时,也会误判买卖时机
- 参数设置不当也会影响策略效果
- 交易频繁,交易成本较高
需要注意的参数调整,适当增大均线和回归线周期参数,降低交易频率。合理设置止损策略控制风险。优化大盘判断规则,提高准确率。
该策略可以从以下几个方面进行优化:
-
均线指标优化:尝试不同类型的均线,如加权移动平均线等,找到适合该股票的最佳均线。
-
回归线优化:调整回归线计算周期,寻找最能反映该股票长期趋势的周期参数。
-
大盘判断优化:测试不同的大盘判断指标,找到最适合策略的大盘信号。
-
参数优化:通过不同的参数组合反复回测,寻找最佳参数配置。
-
止损策略优化:测试不同的止损方式,设置最佳的止损逻辑以控制风险。
-
交易成本优化:根据不同的交易手续费模式,调整交易频率以减少交易成本。
通过以上几点优化,可以进一步提升策略的稳定性和收益率。
该均线回归交易策略集成均线分析和线性回归分析的优点,可以有效识别股价反转点,指导低买高卖。策略较为简单可靠,适合用于中长线选股交易。通过参数优化和风险控制可以进一步提高策略稳定性。该策略为股市分析提供了一个可行的技术交易方案。
||
The Linear Regression Moving Average trading strategy generates buy and sell signals based on the crossovers between a linear regression line and moving average of the stock price. This strategy combines trend following with linear regression analysis to identify potential reversals and achieve buying low and selling high.
The strategy first calculates a n-day linear regression line and m-day moving average of the stock price. The regression line captures long term statistical trends while the moving average reflects short term momentum.
When the moving average crosses above the regression line, it signals strengthening upside momentum and generates a buy signal. When the moving average crosses below, it signals weakening upside and produces a sell signal.
Specifically, the strategy follows these steps to determine trade signals:
-
Calculate n-day linear regression line of prices lrLine
-
Calculate m-day simple moving average of lrLine called lrMA
-
Calculate m-day exponential moving average of prices called ema
-
When ema crosses above lrMA, generate buy signal longEntry
-
When ema crosses below lrMA, generate sell signal longExit
-
Only consider buy signals when market is bullish
-
Execute trades based on the signals
By using crossover between regression and moving averages to determine entries, the strategy can effectively filter out false breaks and identify reversals for buying low and selling high.
- Combines trend and regression analysis for accurate signal identification
- Regression line is simple to calculate and implement
- Uses market filtering to avoid unfavorable trades
- Customizable parameters for adjusting strategy
- Achieves buying low and selling high for profit
- Frequent crossovers during volatility may generate false signals
- Inaccurate market filters lead to mistimed entries
- Poor parameter tuning impacts strategy performance
- High trading frequency leads to higher costs
Parameters should be tuned to increase moving average and regression line periods and reduce trade frequency. Reasonable stop losses should be implemented to control risks. Market filters can be enhanced to improve accuracy.
The strategy can be optimized in several aspects:
-
Moving average optimization by testing different types of MAs
-
Regression line optimization by adjusting calculation period
-
Market filter optimization by testing different indicators
-
Parameter optimization through rigorous backtesting
-
Stop loss optimization by testing different stop loss logics
-
Cost optimization by adjusting trade frequency based on costs
These optimizations can further improve the stability and profitability of the strategy.
The Linear Regression MA strategy integrates strengths of trend analysis and linear regression for effective reversal identification and buying low selling high. The straightforward strategy is suitable for stock picking over medium to long term horizons. With parameter tuning and risk control, the strategy can achieve even higher stability. It provides a viable technical trading framework for market analysis.
[/trans]
Strategy Arguments
| Argument | Default | Description |
|---|---|---|
| v_input_bool_1 | true | Execute Long Trades |
| v_input_bool_2 | true | Execute Short Trades |
| v_input_bool_3 | true | Execute Stop Loss |
| v_input_float_1 | 10 | Max Profit (%) |
| v_input_float_2 | 1.75 | Stop Loss (%) |
| v_input_1 | true | Show Date Range |
| v_input_int_1 | true | (?Date Info)Start Month |
| v_input_int_2 | true | Start Day |
| v_input_int_3 | 2022 | Start Year |
| v_input_int_4 | 55 | (?Averages)Linear Regression Line |
| v_input_int_5 | 55 | Linear Regression MA |
| v_input_int_6 | 55 | EMA Length |
Source (PineScript)
/*backtest
start: 2022-10-18 00:00:00
end: 2023-10-24 00:00:00
period: 1d
basePeriod: 1h
exchanges: [{"eid":"Futures_Binance","currency":"BTC_USDT"}]
*/

// This source code is subject to the terms of the Mozilla Public License 2.0 at https://mozilla.org/MPL/2.0/
// © lazy_capitalist

//@version=5
strategy('Linear Regression MA', overlay=true, initial_capital=10000)
datesGroup = "Date Info"
startMonth = input.int(defval = 1,    title = "Start Month",  minval = 1, maxval = 12,  group=datesGroup)
startDay   = input.int(defval = 1,    title = "Start Day",    minval = 1, maxval = 31,  group=datesGroup)
startYear  = input.int(defval = 2022, title = "Start Year",   minval = 1970,            group=datesGroup)

averagesGroup = "Averages"
lrLineInput     = input.int(title="Linear Regression Line",   defval=55, minval = 1, group=averagesGroup)
lrMAInput       = input.int(title="Linear Regression MA",     defval=55, minval = 1, group=averagesGroup)
emaInput        = input.int(title="EMA Length",               defval=55, minval = 1, group=averagesGroup)


tradesGroup = "Execute Trades"
executeLongInput    = input.bool(title="Execute Long Trades",       defval=true)
executeShortInput   = input.bool(title="Execute Short Trades",      defval=true)
executeStopLoss     = input.bool(title="Execute Stop Loss",         defval=true)

fourHrSMAExpr       = ta.sma(close, 200)
fourHrMA            = request.security(symbol=syminfo.tickerid, timeframe="240", expression=fourHrSMAExpr)

bullish             = close > fourHrMA ? true : false


maxProfitInput              = input.float(  title="Max Profit (%)",         defval=10.0,    minval=0.0)   * 0.01
stopLossPercentageInput     = input.float(  title="Stop Loss (%)",          defval=1.75,    minval=0.0)   * 0.01

start       = timestamp(startYear, startMonth, startDay, 00, 00)            // backtest start  window
window()    => time >= start ? true : false                              // create function "within window of time"
showDate    = input(defval = true, title = "Show Date Range")

lrLine = ta.linreg(close, lrLineInput, 0)
lrMA   = ta.sma(lrLine, lrMAInput)
ema     = ta.ema(close, emaInput)

longEntry   = ema   < lrMA
longExit    = lrMA  < ema

shortEntry  = lrMA  < ema
shortExit   = ema   < lrMA


maxProfitLong   = strategy.opentrades.entry_price(0) * (1 + maxProfitInput)
maxProfitShort  = strategy.opentrades.entry_price(0) * (1 - maxProfitInput)

stopLossPriceShort  = strategy.position_avg_price * (1 + stopLossPercentageInput)
stopLossPriceLong   = strategy.position_avg_price * (1 - stopLossPercentageInput)

if(executeLongInput and bullish)
    strategy.entry( id="long_entry", direction=strategy.long,   when=longEntry and window(),    qty=10,  comment="long_entry")
    strategy.close( id="long_entry", when=longExit,     comment="long_exit")
    // strategy.close( id="long_entry", when=maxProfitLong <= close, comment="long_exit_mp")

if(executeShortInput and not bullish)
    strategy.entry( id="short_entry", direction=strategy.short,   when=shortEntry and window(),    qty=10,  comment="short_entry")
    strategy.close( id="short_entry", when=shortExit,     comment="short_exit")
    // strategy.close( id="short_entry", when=maxProfitShort <= close, comment="short_exit_mp")

if(strategy.position_size > 0 and executeStopLoss)
    strategy.exit(  id="long_entry",        stop=stopLossPriceLong,             comment="exit_long_SL")
    strategy.exit(  id="short_entry",       stop=stopLossPriceShort,            comment="exit_short_SL")

// plot(series=lrLine,     color=color.green)
plot(series=lrMA,       color=color.red)
plot(series=ema,        color=color.blue)
Detail
https://www.fmz.com/strategy/430113
Last Modified
2023-10-25 10:58:02
