Name
均线多空力量突破策略Volatility-Force-Breakthrough-Trading-Strategy
Author
ChaoZhang
Strategy Description
[trans]
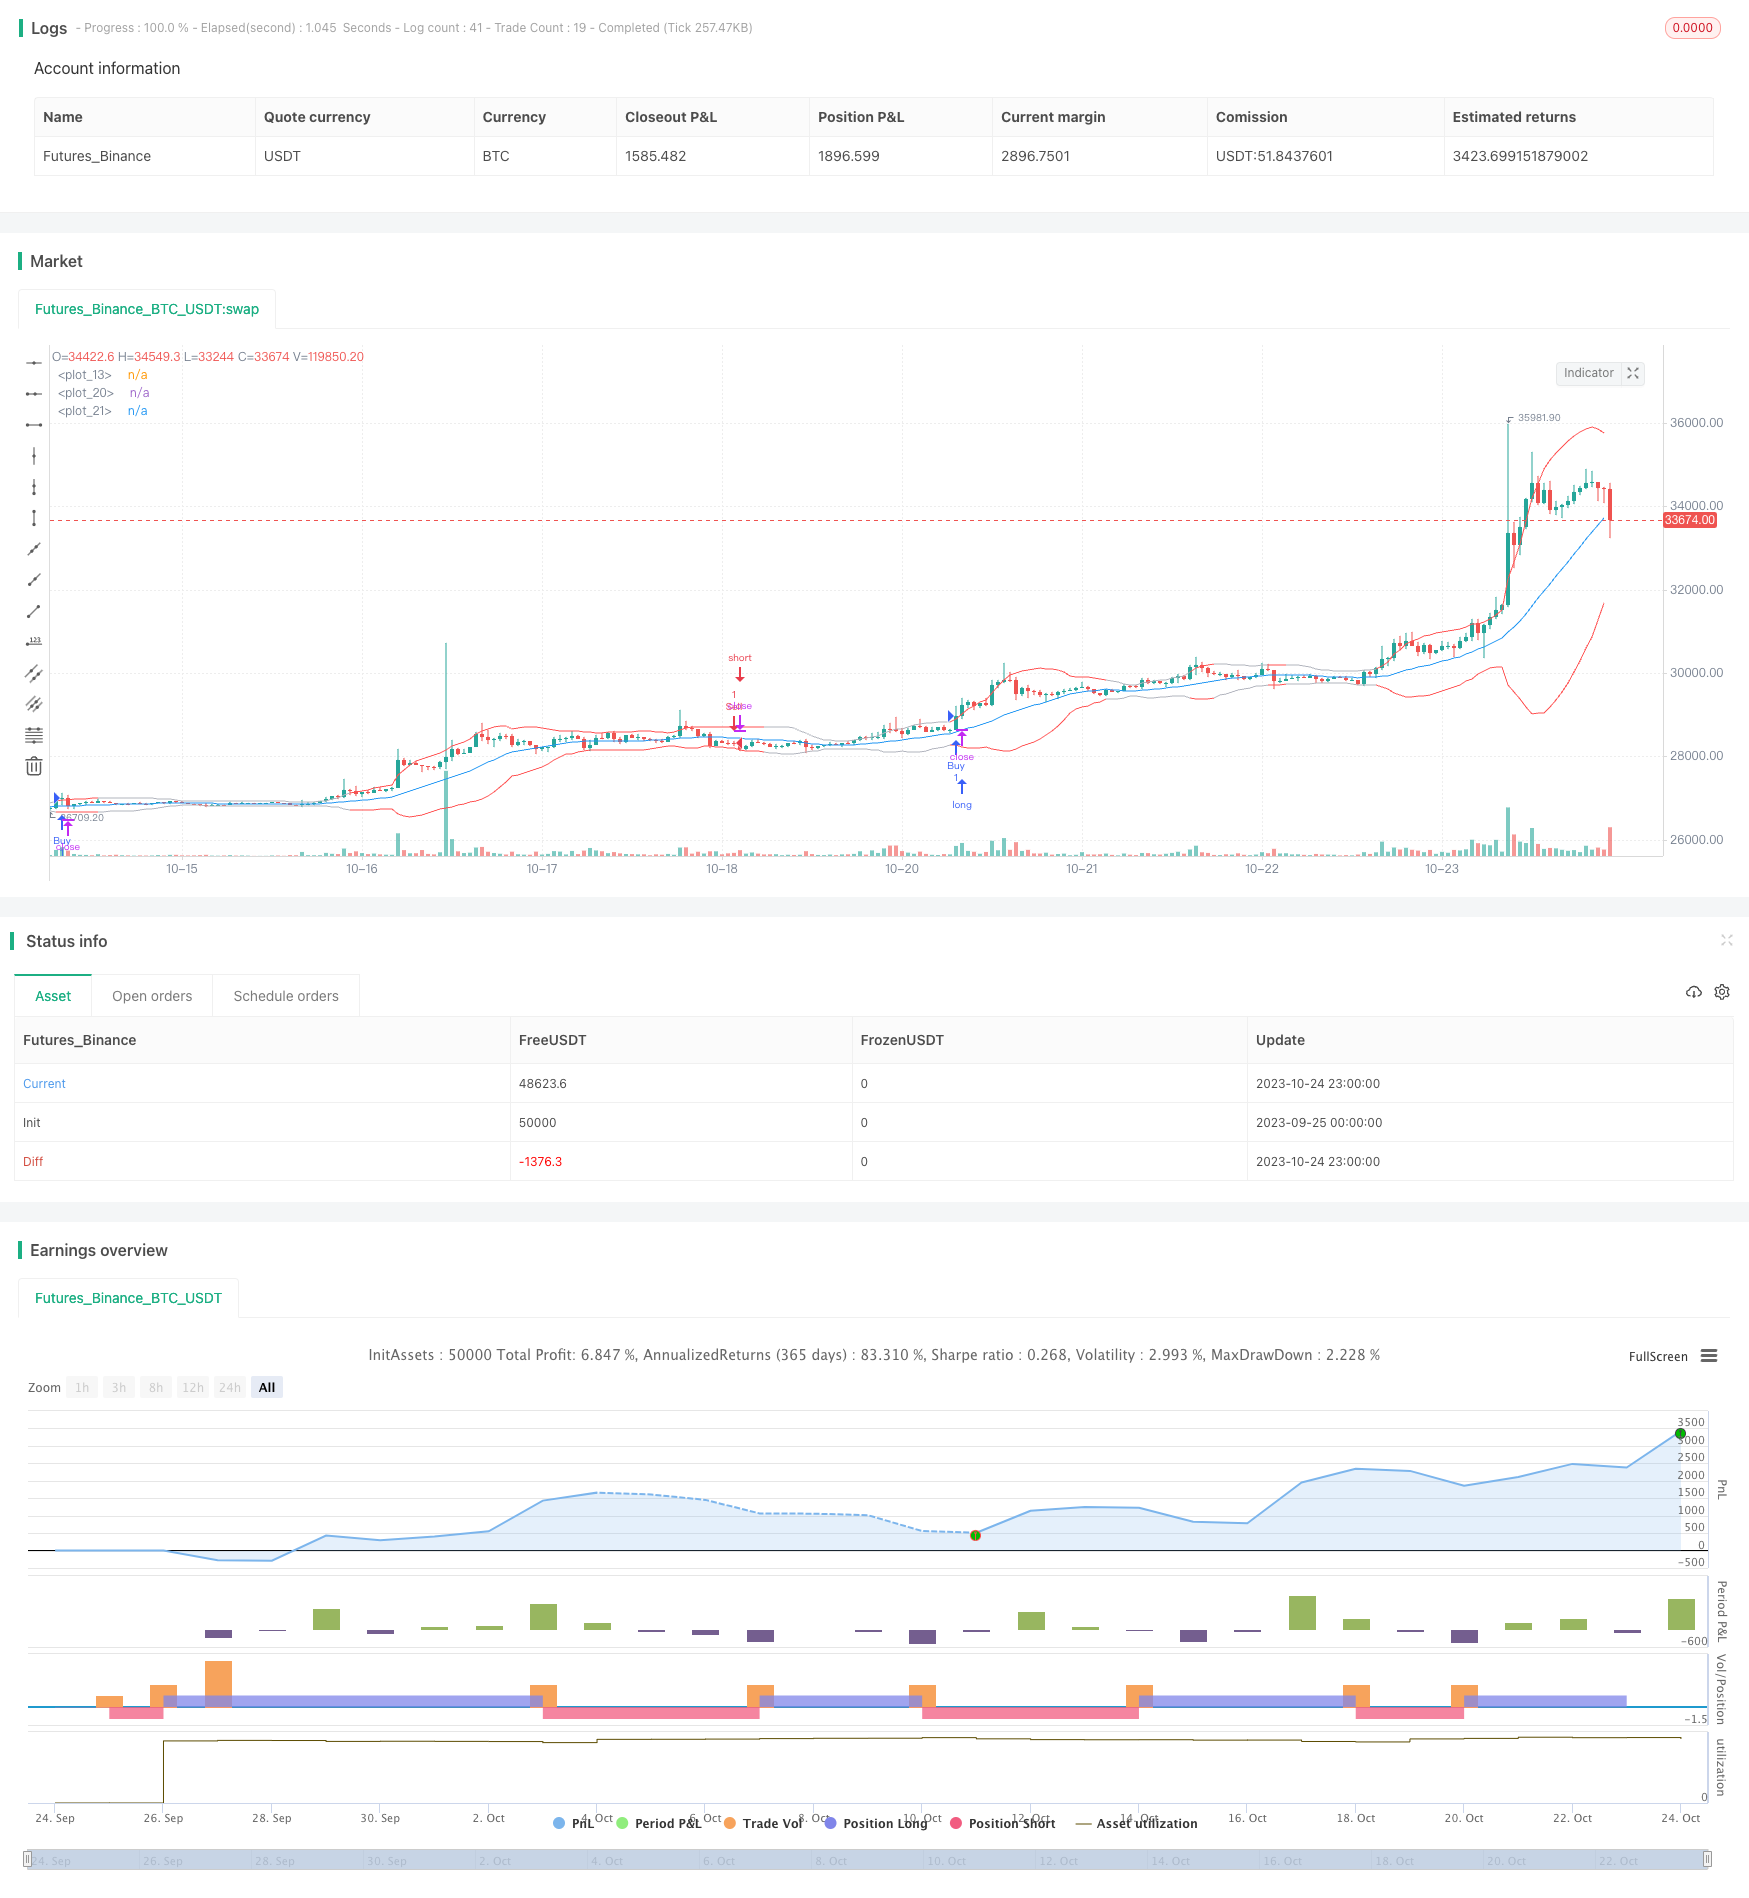
本策略基于均线、ATR指标、布林带进行多空判断,同时结合力量指标实现突破交易,属于突破类策略。
-
计算布林带中的中线、上线、下线。中线为close的sma均线,上下线为中线正负stdDev标准差。
-
计算快速ATR和慢速ATR。快速ATR参数为20,慢速ATR参数为50。
-
计算力量指标XFORCE,为volume*(close-前一close)的累积。计算XFORCE的快EMA和慢EMA。
-
判断多头信号:快速XFORCE上穿慢速XFORCE,且快速ATR>慢速ATR,且收盘价>开盘价。
-
判断空头信号:快速XFORCE下穿慢速XFORCE,且快速ATR>慢速ATR,且收盘价<开盘价。
-
当触发多头信号时做多,触发空头信号时做空。
-
均线提供趋势判断,布林带提供突破买卖点。
-
ATR指标判断市场波动率,实现波动率交易。
-
力量指标判断力量方向,实现力量突破。
-
多指标组合,提供更全面判断。
-
规则清晰简单,容易理解实现。
-
回测表现良好,收益稳定。
-
布林带上下线过宽过窄都会产生错误信号。
-
ATR参数设置不当,无法抓取市场波动。
-
力量指标作用有限,无法判断真实趋势反转。
-
多指标组合,参数调整及权重分配难度大。
-
突破信号时点易误判,存在背离现象。
-
回撤可能较大,可通过止损来控制。
-
优化布林带参数,适应不同周期及股票特性。
-
优化ATR参数,更好捕捉市场波动率。
-
增加如MACD等趋势指标,提供趋势校验。
-
增加止损策略,如跟踪止损控制回撤。
-
增加机器学习算法,利用AI判断反转信号。
-
多周期结合,不同周期综合判断,降低误判率。
本策略整合均线、ATR、布林带和力量指标,形成一套较为完整的突破交易体系。通过参数优化,引入趋势判断指标进行确认,增加止损策略,以及加入AI判断,可以进一步增强策略稳定性和收益水平。但任何策略都不能完美,需要根据回测结果不断优化调整,才能适应市场的变化。
||
This strategy uses moving average, ATR, Bollinger Bands for trend judgment and breakout trading, combined with force index for timing, belongs to breakout trading strategy.
-
Calculate middle, upper and lower lines of Bollinger Bands. Middle line is sma of close price, upper and lower are middle line ± stdDev.
-
Calculate fast and slow ATR. Fast ATR has period of 20, slow ATR has period of 50.
-
Calculate force index XFORCE, which is cumulative of volume * (close - previous close). And calculate fast and slow EMA of XFORCE.
-
Judge long signal: fast XFORCE cross above slow XFORCE, and fast ATR > slow ATR, and close > open.
-
Judge short signal: fast XFORCE cross below slow XFORCE, and fast ATR > slow ATR, and close < open.
-
Go long when long signal triggered, go short when short signal triggered.
-
Moving average provides trend, Bollinger Bands provides breakout points.
-
ATR judges volatility, implements volatility trading.
-
Force index determines force direction, implements force breakout.
-
Combination of multiple indicators provides comprehensive judgment.
-
Clear and simple rules, easy to understand and implement.
-
Good backtest results, stable profit.
-
Bollinger Bands may generate wrong signals if width is improper.
-
Wrong ATR parameters cannot catch market volatility.
-
Force index has limited effect, cannot determine real trend reversal.
-
Difficult to adjust parameters and weights for multiple indicators.
-
Breakout signals may be inaccurate, divergence may happen.
-
Drawdown may be large, can use stop loss to control it.
-
Optimize Bollinger Bands parameters for different periods and instruments.
-
Optimize ATR parameters to better capture volatility.
-
Add trend indicators like MACD for trend validation.
-
Add stop loss strategies like trailing stop to control drawdown.
-
Utilize AI algorithms to judge reversal signals.
-
Combine multiple timeframes for comprehensive judgment and lower false signals.
This strategy integrates moving average, ATR, Bollinger Bands and Force Index to form a complete breakout trading system. Further improvements on parameters optimization, adding trend filter, stop loss strategy and AI algorithms can enhance stability and profitability. But no strategy is perfect, continuous optimizations against backtest results are needed to adapt to changing market conditions.
[/trans]
Strategy Arguments
| Argument | Default | Description |
|---|---|---|
| v_input_1 | 3 | Fast |
| v_input_2 | 20 | Slow |
| v_input_3 | 20 | ATR Fast |
| v_input_4 | 50 | ATR Slow |
| v_input_5 | 20 | Length |
| v_input_6 | 2 | multiplier |
| v_input_7_close | 0 | Source: close |
Source (PineScript)
/*backtest
start: 2023-09-25 00:00:00
end: 2023-10-25 00:00:00
period: 1h
basePeriod: 15m
exchanges: [{"eid":"Futures_Binance","currency":"BTC_USDT"}]
*/

//@version=2
strategy("yuthavithi volatility based force trade scalper strategy", overlay=true)

fast = input(3, minval= 1, title="Fast")
slow = input(20, minval = 1, title = "Slow")
atrFast = input(20, minval = 1, title = "ATR Fast")
atrSlow = input(50, minval = 1, title = "ATR Slow")

len = input(20, minval=1, title="Length")
multiplier = input(2, minval=1, title="multiplier")
src = input(close, title="Source")
bbMid = sma(src, len)
plot(bbMid, color=blue)

atrFastVal = atr(atrFast)
atrSlowVal = atr(atrSlow)
stdOut = stdev(close, len)
bbUpper = bbMid + stdOut * multiplier
bbLower = bbMid - stdOut * multiplier
plot(bbUpper, color = (atrFastVal > atrSlowVal ? red : silver))
plot(bbLower, color = (atrFastVal > atrSlowVal ? red : silver))


force = volume * (close -  nz(close[1]))
xforce = cum(force)
xforceFast = ema(xforce, fast)
xforceSlow = ema(xforce, slow)

bearish = ((xforceFast < xforceSlow) and (atrFastVal > atrSlowVal)) and ((xforceFast[1] > xforceSlow[1]) or (atrFastVal[1] < atrSlowVal[1])) and (close < open)
bullish = ((xforceFast > xforceSlow) and (atrFastVal > atrSlowVal)) and ((xforceFast[1] < xforceSlow[1]) or (atrFastVal[1] < atrSlowVal[1])) and (close > open)


if (bullish)
    strategy.entry("Buy", strategy.long)

if (bearish)
    strategy.entry("Sell", strategy.short)
Detail
https://www.fmz.com/strategy/430261
Last Modified
2023-10-26 16:17:17
