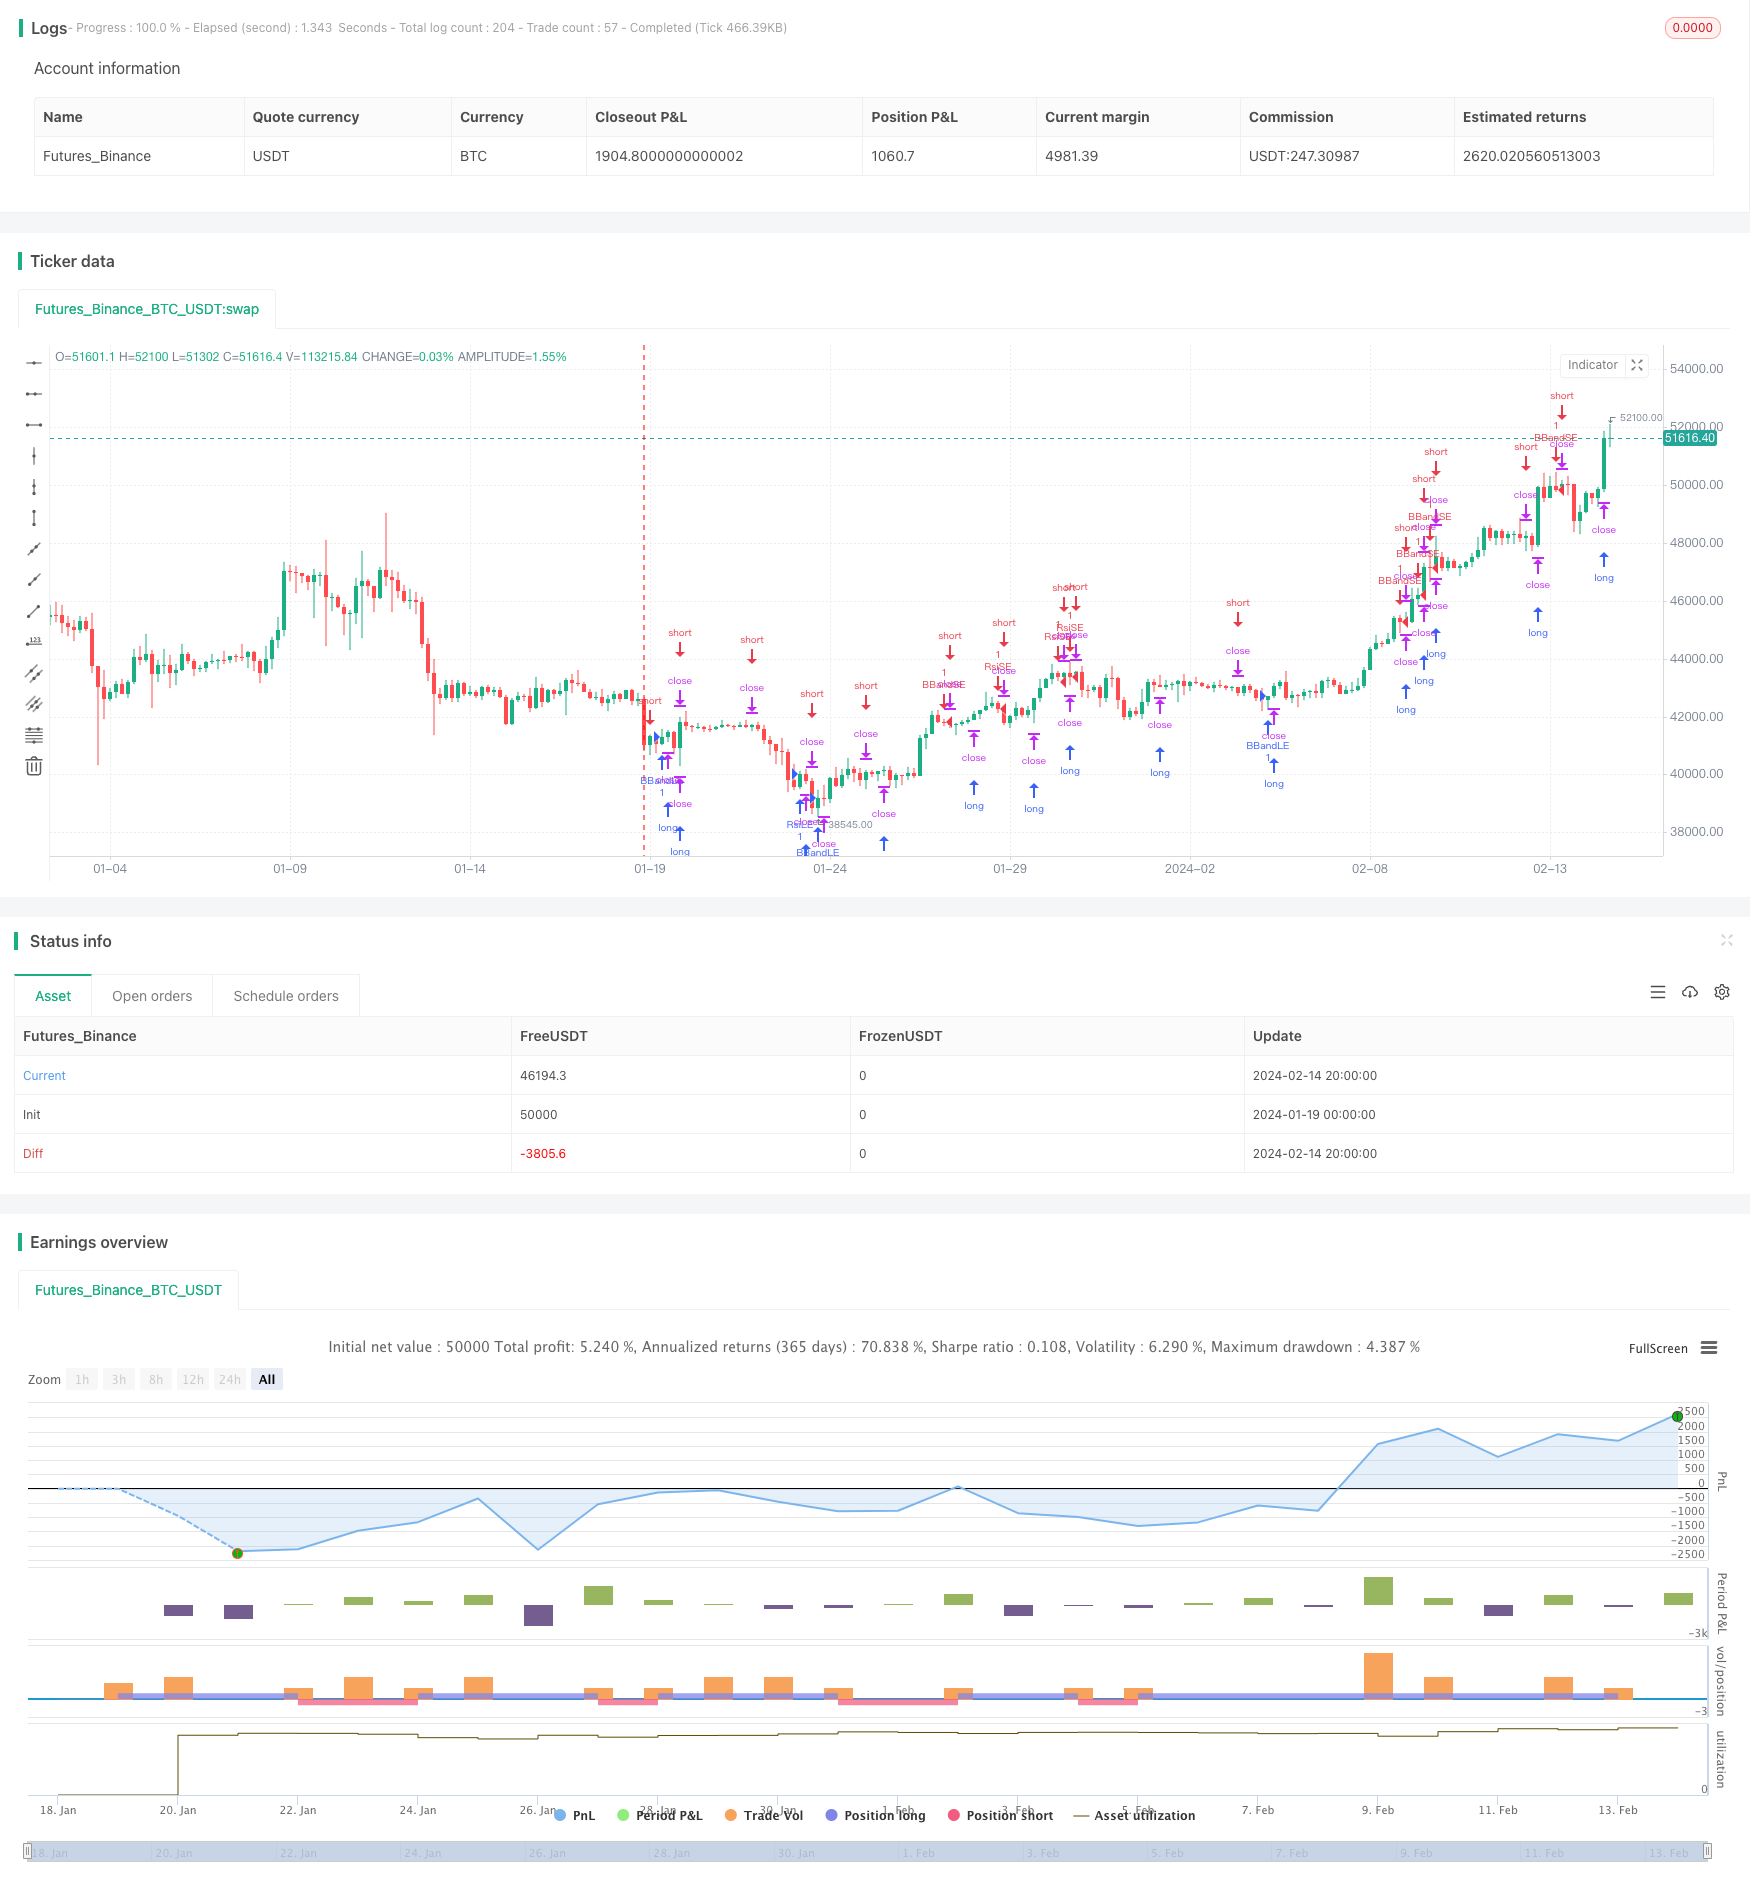
Name
均线穿越与布林带突破策略Moving-Average-Breakout-and-Bollinger-Band-Breakout-Strategy
Author
ChaoZhang
Strategy Description
本策略综合利用了RSI指标识别超买超卖信号,布林带判断价格突破进行操作,以及均线的金叉死叉形态,从而在趋势的不同阶段对市场进行判断,实现盈利。
该策略主要由以下几部分指标组成:
-
RSI指标:当RSI指标线上穿过设定的超买线或者下穿超卖线时,进行相应的做多或者做空操作。
-
布林带:当价格突破布林带上轨时,进行做空操作;当价格跌破布林带下轨时,进行做多操作。
-
均线:计算一定周期(如5周期)内的最高价和最低价,当价格高于最近5周期的最高点时,做多;当价格低于最近5周期的最低点时,做空。
-
MACD:计算快线,慢线和MACD线的金叉死叉,作为辅助判断指标。
这几个指标相互结合,在趋势行情中,利用布林带判断价格突破和回归中轴的时间点;在盘整行情中,利用均线判断突破来抓取趋势转换点;在超买超卖行情中,利用RSI指标的极值区域判断来实现逆向操作。
该策略具有以下几个优势:
-
多指标组合,判断精确。RSI,布林带,均线等指标相互验证,使得交易信号更加可靠。
-
适合不同行情。趋势行情利用布林带,盘整行情利用均线,超买超卖行情利用RSI,多种行情都能应对。
-
操作频率适中。指标参数设置较为谨慎,避免过于频繁交易。
-
程序结构清晰。代码编写规范,容易读懂和二次开发。
该策略也存在一些风险:
-
参数设置风险。指标参数设置不当可能导致交易信号错误。需要反复测试优化参数。
-
多头空头切换风险。在行情转折点多头空头切换可能比较频繁,交易成本会加大。可以适当调整持仓时间。
-
编程实现风险。代码中可能存在一些难以发现的逻辑错误,导致异常交易。需要完善异常处理和日志记录。
该策略还可以从以下几个方向进行优化:
-
增加止损策略,以锁定利润,减少亏损。
-
结合交易量指标,避免虚假信号。例如突破布林带时检查交易量。
-
增加机器学习算法,利用历史数据训练,自动优化参数。
-
增加图形化展示,能直观显示策略表现。
-
进行回测优化,选择最佳参数组合。
本策略综合运用了均线、布林带、RSI等多个指标,通过指标组合判断,形成交易信号。策略优势是适应性强,判断精确;风险主要在参数设定和程序实现,需要不断优化测试。接下来将持续完善该策略,增加止损机制,利用机器学习训练最佳参数,并开发图形化界面,完善监控和异常处理功能。
||
This strategy combines the use of RSI indicator to identify overbought and oversold signals, Bollinger Bands to determine price breakouts, and moving average crossovers to judge the market in different trend stages, in order to profit.
The strategy consists of the following main indicators:
-
RSI indicator: When the RSI line crosses over the overbought threshold or crosses below the oversold threshold, long or short trades are placed accordingly.
-
Bollinger Bands: When price breaks through the Bollinger upper band, a short trade is placed; when price breaks down the Bollinger lower band, a long trade is placed.
-
Moving Average: The highest and lowest prices over a certain period (e.g. 5 periods) are calculated. When price is higher than the highest point over the past 5 periods, a long trade is placed; when price is lower than the lowest point over the past 5 periods, a short trade is placed.
-
MACD: The crossover and death cross of fast line, slow line and MACD line are used as auxiliary judgement indicators.
These indicators work together to judge the market in trending and consolidating stages. Bollinger Bands identify breakouts and reversions to mean. Moving averages determine trend reversal points during consolidation. RSI extremes spot overbought/oversold market conditions for counter-trend trades.
The advantages of this strategy are:
-
Combination of multiple indicators improves accuracy. RSI, Bollinger Bands, moving average and more interact to produce reliable trading signals.
-
Applicable to different market conditions. Bollinger Bands for trends, moving averages for consolidation, RSI for extremes. Flexibility is ensured.
-
Reasonable trading frequency. Indicator parameters are set conservatively to avoid over-trading.
-
Clean code structure. Easy to understand, edit and build upon.
Some risks need attention:
-
Parameter risks. Inappropriate indicator parameters may generate incorrect trading signals. Parameters need continuous testing and optimization.
-
Long/short switch risks. Frequent long/short position changes around trend reversals increase trading costs. Holding period can be adjusted.
-
Coding risks. Logical flaws hidden in the code could lead to abnormal trades. Exception handling and logging should be improved.
The strategy can be upgraded in the following aspects:
-
Add stop loss to lock in profits and reduce losses.
-
Incorporate trading volume to avoid false signals. E.g. check volume on Bollinger breakouts.
-
Introduce machine learning to find optimal parameters based on historical data.
-
Build graphical interface for intuitive display of performance.
-
Conduct backtesting to find best parameter combinations.
This strategy combines moving average, Bollinger Bands, RSI and more to generate trading signals. Its versatility and accuracy are clear strengths, while parameter setting and coding risks need to be managed. Next steps are to add stops, machine learning for parameter optimization, GUI for monitoring, and to improve exceptions handling.
[/trans]
Strategy Arguments
| Argument | Default | Description |
|---|---|---|
| v_input_1 | 14 | lengthrsi |
| v_input_2 | 30 | overSold |
| v_input_3 | 70 | overBought |
| v_input_4 | 20 | lengthbb |
| v_input_5 | 2 | mult |
| v_input_6 | false | Strategy Direction |
| v_input_7 | 12 | fastLength |
| v_input_8 | 26 | slowlength |
| v_input_9 | 9 | MACDLength |
| v_input_10 | 3 | consecutiveBarsUp |
| v_input_11 | 3 | consecutiveBarsDown |
| v_input_12 | 5 | lengthch |
Source (PineScript)
/*backtest
start: 2024-01-19 00:00:00
end: 2024-02-15 00:00:00
period: 4h
basePeriod: 15m
exchanges: [{"eid":"Futures_Binance","currency":"BTC_USDT"}]
*/

//@version=2
strategy("MD strategy", overlay=true)
lengthrsi = input( 14 )
overSold = input( 30 )
overBought = input( 70 )
price = close
source = close
lengthbb = input(20, minval=1)
mult = input(2.0, minval=0.001, maxval=50)
direction = input(0, title = "Strategy Direction",minval=-1, maxval=1)
fastLength = input(12)
slowlength = input(26)
MACDLength = input(9)
consecutiveBarsUp = input(3)
consecutiveBarsDown = input(3)
lengthch = input( minval=1, maxval=1000, defval=5)
upBound = highest(high, lengthch)
downBound = lowest(low, lengthch)


ups = price > price[1] ? nz(ups[1]) + 1 : 0
dns = price < price[1] ? nz(dns[1]) + 1 : 0
MACD = ema(close, fastLength) - ema(close, slowlength)
aMACD = ema(MACD, MACDLength)
delta = MACD - aMACD

strategy.risk.allow_entry_in(direction == 0 ? strategy.direction.all : (direction < 0 ? strategy.direction.short : strategy.direction.long))

basis = sma(source, lengthbb)
dev = mult * stdev(source, lengthbb)

upper = basis + dev
lower = basis - dev

vrsi = rsi(price, lengthrsi)

if (not na(vrsi))
    if (crossover(vrsi, overSold))
        strategy.entry("RsiLE", strategy.long, comment="RsiLE")
    if (crossunder(vrsi, overBought))
        strategy.entry("RsiSE", strategy.short, comment="RsiSE")

if (crossover(source, lower))
    strategy.entry("BBandLE", strategy.long, stop=lower, oca_name="BollingerBands",  comment="BBandLE")
else
    strategy.cancel(id="BBandLE")

if (crossunder(source, upper))
    strategy.entry("BBandSE", strategy.short, stop=upper, oca_name="BollingerBands",  comment="BBandSE")
else
    strategy.cancel(id="BBandSE")


if (not na(close[lengthch]))
    strategy.entry("ChBrkLE", strategy.long, stop=upBound + syminfo.mintick, comment="ChBrkLE")
    strategy.entry("ChBrkSE", strategy.short, stop=downBound - syminfo.mintick, comment="ChBrkSE")


//plot(strategy.equity, title="equity", color=red, linewidth=2, style=areabr)
Detail
https://www.fmz.com/strategy/442109
Last Modified
2024-02-19 14:18:00
