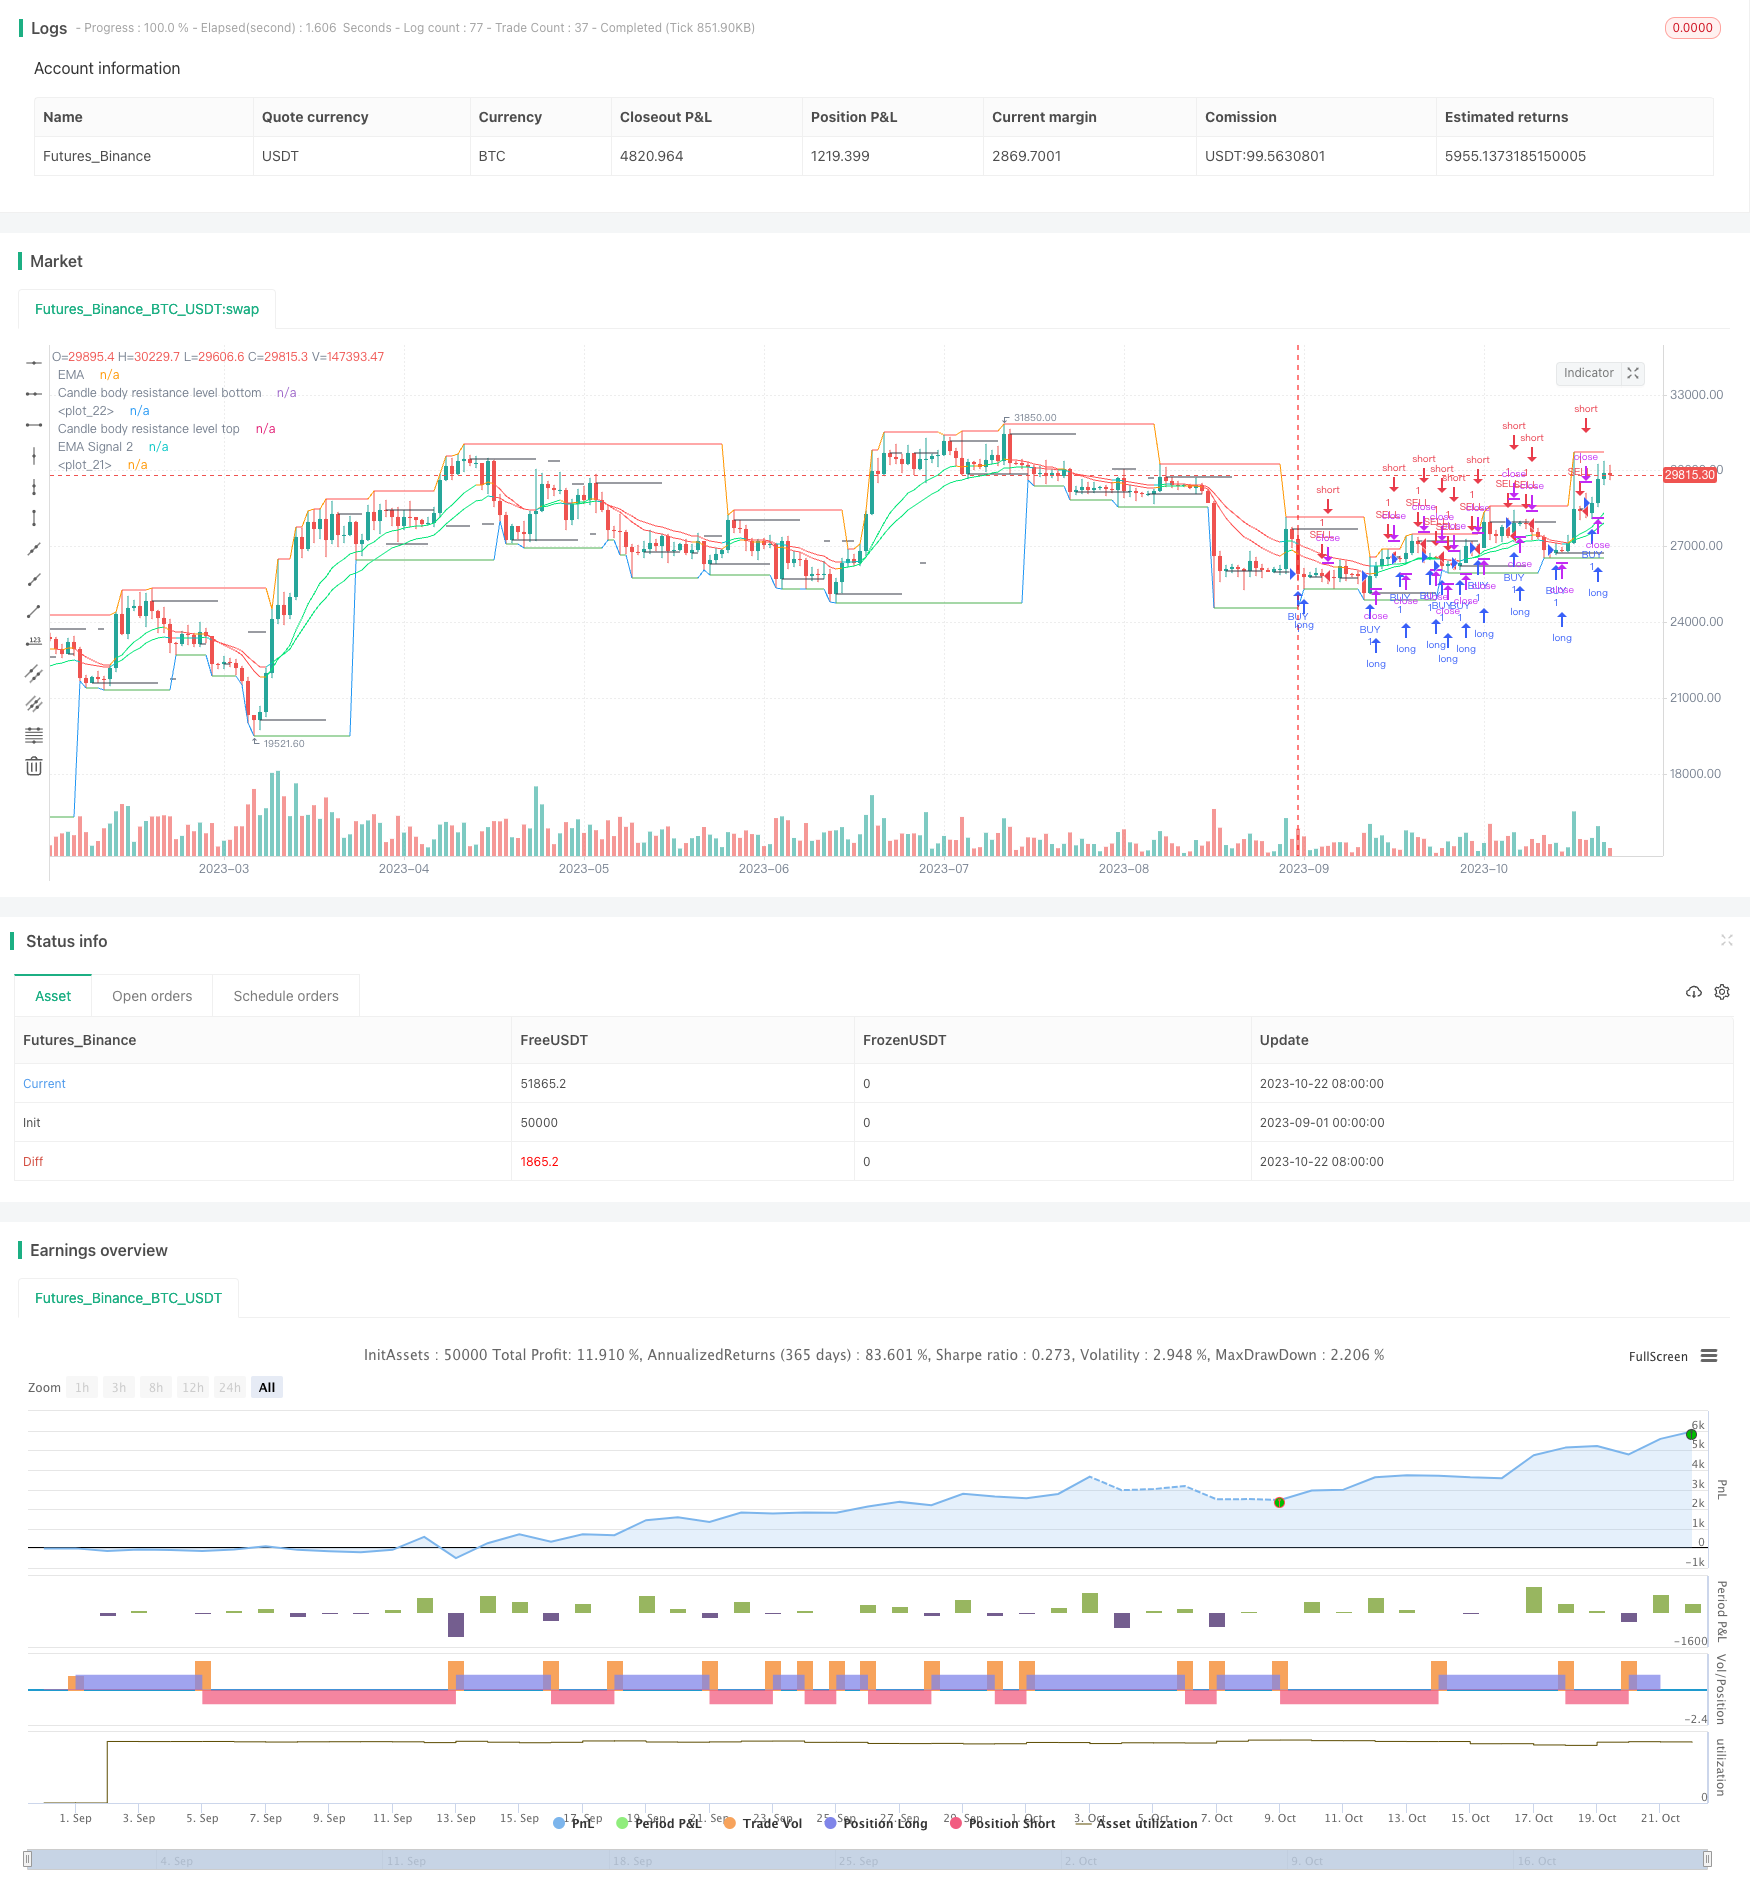
Name
均线穿越多空策略Trend-Following-Strategy-Based-on-Moving-Average-Crossover
Author
ChaoZhang
Strategy Description
[trans]
本策略主要利用移动均线的金叉死叉以及K线突破均线进行多空决策。当短期移动均线上穿较长期移动均线时做多,当短期移动均线下穿较长期移动均线时做空。同时结合K线的收盘价突破均线作为进场信号。
-
计算两条不同周期的移动均线EMA1和EMA2。EMA1周期短,EMA2周期长。
-
判断EMA1是否上穿EMA2,如果是,做多。
-
判断EMA1是否下穿EMA2,如果是,做空。
-
判断收盘价是否突破EMA1,作为进场信号。
-
止损退出机制:设定固定止损点或通过Donchian通道设定止损。
主要使用以下函数:
- ema(): 计算指数移动均线
- crossover(): 判断EMA1是否上穿EMA2
- crossunder(): 判断EMA1是否下穿EMA2
- rising()/falling(): 判断价格是否上涨/下跌
- valuewhen(): 根据条件返回不同值
-
策略思路简单,容易理解实现。
-
利用均线系统的趋势跟踪特性,能够有效跟踪趋势。
-
结合K线收盘价的突破作为入场时机,可以避免假突破。
-
可灵活运用不同参数的均线组合,适应不同周期。
-
可设置止损机制控制风险。
-
当市场处于震荡行情时,均线将产生频繁的金叉死叉信号,容易止损。
-
固定止损点可能过于死板,无法根据市场变化调整。
-
均线系统较滞后,在趋势转折点时容易错过反转信号。
-
需要精准判断均线斜度来过滤假突破。
-
需谨慎选择参数,过于频繁或滞后的参数组合将影响策略效果。
-
可利用MACD指标的零轴交叉来确定趋势,过滤震荡。
-
可以加入Donchian通道来设定动态止损线,改善固定止损问题。
-
可以加入布林带指标判断强弱趋势,避免在震荡市场无效交易。
-
优化均线参数组合,测试不同周期策略的实际效果。
-
可考虑加入锚定移动均线避免滞后。
本策略整体思路简单清晰,利用例行的均线金叉死叉交易策略,同时结合K线突破来进场,可有效过滤假信号。优化空间在于运用其他指标来判断趋势强弱、设置动态止损等。整体而言,基于均线的趋势跟踪策略经典易懂,值得探索其优化空间。
||
This strategy mainly uses the golden cross and dead cross of moving averages and candlestick breakthrough of moving averages to make long and short decisions. It goes long when the short period moving average crosses over the longer period moving average, and goes short when the short period moving average crosses below the longer period moving average. Candlestick close price breaking through the moving average is also used as the entry signal.
-
Calculate two moving averages, EMA1 and EMA2, with different periods. EMA1 has a shorter period and EMA2 has a longer period.
-
Determine if EMA1 crosses over EMA2, if yes, go long.
-
Determine if EMA1 crosses below EMA2, if yes, go short.
-
Determine if the closing price breaks through EMA1 as the entry signal.
-
Exit mechanism: set fixed stop loss or use Donchian Channel to set stop loss.
Main functions used:
- ema(): calculate exponential moving average
- crossover(): determine if EMA1 crosses over EMA2
- crossunder(): determine if EMA1 crosses below EMA2
- rising()/falling(): determine if price is rising or falling
- valuewhen(): return different values based on condition
-
Simple logic, easy to understand and implement.
-
Utilize the trend following trait of moving averages to effectively track trends.
-
Combining candlestick close price breakthrough helps avoid false breakthroughs.
-
Flexible usage of different moving average combinations adaptable to different periods.
-
Stop loss mechanism controls risk.
-
Frequent golden crosses and dead crosses during market consolidation cause whipsaws.
-
Fixed stop loss points may be too rigid to adjust based on market changes.
-
Moving averages lag and may miss reversal signals at turning points.
-
Precise judgment of moving average slope needed to filter false breakthroughs.
-
Parameter selection needs caution, inappropriate frequency or lagging may affect strategy performance.
-
MACD zero line crossover can help determine trends and filter consolidations.
-
Add Donchian Channel for dynamic stop loss line to improve fixed stop loss.
-
Add Bollinger Bands to judge strong or weak trends, avoiding ineffective trading during market consolidations.
-
Optimize moving average parameter combinations and test actual performance of different period strategies.
-
Consider adding anchored moving averages to reduce lag.
The overall logic of this strategy is simple and clear, utilizing classic moving average crossover trading techniques, and combining candlestick breakout for entry to effectively filter false signals. Optimization spaces include using other indicators for trend strength, dynamic stops etc. In general, trend following strategies based on moving averages are classic and intuitive, with valuable exploration spaces for optimization.
[/trans]
Strategy Arguments
| Argument | Default | Description |
|---|---|---|
| v_input_1_close | 0 | Candle body resistance Channel: close |
| v_input_2 | false | Bar Channel On/Off |
| v_input_3 | 10 | Support / Resistance length: |
| v_input_4 | 13 | EMA 1 |
| v_input_5 | 21 | EMA 2 |
| v_input_6 | false | Display Hull MA Set: |
| v_input_7_close | 0 | Hull MA's Source:: close |
| v_input_8 | 8 | Hull MA's Base Length: |
| v_input_9 | 5 | Hull MA's Length Scalar: |
| v_input_10 | 720 | period |
Source (PineScript)
/*backtest
start: 2023-09-01 00:00:00
end: 2023-10-23 00:00:00
period: 1d
basePeriod: 1h
exchanges: [{"eid":"Futures_Binance","currency":"BTC_USDT"}]
*/

//@version=2
strategy(title='Mega crypto bot strategy', shorttitle='megacryptobot_Strategy', overlay=true, pyramiding=0, initial_capital=10000, currency=currency.USD)

//Candle body resistance Channel-----------------------------//
len = 34
src = input(close, title="Candle body resistance Channel")
out = sma(src, len)
last8h = highest(close, 13)
lastl8 = lowest(close, 13)
bearish = cross(close,out) == 1 and falling(close, 1)
bullish = cross(close,out) == 1 and rising(close, 1)
channel2=input(false, title="Bar Channel On/Off")
ul2=plot(channel2?last8h:last8h==nz(last8h[1])?last8h:na, color=black, linewidth=1, style=linebr, title="Candle body resistance level top", offset=0)
ll2=plot(channel2?lastl8:lastl8==nz(lastl8[1])?lastl8:na, color=black, linewidth=1, style=linebr, title="Candle body resistance level bottom", offset=0)
//fill(ul2, ll2, color=black, transp=95, title="Candle body resistance Channel")

//-----------------Support and Resistance
RST = input(title='Support / Resistance length:',  defval=10)
RSTT = valuewhen(high >= highest(high, RST), high, 0)
RSTB = valuewhen(low <= lowest(low, RST), low, 0)
RT2 = plot(RSTT, color=RSTT != RSTT[1] ? na : red, linewidth=1, offset=+0)
RB2 = plot(RSTB, color=RSTB != RSTB[1] ? na : green, linewidth=1, offset=0)

//--------------------Trend colour ema------------------------------------------------//
src0 = close, len0 = input(13, minval=1, title="EMA 1")
ema0 = ema(src0, len0)
direction = rising(ema0, 2) ? +1 : falling(ema0, 2) ? -1 : 0
plot_color = direction > 0  ? lime: direction < 0 ? red : na
plot(ema0, title="EMA", style=line, linewidth=1, color = plot_color)

//-------------------- ema 2------------------------------------------------//
src02 = close, len02 = input(21, minval=1, title="EMA 2")
ema02 = ema(src02, len02)
direction2 = rising(ema02, 2) ? +1 : falling(ema02, 2) ? -1 : 0
plot_color2 = direction2 > 0  ? lime: direction2 < 0 ? red : na
plot(ema02, title="EMA Signal 2", style=line, linewidth=1, color = plot_color2)

//=============Hull MA//
show_hma = input(false, title="Display Hull MA Set:")
hma_src = input(close, title="Hull MA's Source:")
hma_base_length = input(8, minval=1, title="Hull MA's Base Length:")
hma_length_scalar = input(5, minval=0, title="Hull MA's Length Scalar:")
hullma(src, length)=>wma(2*wma(src, length/2)-wma(src, length), round(sqrt(length)))
plot(not show_hma ? na : hullma(hma_src, hma_base_length+hma_length_scalar*6), color=black, linewidth=2, title="Hull MA")

//============ signal Generator ==================================//
period = input('720')
ch1 = request.security(syminfo.tickerid, period, open)
ch2 = request.security(syminfo.tickerid, period, close)
longCondition = crossover(request.security(syminfo.tickerid, period, close),request.security(syminfo.tickerid, period, open))
if (longCondition)
    strategy.entry("BUY", strategy.long)
shortCondition = crossunder(request.security(syminfo.tickerid, period, close),request.security(syminfo.tickerid, period, open))
if (shortCondition)
    strategy.entry("SELL", strategy.short)

///////////////////////////////////////////////////////////////////////////////////////////
Detail
https://www.fmz.com/strategy/430011
Last Modified
2023-10-24 11:02:52
