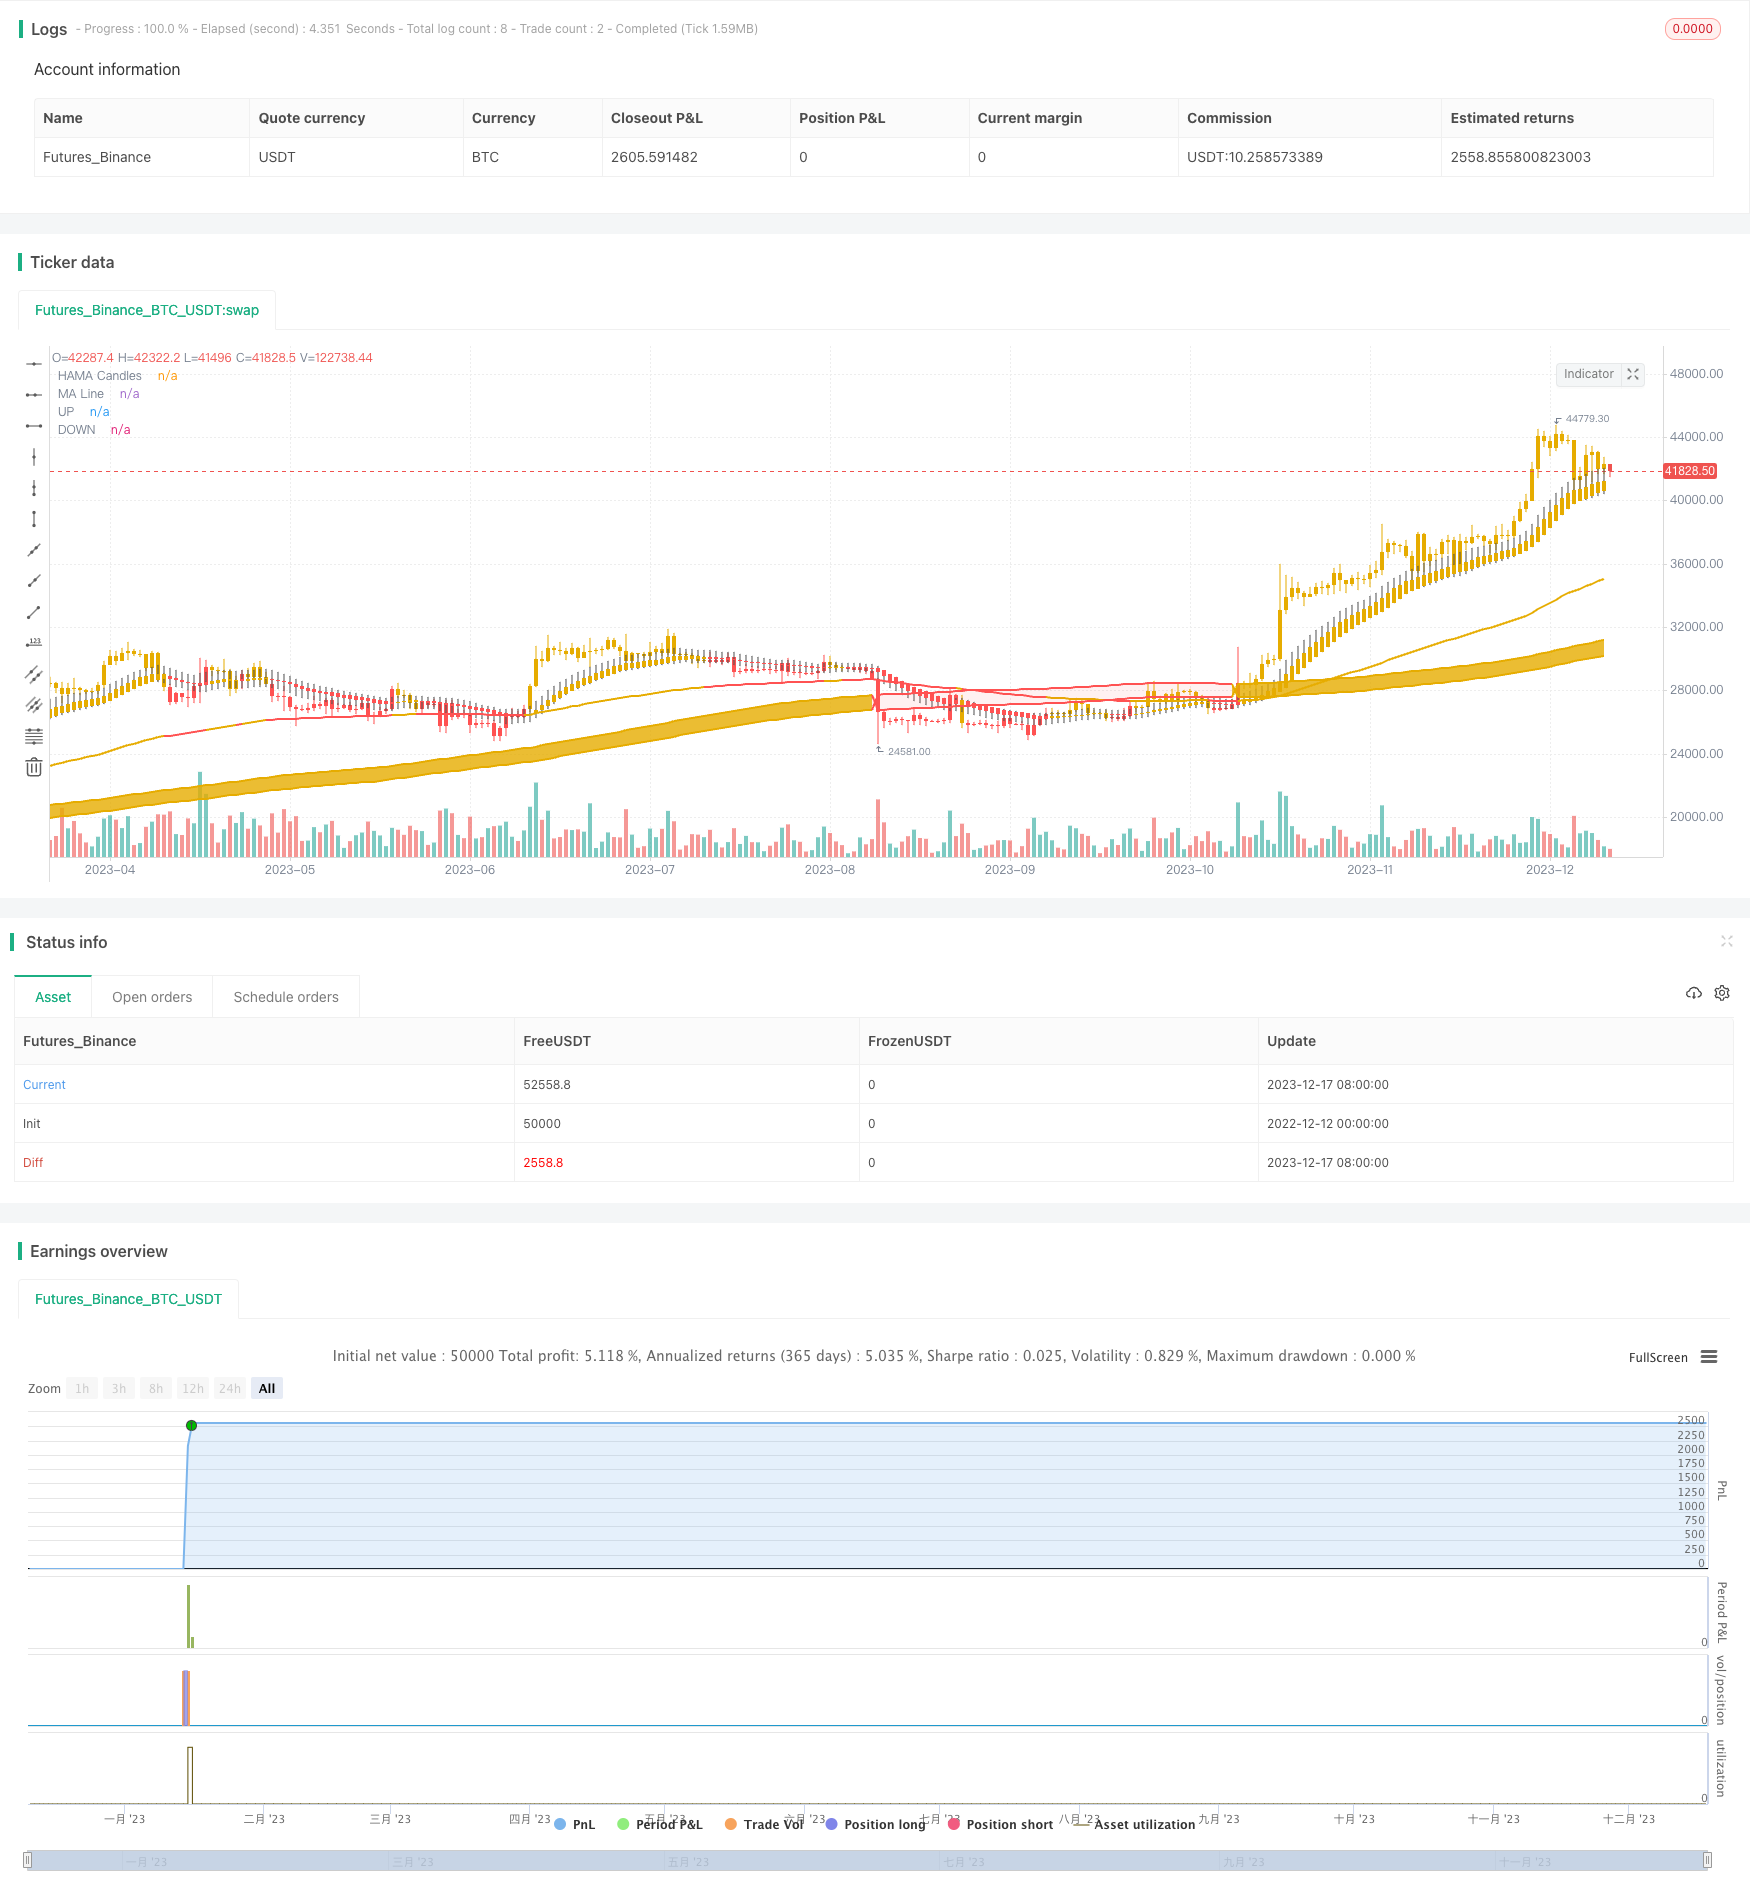
Name
坚如磐石的VIP量化策略The-Solid-as-a-Rock-VIP-Quant-Strategy
Author
ChaoZhang
Strategy Description
本策略名为“坚如磐石的VIP量化策略”,它融合了改进后威廉SMA指标(Modified WMA)和SSL通道指标(SSL Channel),构建了一个稳定可靠的量化交易框架。
该策略结合了两个指标,一个是改进后的威廉SMA指标,通过计算每根K线的均价,然后应用指数移动平均方法来确定趋势方向。另一个是SSL通道指标,它采用最高价和最低价的移动平均线来确定价格通道,判断目前的趋势状态。
当改进后的威廉SMA指标发出买入信号,即金叉时,我们再结合SSL通道指标判断通道内价格是否合适,如果K线实体完全在通道下限之下时,我们就在该点进行买入开仓。
- 通过结合两个指标,使买入信号更加可靠,避免假突破。
- 改进后的威廉SMA指标可以更准确判断趋势转换点。
- SSL通道指标可以清楚判断价格通道,避免高位买入。
- 采用指数移动平均方法,更有利于判断长期趋势。
- 如果遇到剧烈行情,止损点可能会被轻易触发。可以适当放宽止损范围。
- 移动平均线系统对短期市场噪音敏感,可能产生错误信号。可以适当加大均线参数,增强过滤效果。
- 参数设置不当也会影响策略表现。可以通过回测优化参数,找到最佳参数组合。
- 可以测试不同类型的移动平均线,如EMA、VWMA等,寻找最匹配的均线指标。
- 可以加入成交量指标,避免在低量区域发出信号。
- 可以尝试不同的通道绘制方法,如Donchian通道等,使通道界限更加可靠。
- 可以加入其他辅助指标,如MACD、RSI等,进一步确认买入时机。
本策略通过改进后的威廉SMA指标和SSL通道指标的巧妙结合,构建了一个稳定、可靠的量化交易框架。它过滤市场噪音的能力较强,同时也避免了高位买入的风险。如果参数设置得当,并加入一定的优化,它将是一个非常Outperforming的策略。 ||
This strategy is called "The Solid as a Rock VIP Quant Strategy". It combines the Modified WMA indicator and the SSL Channel indicator to build a stable and reliable quantitative trading framework.
The strategy incorporates two indicators. One is the Modified WMA indicator, which calculates the average price of each candlestick and then applies the exponential moving average method to determine the trend direction. The other one is the SSL Channel indicator, which uses moving averages of highest and lowest prices to determine the price channel and judge the current trend status.
When the Modified WMA indicator generates a buy signal, that is, the golden cross, we combine the SSL Channel indicator to determine if the price in the channel is suitable. If the candle body is completely below the channel's lower limit, we will place the buy order.
- Combining two indicators makes the buy signal more reliable to avoid false breakouts.
- The Modified WMA Indicator can determine turning points more precisely.
- The SSL Channel clearly judges the price channel to avoid buying at high levels.
- Using the exponential moving average method is more conducive to determining long-term trends.
- Stop loss points may be easily triggered in volatile markets. We can appropriately expand the stop loss range.
- Moving average systems are sensitive to short-term market noise, which may generate incorrect signals. We can properly increase the moving average parameters to enhance the filtering effect.
- Improper parameter settings can also affect strategy performance. We can optimize parameters through backtesting to find the best parameter combination.
- We can test different types of moving averages, such as EMA and VWMA, to find the best matching average line indicator.
- We can add volume indicators to avoid signals in low volume areas.
- We can try different methods of channel drawing, such as Donchian Channel, to make the channel boundaries more reliable.
- We can add other auxiliary indicators, such as MACD and RSI, to further confirm entry timing.
Through the ingenious combination of the Modified WMA indicator and the SSL Channel indicator, this strategy builds a stable and reliable quantitative trading framework. It has a strong ability to filter market noise while avoiding the risk of buying at high levels. With proper parameter settings and certain optimizations, it will be a highly outperforming strategy. [/trans]
Strategy Arguments
| Argument | Default | Description |
|---|---|---|
| v_input_color_1 | #505050 | Wick Color |
| v_input_int_1 | 100 | MA Line Length |
| v_input_float_1 | true | Take Profit Percentage |
| v_input_bool_1 | false | Use Stop Percentage |
| v_input_float_2 | true | StopLose Percentage |
Source (PineScript)
/*backtest
start: 2022-12-12 00:00:00
end: 2023-12-18 00:00:00
period: 1d
basePeriod: 1h
exchanges: [{"eid":"Futures_Binance","currency":"BTC_USDT"}]
*/

// This source code is subject to the terms of the Mozilla Public License 2.0 at https://mozilla.org/MPL/2.0/
// © Darshana_Alwis

//@version=5
strategy("VIP", overlay=true, initial_capital=1000,currency=currency.USD,default_qty_type=strategy.percent_of_equity,default_qty_value=100,pyramiding=0)
//SSS = Sultan+Saud Strategy

//The original idea of the code belonges to saudALThaidy
//The strategy code is basically made out of two other indicators, edited and combined by me.
// 1- NSDT HAMA Candles => https://www.tradingview.com/script/k7nrF2oI-NSDT-HAMA-Candles/
// 2- SSL Channel => https://www.tradingview.com/script/6y9SkpnV-SSL-Channel/


//MA INFO
WickColor = input.color(color.rgb(80, 80, 80, 100), title='Wick Color', tooltip='Suggest Full Transparency.')
LengthMA = input.int(100, minval=1, title='MA Line Length', inline='MA Info')
TakeProfit = input.float(1, minval=0, title='Take Profit Percentage', step=1)
UseStopLose = input.bool(false, title='Use Stop Percentage')
StopLose = input.float(1, minval=0, title='StopLose Percentage', step=1)

MASource = close

ma(source, length, type) =>
    type == "SMA" ? ta.sma(source, length) :
     type == "EMA" ? ta.ema(source, length) :
     type == "SMMA (RMA)" ? ta.rma(source, length) :
     type == "WMA" ? ta.wma(source, length) :
     type == "VWMA" ? ta.vwma(source, length) :
     na

ma1_color  = color.rgb(230, 172, 0)
ma1 = ma(high, 200, "SMA")

ma2_color  = color.red
ma2 = ma(low, 200, "SMA")

Hlv1 = float(na)
Hlv1 := close > ma1 ? 1 : close < ma2 ? -1 : Hlv1[1]
sslUp1   = Hlv1 < 0 ? ma2 : ma1
sslDown1 = Hlv1 < 0 ? ma1 : ma2

Color1 = Hlv1 == 1 ? ma1_color : ma2_color
fillColor1 = color.new(Color1, 90)

highLine1 = plot(sslUp1, title="UP", linewidth=2, color = Color1)
lowLine1 = plot(sslDown1, title="DOWN", linewidth=2, color = Color1)

OpenLength = 25
HighLength = 20
LowLength = 20
CloseLength = 20


SourceOpen = (open[1] + close[1]) / 2
SourceHigh = math.max(high, close)
SourceLow = math.min(low, close)
SourceClose = (open + high + low + close) / 4

funcCalcMA1(src1, len1) => ta.ema(src1, len1)
funcCalcOpen(SourceOpen, OpenLength) => ta.ema(SourceOpen, OpenLength)
funcCalcHigh(SourceHigh, HighLength) => ta.ema(SourceHigh, HighLength)
funcCalcLow(SourceLow, LowLength) => ta.ema(SourceLow, LowLength)
funcCalcClose(SourceClose, CloseLength) => ta.ema(SourceClose, CloseLength)

MA_1 = funcCalcMA1(MASource, LengthMA)

CandleOpen = funcCalcOpen(SourceOpen, OpenLength)
CandleHigh = funcCalcHigh(SourceHigh, HighLength)
CandleLow = funcCalcLow(SourceLow, LowLength)
CandleClose = funcCalcClose(SourceClose, CloseLength)

//PLOT CANDLES
//-------------------------------NSDT HAMA Candels
BodyColor = CandleOpen > CandleOpen[1] ? color.rgb(230, 172, 0) : color.red
barcolor(BodyColor)
plotcandle(CandleOpen, CandleHigh, CandleLow, CandleClose, color=BodyColor, title='HAMA Candles', wickcolor=WickColor, bordercolor=na)
plot(MA_1, title='MA Line', color=BodyColor, style=plot.style_line, linewidth=2)

//------------------------------SSL Channel


plot_buy = false
avg = ((high-low)/2)+low
LongCondition = (Hlv1 == 1 and Hlv1[1] == -1) and (BodyColor == color.rgb(230, 172, 0)) and (MA_1 < avg) and (CandleHigh < avg) and (strategy.opentrades == 0)
if LongCondition
    strategy.entry("BUY with VIP", strategy.long)
    plot_buy := true

base = strategy.opentrades.entry_price(0)
baseProfit = (base+((base/100)*TakeProfit))
baseLose = (base-((base/100)*StopLose))

strategy.exit("SELL with VIP","BUY with VIP",limit = baseProfit)
if UseStopLose and (close < MA_1)
    strategy.exit("SELL with VIP","BUY with VIP",stop = baseLose)
if not UseStopLose and (close < MA_1)
    strategy.exit("SELL with VIP","BUY with VIP", stop = close)

plotshape(plot_buy, title="Buy Label", text="Buy", location=location.belowbar, style=shape.labelup, size=size.tiny, color=Color1, textcolor=color.white)

fill(highLine1, lowLine1, color = fillColor1)
Detail
https://www.fmz.com/strategy/435866
Last Modified
2023-12-19 13:54:05
