Name
埃利奥特波动叠加200日均线交易策略Elliott-Wave-Strategy-with-200-Day-Moving-Average
Author
ChaoZhang
Strategy Description
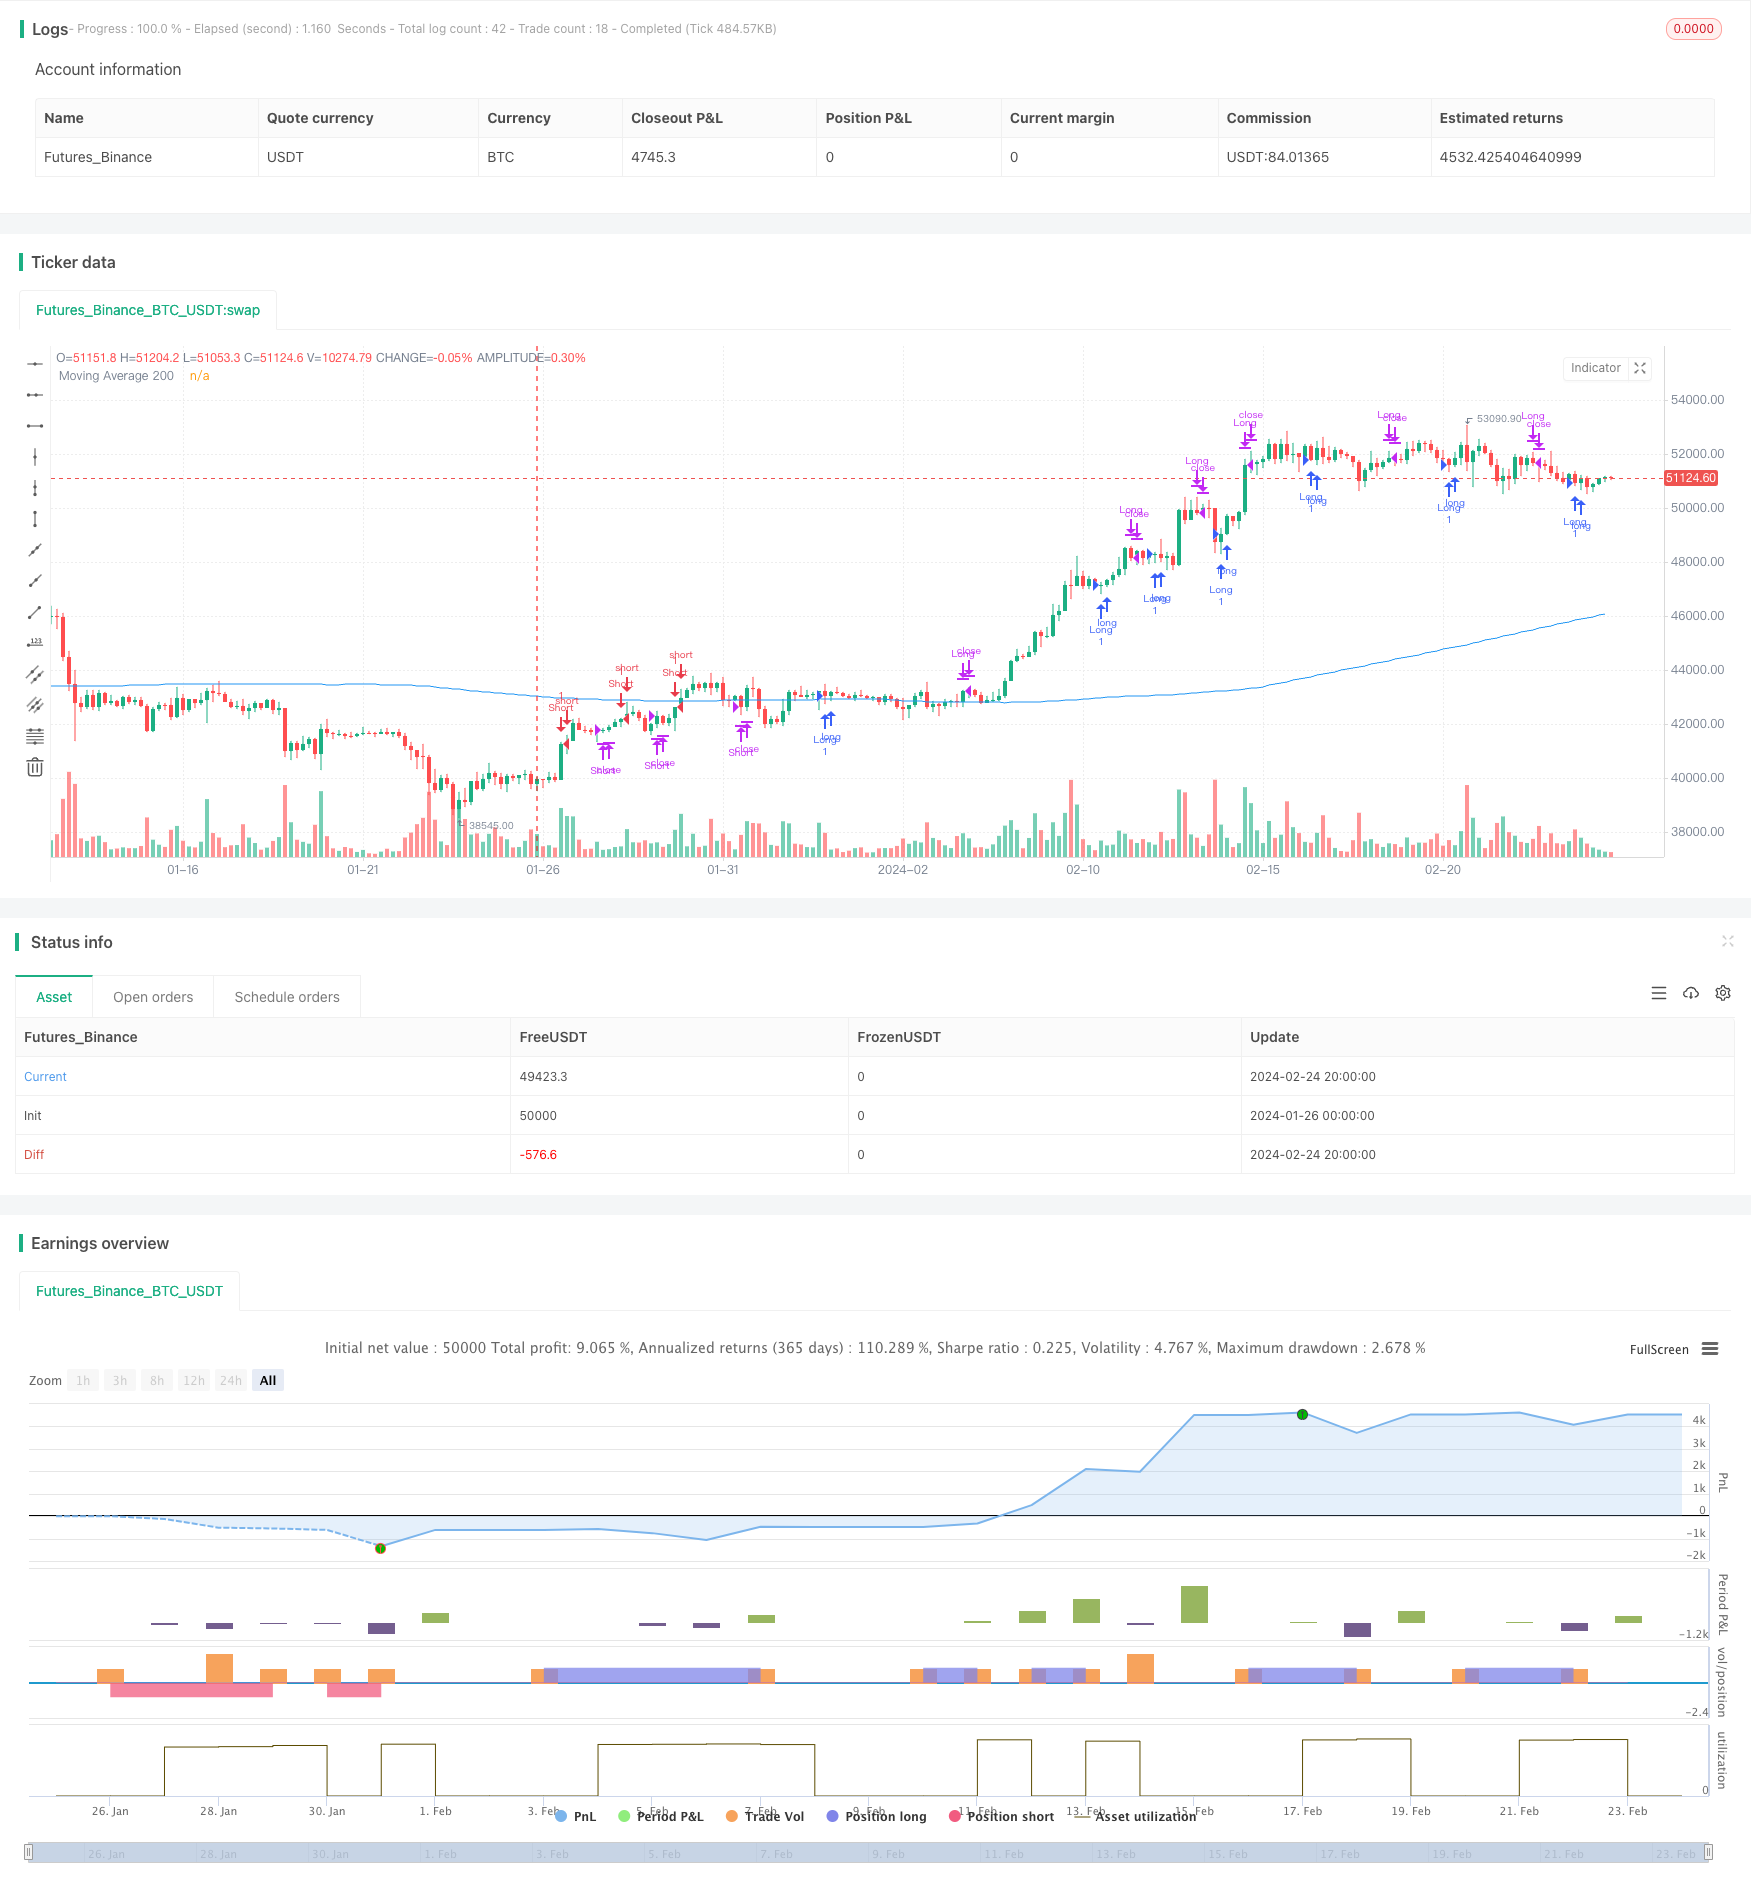
该策略结合了埃利奥特波动理论和200日均线指标,实现了趋势追踪和盈利回吐的自动化交易。其基本逻辑是在埃利奥特5浪构成的波动模式出现时,判断趋势方向,并以200日均线作为辅助条件发出交易信号。
埃利奥特波动理论将市场的价格波动分为5浪构成的波段,奇数波为动力浪,偶数波为回调浪。当Wave1、Wave3、Wave5的高点依次上推,并且Wave2、Wave4依次有效回调时,判断为上涨浪组合,属于多头市场,该策略在此时做多。相反,当Wave1、Wave3、Wave5的低点依次下推,并且Wave2、Wave4依次有效回调时,判断为空头浪组合,属于空头市场,该策略在此时做空。
该策略同时引入200日均线指标,作为辅助判断条件。只有在判断出多头或空头浪组合的同时,当天收盘价超过上方200日均线时方可做多,当天收盘价跌破下方200日均线时方可做空。
做多做空信号发出后,以相反方向的五浪退出仓位。
- 利用埃利奥特波动理论判断市场趋势和关键点,可以及时捕捉市场转折。
- 基于200日均线指标进行过滤,避免在震荡行情中被套牢。
- 整体上,该策略可以在股市或期货市场的中长线上取得较好的盈利。
- 在实盘中,价格波动可能无法完美符合埃利奥特理论中的五浪类型,所以存在一定的误判风险。
- 仅凭五浪形态无法判断该波段在更大的市场格局中所处的位置和意义。
- 在震荡行情中容易产生错误交易信号并亏损。
- 未考虑股价波动对200日均线位置的动态影响。
- 可以结合更多指标进行过滤,如MACD、KDJ等,降低误判率。
- 优化五浪形态识别算法,提高准确率。
- 增加对当前波段在更大级别上涨或下跌浪的判断,避免逆势操作。
- 结合交易量变化等指标判断真正的趋势转折点。
- 考虑股价波动对200日均线位置影响的动态调整。
该策略整合波动理论与趋势跟踪指标的优点,在捕捉市场关键点和控制交易风险上表现出色。但由于仅考虑价格信息,在复杂行情下效果仍有待优化。在实盘过程中需要严格监控并持续调整,方能取得长期稳定收益。
||
This strategy combines Elliott Wave theory and 200-day moving average indicator to achieve automated trend following and profit taking trading. Its basic logic is to determine the trend direction when Elliott 5-wave patterns appear, and issue trading signals with the 200-day moving average as an auxiliary condition.
Elliott Wave theory divides market price fluctuations into 5-wave segments. Odd-numbered waves are motive waves and even-numbered waves are corrective waves. When the high points of Wave1, Wave3 and Wave5 push up in sequence, and Wave2 and Wave4 retract effectively in sequence, it is judged as an upward wave combination, which belongs to a bull market. The strategy goes long at this time. On the contrary, when the low points of Wave1, Wave3 and Wave5 push down in sequence, and Wave2 and Wave4 retract effectively in sequence, it is judged as a downward wave combination, which belongs to a bear market. The strategy goes short at this time.
The strategy also introduces the 200-day moving average indicator as an auxiliary judgment condition. Only when a bullish or bearish Elliott wave pattern is identified and the closing price of the day exceeds the 200-day moving average line can a long position be taken, and a short position can be taken only if the closing price of the day breaks below the 200-day moving average line.
After the long and short signals are issued, the opposite direction five waves exit the position.
- Using Elliott wave theory to determine market trends and key points can capture market turns in a timely manner.
- Based on the 200-day moving average indicator filter to avoid being trapped in a range-bound market.
- Overall, this strategy can achieve good profits in the medium-to-long term in the stock market or futures market.
- In live trading, price fluctuations may not perfectly match the five-wave patterns described in Elliott theory, so there is a certain risk of misjudgment.
- Relying solely on the five-wave pattern cannot determine the position and significance of this wave segment in the larger market context.
- It is easy to generate wrong trading signals and losses in sideways markets.
- It does not consider the dynamic impact of stock price fluctuations on the position of the 200-day moving average.
- More indicators can be combined for filtering, such as MACD, KDJ, etc., to reduce misjudgment rate.
- Optimize the five-wave pattern recognition algorithm to improve accuracy.
- Increase judgment on whether the current wave segment is in an upward or downward wave at a larger level to avoid trading against the trend.
- Incorporate indicators like trading volume changes to determine true trend reversal points.
- Consider dynamic adjustments taking into account stock price fluctuations on 200-day moving average position.
This strategy integrates the advantages of wave theory and trend-following indicators, and performs well in capturing market key points and controlling trading risks. However, relying solely on price information means there is room for improving effectiveness in complex market conditions. Strict monitoring and continuous adjustment during live trading are necessary to achieve long-term steady profits.
[/trans]
Source (PineScript)
/*backtest
start: 2024-01-26 00:00:00
end: 2024-02-25 00:00:00
period: 4h
basePeriod: 15m
exchanges: [{"eid":"Futures_Binance","currency":"BTC_USDT"}]
*/

//@version=4
strategy("Elliott Wave Strategy with 200 SMA", overlay=true)

// Elliott Wave Strategy
wave1High = high[1]
wave1Low = low[1]
wave2High = high[2]
wave2Low = low[2]
wave3High = high[3]
wave3Low = low[3]
wave4High = high[4]
wave4Low = low[4]
wave5High = high[5]
wave5Low = low[5]

bullishWavePattern = wave3High > wave1High and wave4Low > wave2Low and wave5High > wave3High
bearishWavePattern = wave3Low < wave1Low and wave4High < wave2High and wave5Low < wave3Low

enterLong = bullishWavePattern and close > sma(close, 200)
exitLong = bearishWavePattern
enterShort = bearishWavePattern and close < sma(close, 200)
exitShort = bullishWavePattern

// Plotting 200 SMA
sma200 = sma(close, 200)
plot(sma200, color=color.blue, title="Moving Average 200")

// Displaying "Razer Moving 200" message on chart
if (enterLong)
    label.new(bar_index, low, "Long on Moving 200", color=color.green, textcolor=color.white)
if (enterShort)
    label.new(bar_index, high, "Short on Moving 200", color=color.red, textcolor=color.white)

if (enterLong)
    strategy.entry("Long", strategy.long)
if (exitLong)
    strategy.close("Long")
if (enterShort)
    strategy.entry("Short", strategy.short)
if (exitShort)
    strategy.close("Short")
Detail
https://www.fmz.com/strategy/442813
Last Modified
2024-02-26 10:49:25
