Name
基于一目均线系统的BTC交易策略Ichimoku-Kinko-Hyo-Based-BTC-Trading-Strategy
Author
ChaoZhang
Strategy Description
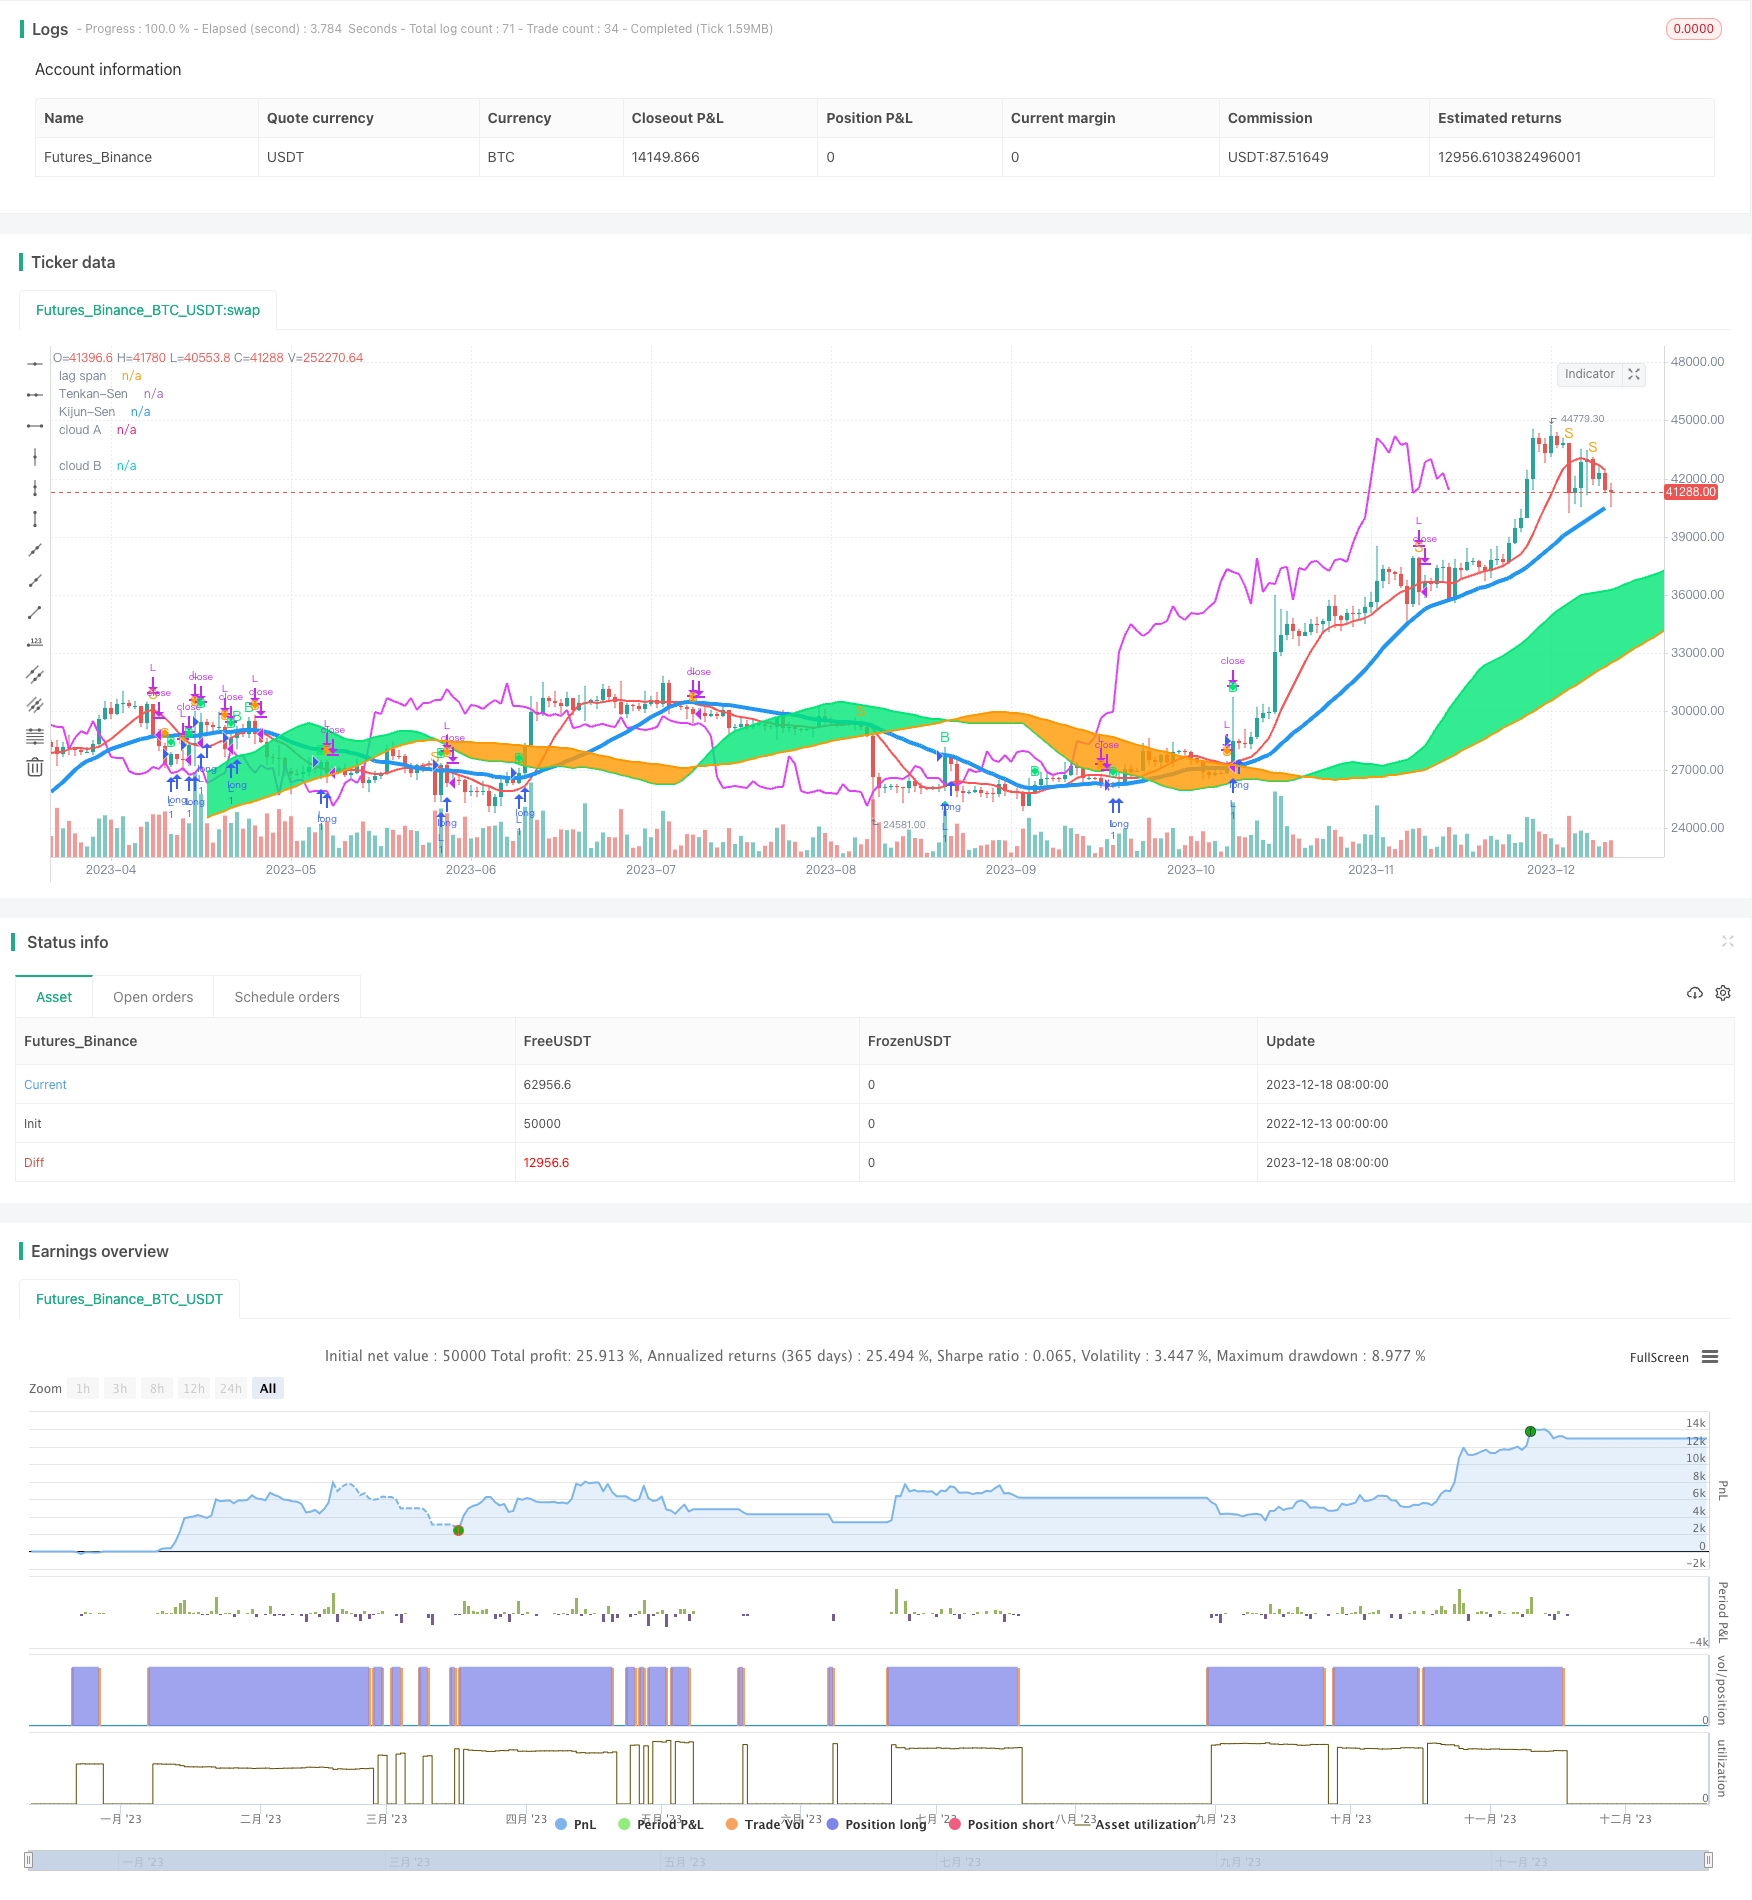
本策略名称为“Ichimoku Kinko Hyo Strategy”,即一目均线系统策略。它是一个以一目均线为基础,结合其他技术指标的BTC交易策略。
该策略主要基于一目均线系统,这是一套综合多种技术指标的趋势交易策略体系。主要包含以下指标:
基准线(Kijun Sen):代表市场趋势方向,是过去26天高点和低点的中点,可作为支持和阻力线。当收盘价突破基准线时,产生买入和卖出信号。
转换线(Tenkan Sen):代表股价的动量,是过去9天高点和低点的中点,可用来判断买入卖出的时机。
未来SPAN A:代表一目均线的中期线,是基准线和转换线的平均值,可作为一目均线的警戒线。
未来SPAN B:代表长期趋势线,是过去52天的中点,可构成云图,判断长短期趋势。
除此之外,该策略还结合RSI指标,在超买超卖区域发出交易信号。
当收盘价突破基准线,并且位于云图之上时产生买入信号;而当收盘价跌破基准线,并且位于云图之下时产生卖出信号。
-
一目均线系统判断趋势准确,胜率较高
-
结合多种指标,避免错失机会
-
RSI指标可有效判断反转点
-
云图直观显示长短期趋势
-
一目均线系统较为滞后,需要配合其他指标判断
-
趋势市场效果好,但震荡市场表现一般
-
RSI参数设置需要根据市场调整
-
云图构造较复杂,需熟练运用
可以通过调整一目均线参数,或结合更多技术指标优化。
-
优化一目均线的参数,使其能更快判断趋势
-
增加移动平均线等指标,提高信号准确性
-
根据不同市场调整RSI的参数设置
-
可以考虑加入止损机制,控制风险
该策略综合运用一目均线、RSI等多个指标judgment趋势,在判断上升趋势准确性较高。但一目均线系统较为滞后,无法判断震荡,这是该策略的主要风险。通过优化参数设置,或增加其他指标可以很好弥补这一缺陷,使策略更加稳定可靠。
||
This strategy is called "Ichimoku Kinko Hyo Strategy". It is a BTC trading strategy based on Ichimoku Kinko Hyo system combined with other technical indicators.
The strategy is mainly based on Ichimoku Kinko Hyo system, which incorporates multiple technical indicators for trend trading. The main components are:
Kijun Sen: Represents market trend direction. It's the midpoint of highest and lowest price over past 26 days, acts as support and resistance lines. Buy and sell signals are generated when close price crosses Kijun Sen.
Tenkan Sen: Represents momentum of the price. It's the midpoint of highest and lowest price over past 9 days, helps determine best entry and exit spots.
Senkou Span A: Represents Ichimoku's mid-term line. It's the average of Kijun Sen and Tenkan Sen, acts as Ichimoku's warning line.
Senkou Span B: Represents long term trend line. It's the midpoint of past 52 days. Forms the Ichimoku cloud to determine long and short term trends.
In addition, the strategy also incorporates the RSI indicator to generate trading signals in overbought and oversold zones.
Buy signals are generated when close price breaks above Kijun Sen and locates above the cloud. Sell signals are generated when close price breaks below Kijun Sen and locates below the cloud.
-
Ichimoku system accurately determines trends with relatively high winning rate.
-
Incorporation of multiple indicators avoids missing opportunities.
-
RSI effectively determines reversal spots.
-
Cloud intuitively presents long and short term trends.
-
Ichimoku system has certain lagging, needs incorporation of other indicators.
-
Works very well in trending markets but modestly in ranging markets.
-
RSI parameters need adjustments based on markets.
-
Cloud construction is complex which requires adept manipulation.
Parameters of Ichimoku can be optimized or more indicators can be added.
-
Optimize parameters of Ichimoku to determine trends quicker.
-
Add more indicators like moving averages to improve signal accuracy.
-
Adjust RSI parameter based on different markets.
-
Consider adding stop loss mechanisms to control risks.
Ichimoku combined with indicators like RSI has high accuracy in capturing upside trends. Lagging of Ichimoku and inadaptability in ranging markets are major risks. Proper parameter tuning and adding more indicators can mitigate these risks substantially, making the strategy more solid and reliable.
[/trans]
Strategy Arguments
| Argument | Default | Description |
|---|---|---|
| v_input_1 | 3 | From Month |
| v_input_2 | true | From Day |
| v_input_3 | 2018 | From Year |
| v_input_4 | true | To Month |
| v_input_5 | true | To Day |
| v_input_6 | 9999 | To Year |
| v_input_7 | 6 | KijunSen Lag |
| v_input_8 | 14 | RSI Length |
Source (PineScript)
/*backtest
start: 2022-12-13 00:00:00
end: 2023-12-19 00:00:00
period: 1d
basePeriod: 1h
exchanges: [{"eid":"Futures_Binance","currency":"BTC_USDT"}]
*/

//@version=3
strategy("My Ichimoku Strat v2", overlay=true,default_qty_type=strategy.fixed, default_qty_value=1, initial_capital=1000, currency=currency.EUR,commission_type=strategy.commission.percent,commission_value=0.05)
// === BACKTEST RANGE ===
FromMonth = input(defval = 3, title = "From Month", minval = 1)
FromDay   = input(defval = 1, title = "From Day", minval = 1)
FromYear  = input(defval = 2018, title = "From Year", minval = 2014)
ToMonth   = input(defval = 1, title = "To Month", minval = 1)
ToDay     = input(defval = 1, title = "To Day", minval = 1)
ToYear    = input(defval = 9999, title = "To Year", minval = 2014)

// === SERIES SETUP ===


//**** Inputs *******
KijunSenLag = input(6,title="KijunSen Lag",minval=1)

//Kijun-sen
//Support resistance line, buy signal when price crosses it
KijunSen = sma((high+low)/2,26)
buy2 = crossover(close,KijunSen) and (rising(KijunSen,KijunSenLag) or falling(KijunSen,KijunSenLag))
sell2= crossunder(close,KijunSen) and (rising(KijunSen,KijunSenLag) or falling(KijunSen,KijunSenLag))


//Tenkan-Sen
TenkanSen = sma((high+low)/2,9)

//Senkou Span A
SenkouSpanA = (KijunSen + TenkanSen)/2

//Senkou Span B
SenkouSpanB = sma((high+low)/2,52)

//Cloud conditions : ignore buy if price is under the cloud
// Huge cloud means safe support and resistance. Little cloud means danger.
buy3 = close > SenkouSpanA and close > SenkouSpanB
sell3 = close < SenkouSpanA and close < SenkouSpanB


//Chikou Span
//Buy signal : crossover(ChikouSpan,close)
//Sell Signal : crossunder(ChikouSpan,close)
ChikouSpan = close
buy1=crossover(ChikouSpan,close[26])
sell1=crossunder(ChikouSpan,close[26])

plotshape(buy1,style=shape.diamond,color=lime,size=size.small)
plotshape(sell1,style=shape.diamond,color=orange,size=size.small)

//Alerts

buyCompteur = -1
buyCompteur := nz(buyCompteur[1],-1)
buyCompteur := buy2 or buy3 ? 1 : buyCompteur
buyCompteur := buyCompteur > 0 ? buyCompteur + 1 : buyCompteur
buyCompteur := sell2 or sell3 ? -1 : buyCompteur

sellCompteur = -1
sellCompteur := nz(sellCompteur[1],-1)
sellCompteur := sell2 or sell3 ? 1 : sellCompteur
sellCompteur := sellCompteur > 0 ? sellCompteur + 1 : sellCompteur
sellCompteur := buy2 or buy3 ? -1 : sellCompteur


//RSI
src = close, len = input(14, minval=1, title="RSI Length")
up = rma(max(change(src), 0), len)
down = rma(-min(change(src), 0), len)
rsi = down == 0 ? 100 : up == 0 ? 0 : 100 - (100 / (1 + up / down))
buyRSI = crossover(rsi,40) and close > TenkanSen and rsi[5]<30 and (rsi-rsi[1])>5
sellRSI = crossunder(rsi,60) and close < TenkanSen and rsi[5]>70 and (rsi[1]-rsi)>5
plotshape(buyRSI,style=shape.triangleup,color=lime,transp=0,location=location.belowbar,size=size.small)

sell= sell2 and sell3 or (sell1 and buyCompteur <= 8) or sellRSI
buy=buy2 and buy3 or (buy1 and sellCompteur <=8) or buyRSI
plotchar(buy,char='B',size=size.small,color=lime)
plotchar(sell,char='S',size=size.small,color=orange)


//plots
plot(KijunSen,title="Kijun-Sen",color=blue,linewidth=4)
plot(TenkanSen,title="Tenkan-Sen",color=red,linewidth=2)
cloudA = plot(SenkouSpanA,title="cloud A", color=lime,offset=26,linewidth=2)
cloudB = plot(SenkouSpanB,title="cloud B", color=orange,offset=26,linewidth=2)
plot(ChikouSpan,title="lag span",color=fuchsia, linewidth=2,offset=-26)
//plot()
fill(cloudA,cloudB,color=SenkouSpanA>SenkouSpanB?lime:orange)
//plot(close,color=silver,linewidth=4)

// === ALERTS ===
strategy.entry("L", strategy.long, when=(buy and (time > timestamp(FromYear, FromMonth, FromDay, 00, 00)) and (time < timestamp(ToYear, ToMonth, ToDay, 23, 59))))
strategy.close("L", when=(sell and (time < timestamp(ToYear, ToMonth, ToDay, 23, 59))))
Detail
https://www.fmz.com/strategy/435948
Last Modified
2023-12-20 13:34:08
