Name
基于不同周期的移动平均线交叉策略Moving-Average-Crossover-Strategy
Author
ChaoZhang
Strategy Description
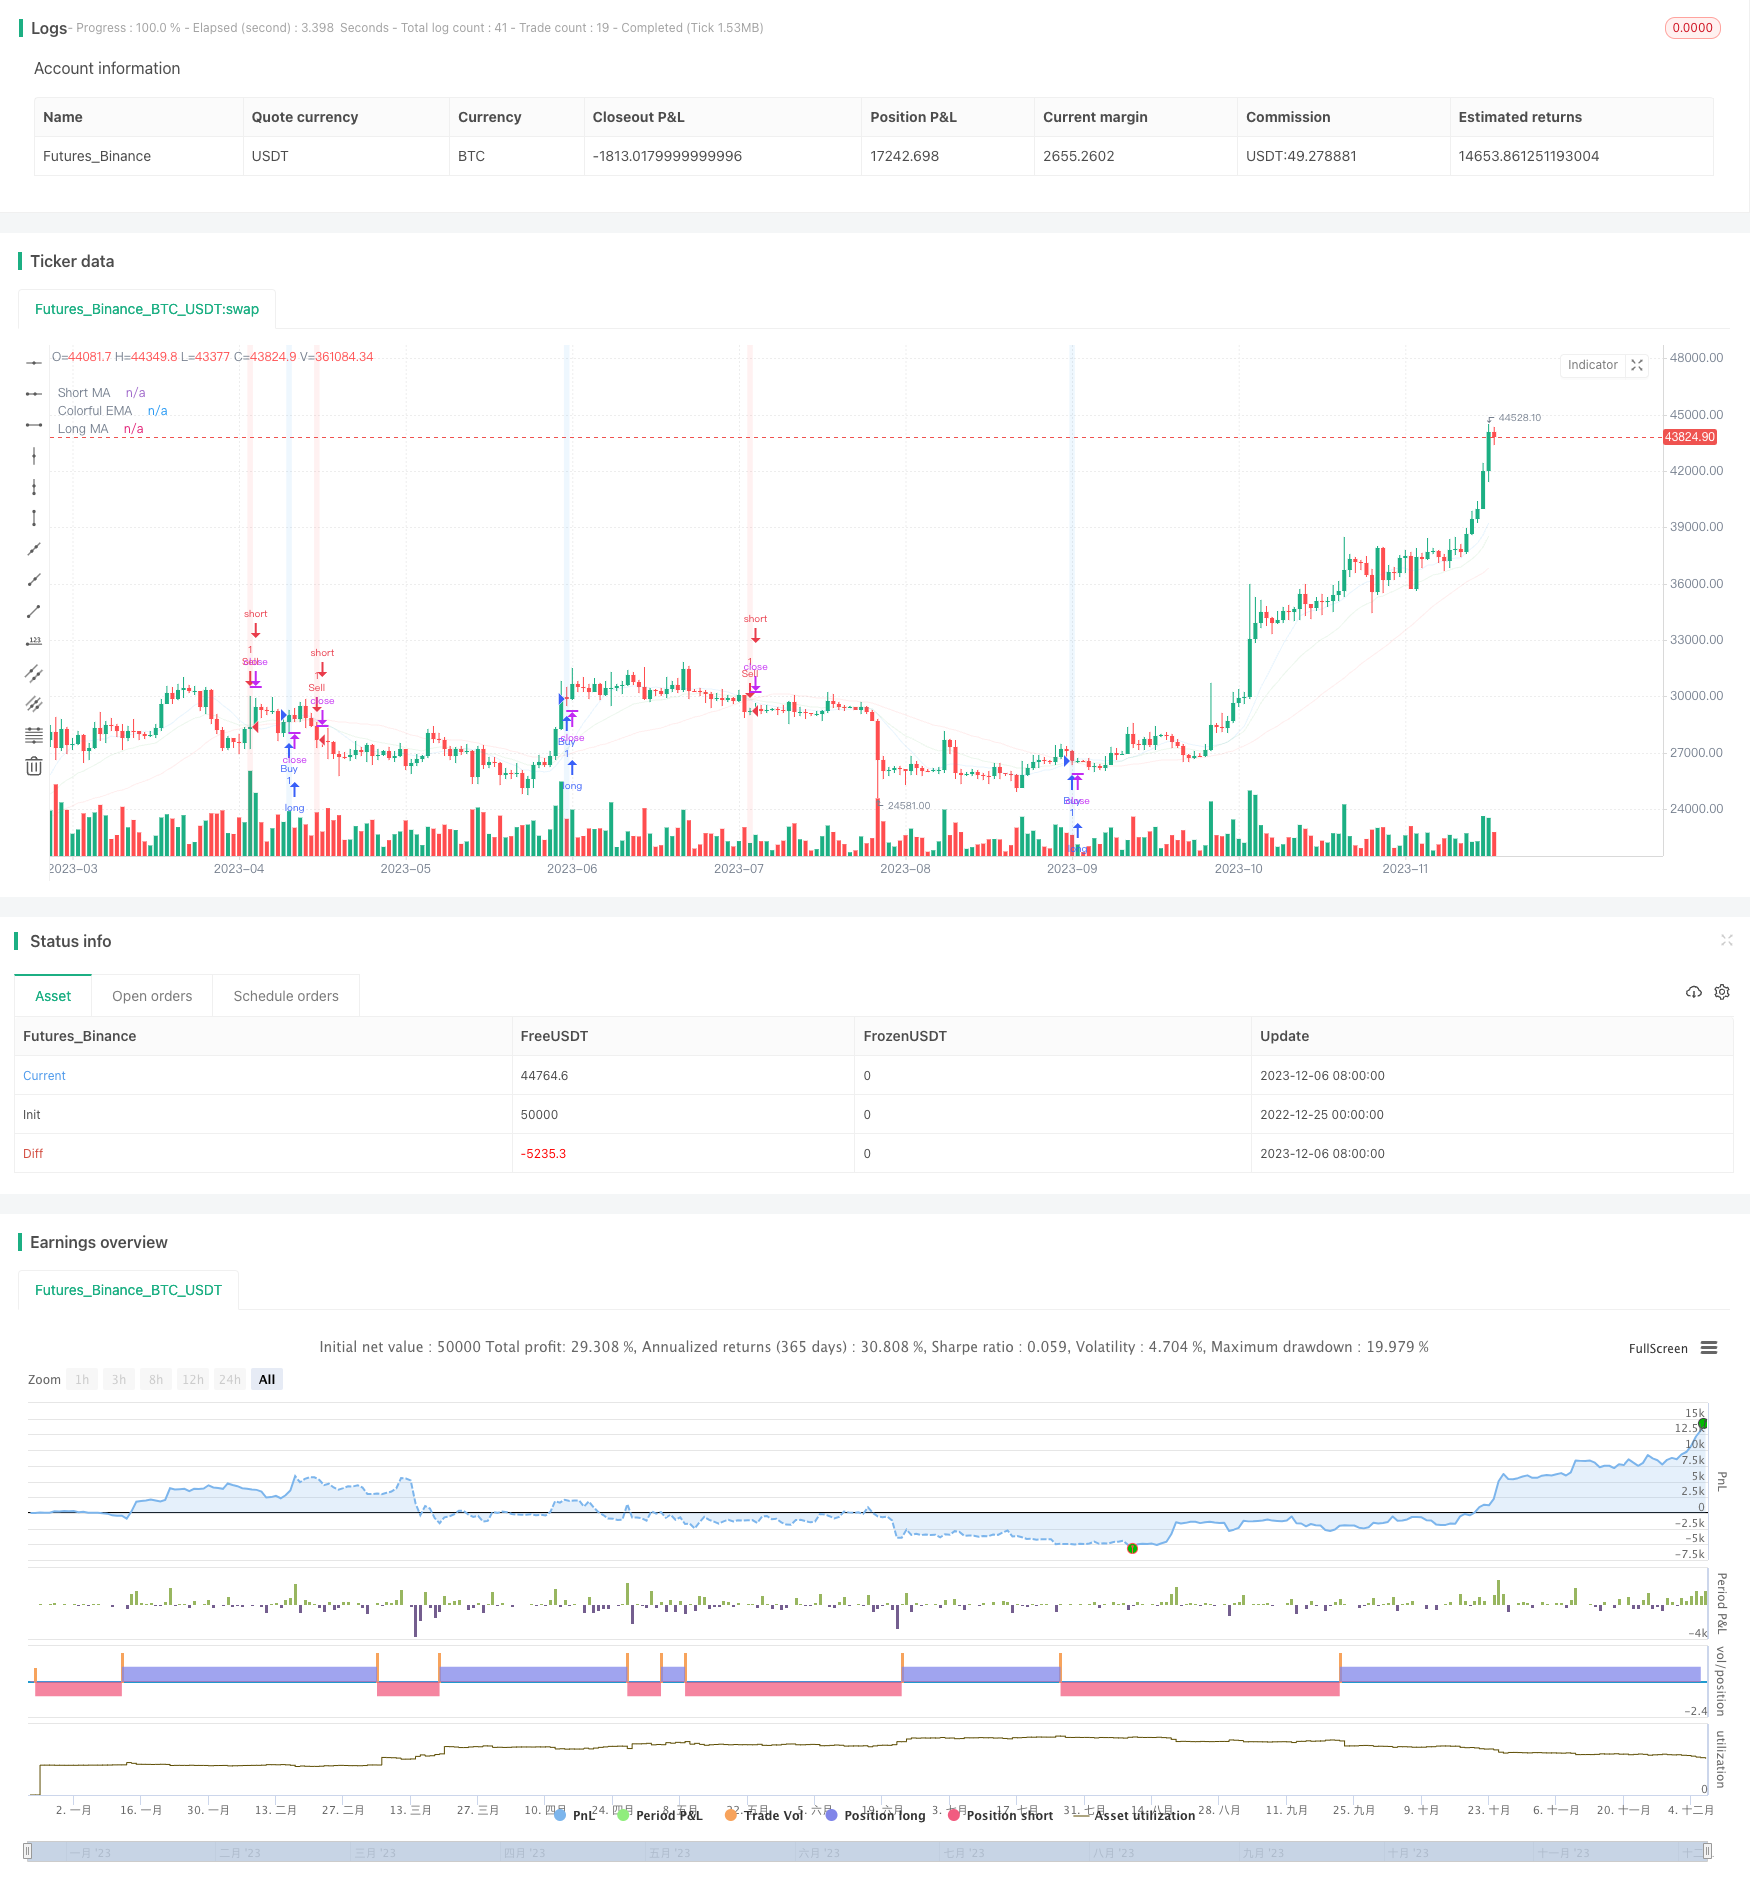
移动平均线交叉策略是一种基于移动平均线的timing策略。它通过计算不同周期的移动平均线,判断其交叉情况,产生买入和卖出信号。该策略同时结合了指数移动平均线作为辅助判断指标,进一步提高信号的准确性。
该策略的核心逻辑基于两个移动平均线的交叉情况。具体来说,分别计算n日简单移动平均线(short MA)和m日简单移动平均线(long MA)。当short MA从下向上突破long MA时,产生买入信号;当short MA从上向下跌砪long MA时,产生卖出信号。这反映了短期趋势对长期趋势的洗涤和修正。
此外,该策略还引入了x日指数移动平均线(EMA)作为辅助指标。EMA相比SMA更为流畅,能更快速地体现价格变化趋势。它的辅助作用在于,只有当短期EMA也确认了移动平均线交叉信号时,才会触发实际的交易信号。这避免了部分虚假信号的干扰,提高了交易策略的稳定性。
移动平均线交叉策略具有以下优势:
-
简单易用。该策略仅仅依赖两个移动平均线的交叉情况,非常简单,容易理解和实施。
-
直观形象。移动平均线能清晰地反映市场趋势,其交叉情况也十分直观,无需复杂计算。
-
历史悠久。移动平均线策略可以追溯到上世纪初,经历了百年的市场考验,已成为技术分析的经典工具之一。
-
风险可控。通过调整移动平均线的天数参数,可以控制交易信号的频繁程度,进而控制风险。
-
通用灵活。移动平均线交叉策略适用于多种品种和多种时间周期,是一种非常通用和灵活的交易策略。
该策略也存在一些风险:
-
仓位切换频繁。当市场震荡起伏时,移动平均线可能频繁交叉,导致换仓过于頻繁。
-
产生延迟。移动平均线本身承载一定滞后性,特别是长周期均线,可能错过短期交易机会。
-
需调参优化。不同品种和时间周期下,移动平均线参数需要独立测试和优化,否则效果可能不佳。
-
可配合其他指标。单一的移动平均线策略效果并非最佳,往往需要辅助其他技术指标过滤信号。
该策略可从以下几个方面进行优化:
-
调整移动平均线参数,适应不同周期。可以测试不同的短期长期均线参数组合,找到最佳参数。
-
增加成交量的辅助判断。例如设置成交量突破指标,避免无效信号。
-
增加波动率指标的判断。例如KDJ,MACD等判断市场实际走势,过滤不确定信号。
-
结合企业基本面。根据业绩预期等调整参数,使策略更具前瞻性。
-
策略组合化运用。与其他策略或模型组合使用,发挥协同效应。
移动平均线交叉策略通过简单的均线交叉原理实现交易信号的生成。它直观易懂,参数调节灵活,风险可控,是一种实用性很强的timing策略。但其本身也存在一定的滞后性与频繁切换风险。因此,该策略可以通过多种方式进行优化与组合,从而发挥更大效用。它已成为量化交易中一种简单有效的基础策略。
||
The moving average crossover strategy is a timing strategy based on moving averages. It generates buy and sell signals by calculating different period moving averages and judging their crossover. This strategy also combines the exponential moving average as an auxiliary indicator to further improve the accuracy of signals.
The core logic of this strategy is based on the crossover between two moving averages. Specifically, it calculates the n-day simple moving average (short MA) and the m-day simple moving average (long MA). When the short MA breaks through the long MA from bottom to top, a buy signal is generated. When the short MA breaks through the long MA from top to bottom, a sell signal is generated. This reflects the wash and correction of short-term trends on long-term trends.
In addition, this strategy also introduces the x-day exponential moving average (EMA) as an auxiliary indicator. Compared with SMA, EMA is smoother and can reflect price changes faster. Its auxiliary effect is that only when the short-term EMA also confirms the moving average crossover signal, the actual trading signal will be triggered. This avoids some interference from false signals and improves the stability of trading strategies.
The moving average crossover strategy has the following advantages:
-
Simple and easy to use. This strategy relies solely on the crossover between two moving averages, which is very simple, easy to understand and implement.
-
Intuitive and vivid. Moving averages can clearly reflect market trends, and their crossover is also very intuitive without complex calculations.
-
Long history. Moving average strategies can be traced back to the early 20th century and have undergone 100 years of market test to become one of the classic technical analysis tools.
-
Controllable risks. By adjusting the moving average parameters, you can control the frequency of trading signals and thus control risks.
-
Universal and flexible. The moving average crossover strategy is suitable for various products and time cycles, making it a very versatile and flexible trading strategy.
This strategy also has some risks:
-
Frequent position switching. When the market fluctuates sharply, the moving averages may frequently crossover, resulting in over-frequent position switching.
-
Lagging effects. The moving average itself carries a certain lag, especially long-cycle moving averages, which may miss short-term trading opportunities.
-
Parameter optimization needed. For different products and time cycles, the parameters of the moving averages need to be independently tested and optimized, otherwise the results may be poor.
-
Can be combined with other indicators. A single moving average strategy is not the best performing. It often requires other technical indicators to filter out signals.
This strategy can be optimized in the following aspects:
-
Adjust moving average parameters to adapt to different cycles. Different combinations of short-term and long-term moving averages can be tested to find the optimal parameters.
-
Add auxiliary judgment of trading volume. For example, set up indicators for breaking through trading volume to avoid invalid signals.
-
Add volatility indicators for judgment. For example, KDJ and MACD can judge the actual market trend and filter uncertain signals.
-
Combine fundamentals. Adjust parameters based on earnings expectations to make strategies more forward-looking.
-
Portfolio application of strategies. Use with other strategies or models to achieve synergistic effects.
The moving average crossover strategy generates trading signals through the simple principle of moving average crossover. It is intuitive, easy to understand, flexible in parameter adjustment and risk controllable. But it also has inherent lagging properties and risks of over-frequent position switching. Therefore, this strategy can be optimized and combined in various ways to maximize its utility. It has become a simple and effective basic strategy in quantitative trading.
[/trans]
Strategy Arguments
| Argument | Default | Description |
|---|---|---|
| v_input_1 | 10 | Short MA Length |
| v_input_2 | 40 | Long MA Length |
| v_input_3 | 20 | EMA Length |
Source (PineScript)
/*backtest
start: 2022-12-25 00:00:00
end: 2023-12-07 05:20:00
period: 1d
basePeriod: 1h
exchanges: [{"eid":"Futures_Binance","currency":"BTC_USDT"}]
*/

//@version=5
strategy("MA Crossover Strategy", overlay=true)

// Define input parameters
shortLength = input(10, title="Short MA Length")
longLength = input(40, title="Long MA Length")
emaLength = input(20, title="EMA Length")

// Calculate moving averages
shortMA = ta.sma(close, shortLength)
longMA = ta.sma(close, longLength)
colorfulEMA = ta.ema(close, emaLength)

// Create buy and sell conditions
buyCondition = ta.crossover(shortMA, longMA)
sellCondition = ta.crossunder(shortMA, longMA)

// Execute buy and sell orders
if (buyCondition)
    strategy.entry("Buy", strategy.long)
    strategy.close("Sell")

if (sellCondition)
    strategy.entry("Sell", strategy.short)
    strategy.close("Buy")

// Color the background based on buy and sell conditions
bgcolor(buyCondition ? color.new(color.blue, 90) : na)
bgcolor(sellCondition ? color.new(color.red, 90) : na)

// Plot moving averages
plot(shortMA, color=color.new(color.blue, 90), title="Short MA")
plot(longMA, color=color.new(color.red, 90), title="Long MA")

// Plot colorful EMA with transparency
plot(colorfulEMA, color=color.new(color.green, 90), title="Colorful EMA")
Detail
https://www.fmz.com/strategy/436617
Last Modified
2023-12-26 12:04:34
