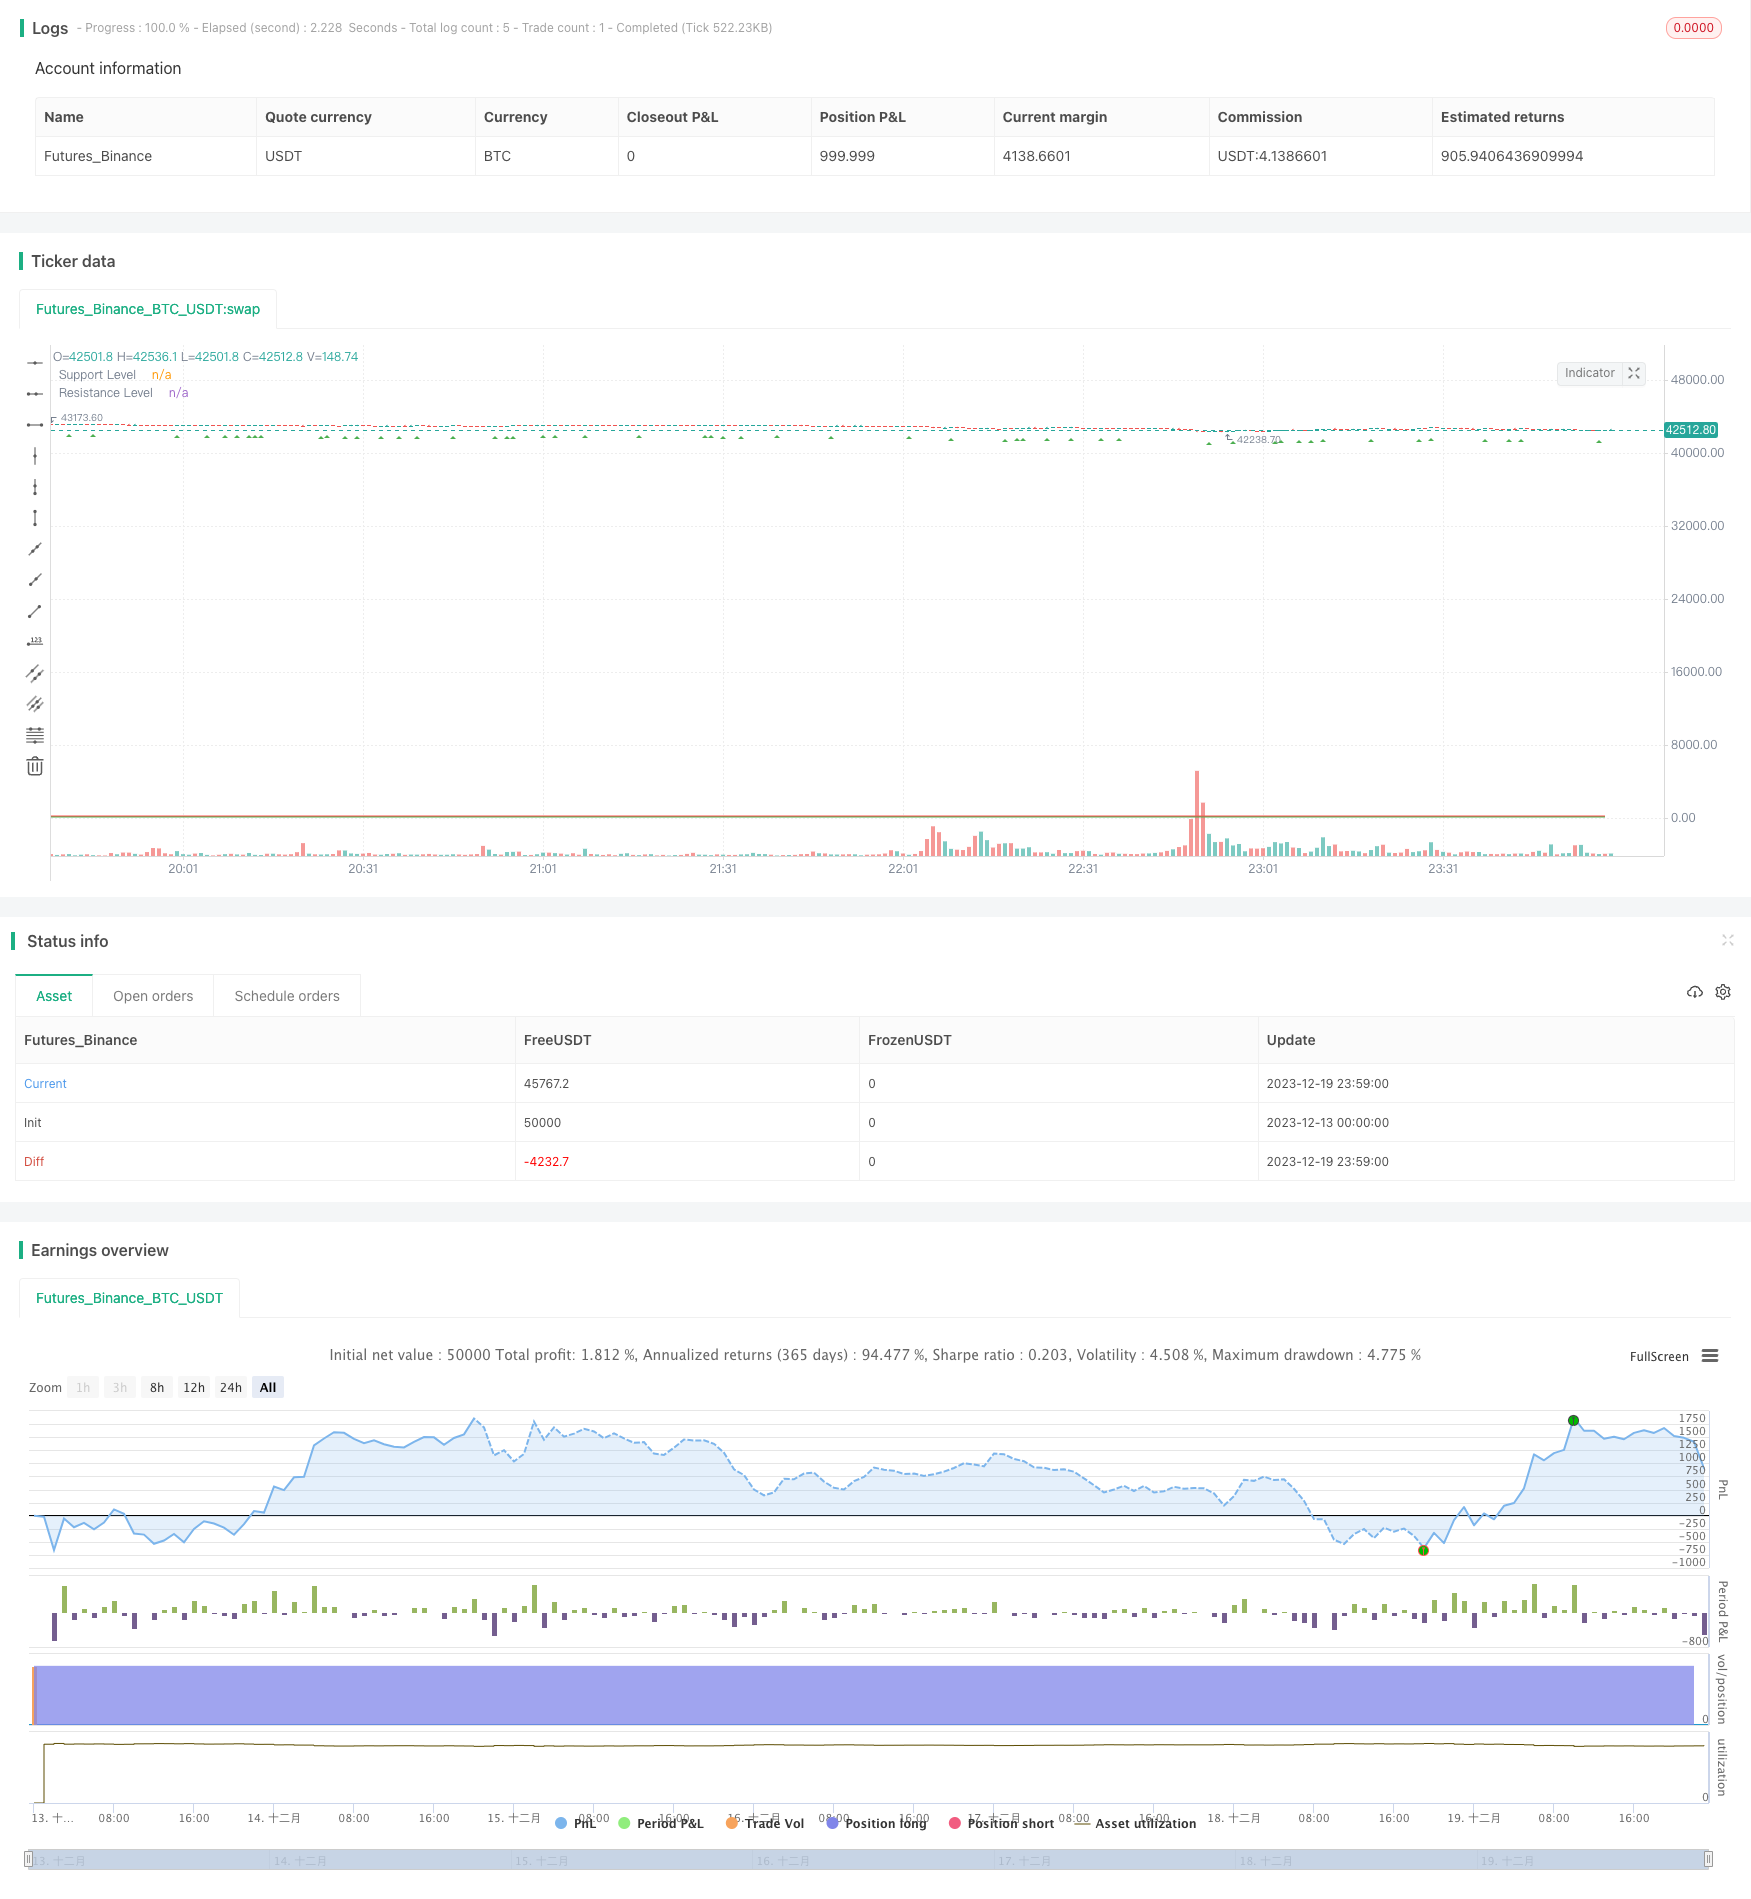
Name
基于互动模式的K线交易策略-Interactive-Model-Based-Candlestick-Trading-Strategy
Author
ChaoZhang
Strategy Description
本策略基于K线的形态和互动模式来判断买入和卖出信号。主要利用突破支撑和阻力进行交易,同时结合一定的K线形态来辅助决策。
本策略主要判断以下几种K线形态:
- 小阳线:收盘价高于开盘价,实体部分较短
- 倒锤头:开盘价接近最高价,收盘价接近最低价
- 十字星:前一根K线与当前K线形成十字交叉
在判断K线形态的同时,本策略还设置了支撑位和阻力位。具体逻辑是:
- 当出现小阳线,且收盘价高于阻力位时,产生买入信号
- 当出现倒锤头,且收盘价低于支撑位时,产生卖出信号
通过这样的组合判断,可以过滤掉一些错误信号,使交易决策更加可靠。
本策略具有以下几个优势:
- 结合图形形态和数值指标,使交易信号更加可靠
- 支撑阻力位的设置避免了无谓的反复交易
- K线形态判断相对简单,容易理解实现
- 可自定义参数,适应不同市场环境
总的来说,本策略较为简单实用,适合用来检验交易想法,也可以用来辅助人工交易。
本策略也存在一些风险:
- K线形态判断并不完全可靠,可能出现误判
- 支撑阻力位设置不当也会影响策略效果
- 无法处理异常行情,如重大恶性事件造成的大幅波动
- 回测数据不足,可能高估了策略效果
对策主要是严格检验参数设定,调整支撑阻力位,并配合止损来控制风险。同时,必须在大量历史数据上进行回测,才能评估策略的实际效果。
本策略主要可以从以下几个方面进行优化:
- 增加其他类型K线形态判断,丰富交易信号
- 优化支撑阻力位的计算方法,使其更加顺应市场走势
- 加入离均线距离、交易量变化等指数指标来辅助决策
- 增加机器学习算法,利用大数据自主判断图形特征
通过这些优化,可以使策略参数更加自动化、交易决策更加智能化,适应更加复杂的市场环境。
本策略整体来说较为简单实用,特别适合个人交易者检验想法以及辅助决策。结合K线形态和支撑阻力判断产生交易信号,可以有效过滤误判。通过一定优化,本策略可以成为一个相对可靠的量化交易系统。
||
This strategy generates buy and sell signals based on candlestick patterns and interactive models. It mainly utilizes breakouts of support and resistance levels along with certain candlestick formations to assist in decision making.
The strategy primarily identifies the following candlestick patterns:
- Bullish Marubozu: Close higher than open with short real body
- Inverted Hammer: Open near high and close near low
- Doji Star: Previous candle crosses current doji candle
In conjunction with pattern recognition, support and resistance levels are set. The specific logic is:
- When a Bullish Marubozu appears above resistance level, a buy signal is generated
- When an Inverted Hammer appears below support level, a sell signal is triggered
This combination filtering helps avoid false signals and makes the trading decisions more reliable.
The advantages of this strategy are:
- Combines chart patterns and indicators for more robust signals
- Support/Resistance levels avoid unnecessary whipsaws
- Candlestick patterns are simple to understand and implement
- Customizable parameters suit different market environments
Overall, the strategy is relatively simple and practical for testing ideas and assisting manual trading.
There are also some risks:
- Candlestick patterns can be misleading resulting in bad signals
- Poor support/resistance levels negatively impact performance
- Unable to handle black swan events and huge volatility
- Insufficient backtest data leading to overestimated results
Mitigations mainly involve strict parameter checking, support/resistance tuning, and incorporating stop losses to control risk. Additionally, extensive historical data backtesting is required to properly evaluate the actual strategy performance.
Some ways the strategy can be enhanced:
- Incorporate more candlestick pattern detections for more trade signals
- Optimize support/resistance calculation methods to better fit market trends
- Add secondary indicators like moving average distance, volume changes to supplement decisions
- Introduce machine learning to autonomously determine chart pattern features
These improvements can help automate strategy tuning and make trade decisions more intelligent to handle increasingly complex markets.
Overall this is a simple, practical strategy well-suited for individual traders to test ideas and assist with decisions. Trading signals are generated by combining candlestick patterns and support/resistance analysis to effectively filter out false signals. With some enhancements, this strategy can become a relatively reliable quantitative system.
[/trans]
Strategy Arguments
| Argument | Default | Description |
|---|---|---|
| v_input_1 | 100 | Support Level |
| v_input_2 | 200 | Resistance Level |
Source (PineScript)
/*backtest
start: 2023-12-13 00:00:00
end: 2023-12-20 00:00:00
period: 1m
basePeriod: 1m
exchanges: [{"eid":"Futures_Binance","currency":"BTC_USDT"}]
*/

//@version=5
strategy("Candlestick Pattern Strategy", overlay=true)

// Input for support and resistance levels
supportLevel = input(100, title="Support Level")
resistanceLevel = input(200, title="Resistance Level")

// Detecting Candlestick Patterns
isDoji = close == open
isPressure = close < open and open - close > close - open
isInvertedHammer = close > open and low == (close < open ? close : open) and close - open < 0.1 * (high - low)
isHammer = close > open and close - open > 0.6 * (high - low)

// Buy and Sell Conditions
buyCondition = isHammer and close > resistanceLevel
sellCondition = isInvertedHammer and close < supportLevel

// Strategy Logic
strategy.entry("Buy", strategy.long, when = buyCondition)
strategy.close("Buy", when = sellCondition)

// Plot Buy and Sell signals on the chart
plotshape(series=buyCondition, title="Buy Signal", color=color.green, style=shape.triangleup, location=location.belowbar)
plotshape(series=sellCondition, title="Sell Signal", color=color.red, style=shape.triangledown, location=location.abovebar)

// Plot Support and Resistance levels
plot(supportLevel, color=color.green, title="Support Level")
plot(resistanceLevel, color=color.red, title="Resistance Level")
Detail
https://www.fmz.com/strategy/436093
Last Modified
2023-12-21 10:55:06
