Name
基于交易量强弱的趋势跟踪策略Volume-Flow-Indicator-Based-Trend-Following-Strategy
Author
ChaoZhang
Strategy Description
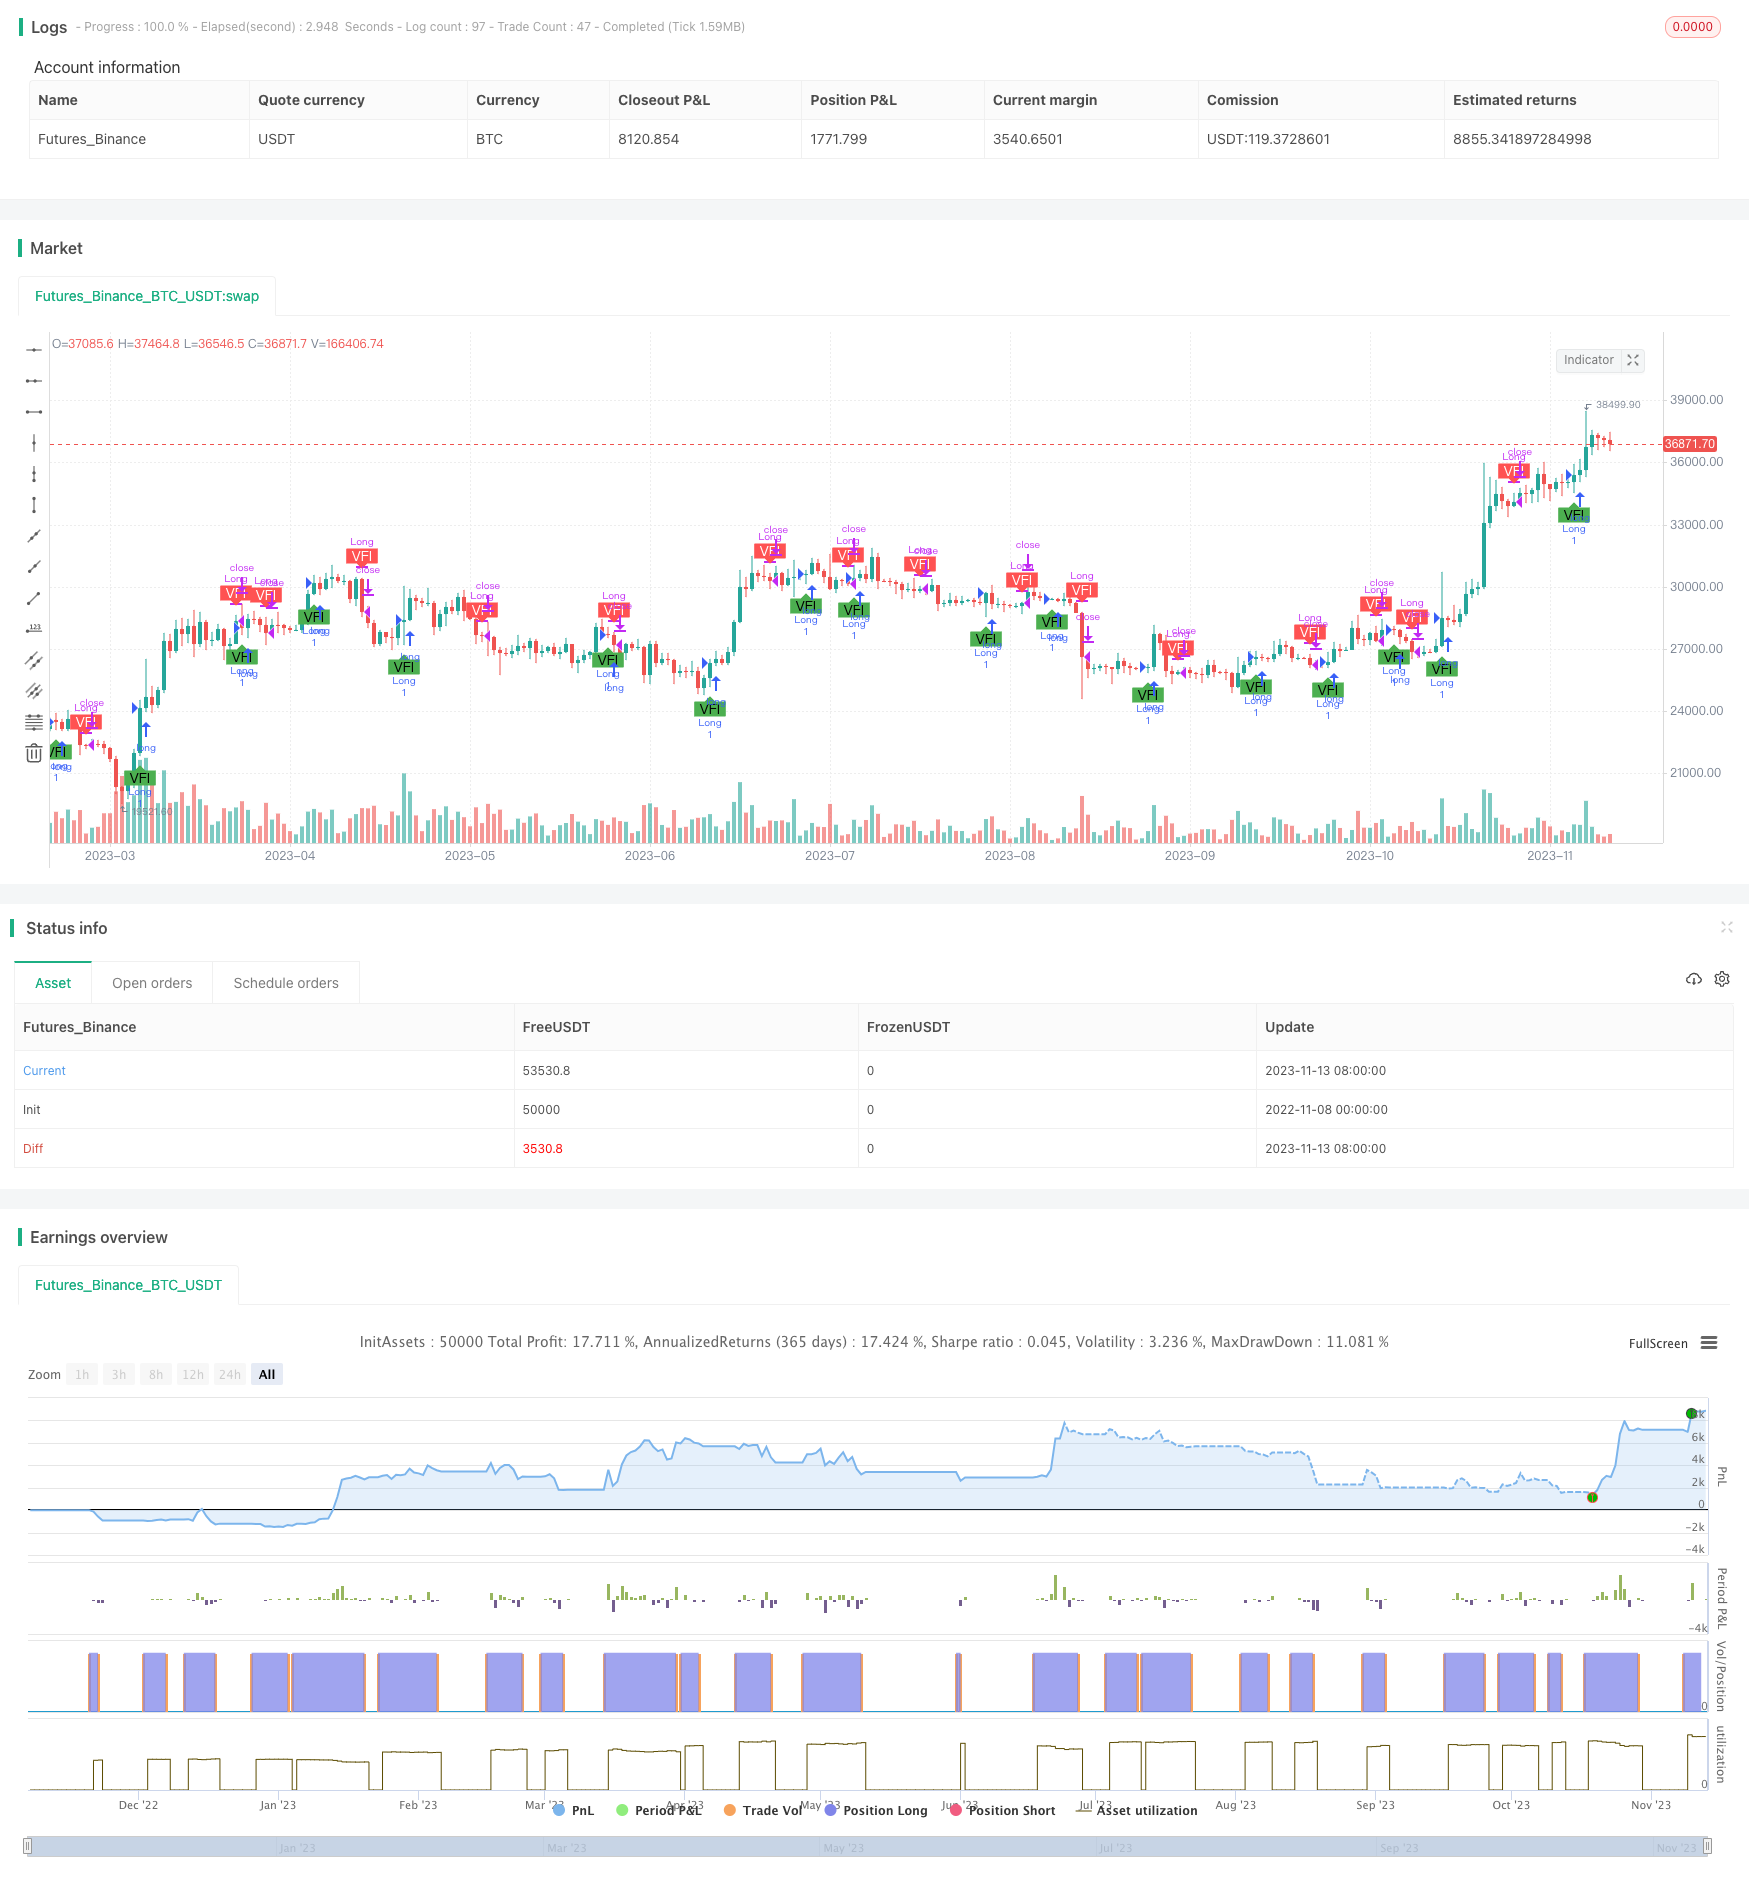
本策略通过计算交易量变化情况,判断市场趋势方向,采用趋势跟踪方式,在趋势开始阶段建立仓位,在趋势结束时平仓止损。
- 计算典型价格typical,对数收益率inter,收益率方差vinter
- 计算交易量平均值vave,最大交易量阈值vmax
- 计算价格变化量mf,与方差阈值cutoff比较,计算出价格驱动量vcp
- 汇总vcp得到量价指标vfi,分别计算vfi和其均线vfima
- 比较vfi和vfima大小,得到量价指标差值dVFI,以判定趋势方向
- 当dVFI上穿0时为看涨信号,下穿0时为看跌信号
- 根据dVFI形态,建立做多做空策略
- 该策略充分考虑了交易量变化对趋势判断的影响,通过动量指标衡量趋势强弱,可以更准确地捕捉趋势转折点。
- 策略加入交易量阈值计算,可以过滤正常波动,只捕捉大资金的集体行为,避免被市场噪音误导。
- 量价联动判断,综合考量价格与成交量,可以有效避免假突破。
- 采用均线过滤和逻辑判断,可以过滤掉大部分假信号。
- 跟踪趋势而非预测反转,非常适合中长线趋势交易,有利于把握市场主要方向。
- 该策略主要依赖交易量变化来判断趋势,在交易量不活跃的品种中效果会打折扣。
- 交易量数据容易被操纵,可能产生误导性信号,需要防范量价背离的情况。
- 量价关系经常有滞后,可能错过趋势开始的最佳入场时机。
- 粗放的止损方式可能会过早止损,无法持续捕捉趋势。
- 无法有效响应短期调整,对突发事件也可能反应不敏感。
可以考虑加入均线系统、波动率指标等来优化入场和止损;结合更多数据源分析量价关系,防范误导信号;加入适当技术指标提升对短期调整的响应。
-
优化入场条件,可以考虑加入均线、자세오극점等判断,在趋势开始后确定入场。
-
优化止损方式,可以设定移动止损、级别止损等,让止损更贴近价格,跟踪趋势停止。
-
加入趋势判断环节,如ADX,可以避免横盘和震荡市场的错误交易。
-
优化参数设置,可以通过更长的数据回测寻找最优参数组合。
-
将策略扩展到更多品种,寻找质量更好、交易量更活跃的品种。
-
考虑加入机器学习模型,利用更多数据进行量价关系判断,提升信号质量。
本策略整体思路清晰,核心指标直观易懂,可靠地识别趋势方向。策略优势在于强调交易量变化,适合追踪中长线趋势,但需防范误导信号。通过参数优化、止损方式改进、指标优化组合等方面进行改进,可以进一步增强策略的实盘表现。
||
This strategy judges market trend direction by calculating changes in trading volume, and adopts a trend following approach by establishing positions at the beginning of trends and closing positions when trends end.
- Calculate typical price typical, logarithmic return inter, and return variance vinter
- Calculate average trading volume vave, maximum trading volume threshold vmax
- Calculate price change mf, compare with variance threshold cutoff to get price driven momentum vcp
- Sum vcp to get volume price indicator vfi, calculate vfi and its moving average vfima
- Compare vfi with vfima to get the difference dVFI and determine trend direction
- When dVFI crosses above 0, it is a bullish signal, and when crossing below 0, it is a bearish signal
- Establish long and short strategies based on dVFI patterns
-
The strategy fully considers the impact of trading volume changes on trend judgment, using momentum indicators to measure trend strength and more accurately capture trend turning points.
-
The strategy incorporates trading volume threshold calculation to filter normal fluctuations and only capture collective behavior of large funds, avoiding being misled by market noise.
-
The combined consideration of price and volume can effectively avoid false breakouts.
-
The use of moving averages and logical criteria filters out most false signals.
-
Following trends rather than predicting reversals is well suited for medium-to-long term trend trading and capturing the market's main direction.
-
The strategy relies mainly on trading volume changes to determine trends, and its effectiveness may be compromised in products with inactive trading volume.
-
Trading volume data can be manipulated, potentially generating misleading signals, so price-volume divergences need to be watched out for.
-
Price-volume relationships are often lagging, potentially missing the optimal entry timing at the beginning of trends.
-
Crude stop loss methods may prematurely exit trades, unable to persistently capture trends.
-
Unable to respond effectively to short-term corrections, and may be insensitive to sudden events.
Consider incorporating moving averages, volatility indicators to optimize entries and stops; analyzing price-volume with more data sources to avoid misleading signals; incorporating appropriate technical indicators to improve responsiveness to short-term corrections.
-
Optimize entry conditions by incorporating moving averages, ichimoku kinko hyo etc to confirm entries after trend starts.
-
Optimize stops with trailing stops, staged stops etc to make stops adhere closely to price and track trend stops.
-
Add trend metrics like ADX to avoid incorrect trades in range-bound and choppy markets.
-
Optimize parameters through longer backtests to find optimal parameter combinations.
-
Expand strategy to more products, searching for higher quality instruments with active volume.
-
Consider adding machine learning models to leverage more data for price-volume analysis and improve signal quality.
The overall strategy logic is clear, with intuitive core indicators reliably identifying trend direction. The advantage lies in emphasizing trading volume changes, suitable for tracking medium-to-long term trends, but misleading signals need to be watched out for. Further improvements in parameters, stop losses, indicator combinations can enhance live performance.
[/trans]
Source (PineScript)
/*backtest
start: 2022-11-08 00:00:00
end: 2023-11-14 00:00:00
period: 1d
basePeriod: 1h
exchanges: [{"eid":"Futures_Binance","currency":"BTC_USDT"}]
*/

//@version=4
strategy("Strategy for Volume Flow Indicator with alerts and markers on the chart", overlay=true)
// This indicator has been copied form Lazy Bear's code
lengthVFI = 130
coefVFI = 0.2
vcoefVFI = 2.5
signalLength= 5
smoothVFI=true

ma(x,y) => smoothVFI ? sma(x,y) : x

typical=hlc3
inter = log( typical ) - log( typical[1] )
vinter = stdev(inter, 30 )
cutoff = coefVFI * vinter * close
vave = sma( volume, lengthVFI )[1]
vmax = vave * vcoefVFI
vc = iff(volume < vmax, volume, vmax)
mf = typical - typical[1]
vcp = iff( mf > cutoff, vc, iff ( mf < -cutoff, -vc, 0 ) )

vfi = ma(sum( vcp , lengthVFI )/vave, 3)
vfima=ema( vfi, signalLength )
dVFI=vfi-vfima

bullishVFI = dVFI > 0 and dVFI[1] <=0
bearishVFI =  dVFI < 0 and dVFI[1] >=0

longCondition = dVFI > 0 and dVFI[1] <=0
shortCondition = dVFI < 0 and dVFI[1] >=0

plotshape(bullishVFI, color=color.green, style=shape.labelup, textcolor=#000000, text="VFI", location=location.belowbar, transp=0)
plotshape(bearishVFI, color=color.red, style=shape.labeldown, textcolor=#ffffff,  text="VFI", location=location.abovebar, transp=0)

alertcondition(bullishVFI, title='Bullish - Volume Flow Indicator', message='Bullish - Volume Flow Indicator')
alertcondition(bearishVFI, title='Bearish - Volume Flow Indicator', message='Bearish - Volume Flow Indicator')

if(year > 2018)
    strategy.entry("Long", strategy.long, when=dVFI > 0 and dVFI[1] <=0)

if(shortCondition)
    strategy.close(id="Long")
Detail
https://www.fmz.com/strategy/432240
Last Modified
2023-11-15 17:53:51
