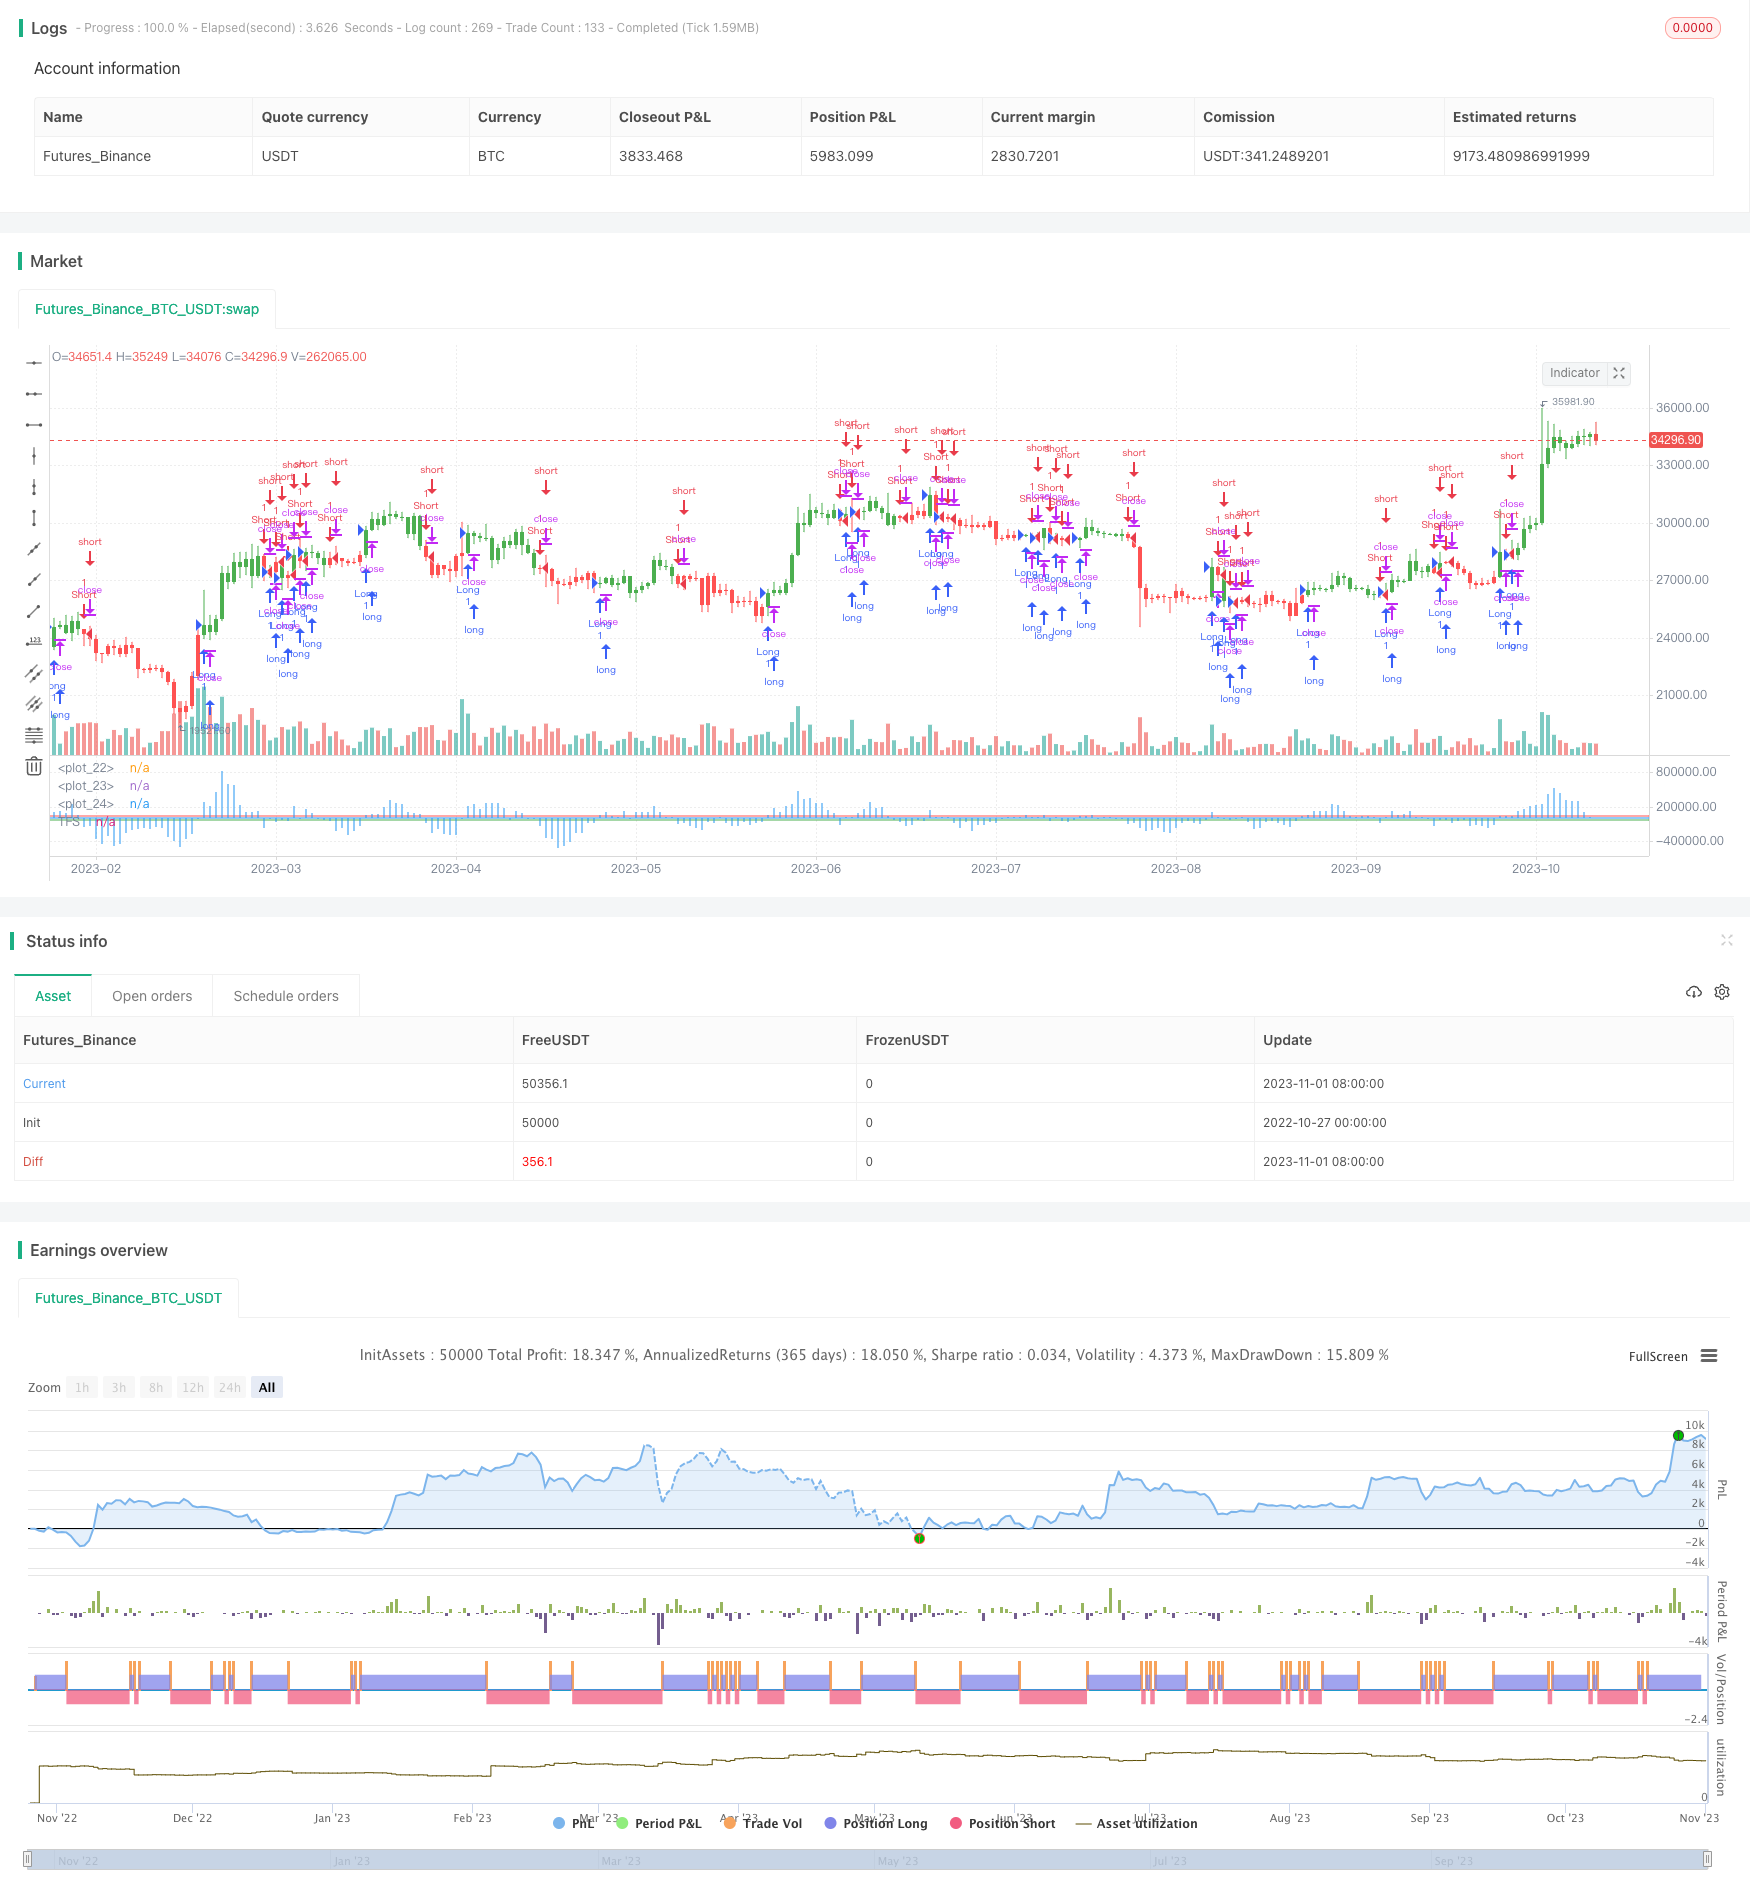
Name
基于交易量的趋势追踪策略Volume-Oscillator-Based-Trend-Tracking-Strategy
Author
ChaoZhang
Strategy Description
基于交易量的趋势追踪策略通过计算交易量的多空比例,判断当前趋势方向,实现追踪趋势交易。该策略受到交易量指标(On-Balance Volume, OBV)的启发,通过计算close与open的关系判断交易量正负,再取N日移动平均构建指标,指标上穿上轨做多,下穿下轨做空。
该策略主要通过以下步骤构建:
-
计算交易量正负:如果收盘价高于开盘价,该根K线的交易量记为正;如果收盘价低于开盘价,该根K线的交易量记为负;如果收盘价等于开盘价,该根K线的交易量记为0。
-
累加N日交易量正负值,得到累积交易量。
-
计算累积交易量的N日移动平均,得到最终指标值。
-
当指标上穿上轨时做多;当指标下穿下轨时做空。
这样通过交易量正负性判断趋势方向,再结合移动平均产生交易信号,可以有效跟踪趋势,捕捉中长线走势。
-
基于交易量判断趋势更有说服力,交易量能反映市场参与者意愿。
-
结合移动平均平滑曲线,有利于跟踪趋势,减少频繁交易。
-
通过调整移动平均天数,可以适应不同周期的市场节奏。
-
通过上下轨组合,可以明确判断做多做空时机。
-
策略逻辑简单清晰,容易理解实现。
-
存在指标发出错误信号的风险,跟踪趋势时也可能被困在震荡行情中。
-
在剧烈行情中,指标可能出现背离。
-
上下轨静态设定,无法动态适应市场波动。
-
未考虑止损策略,存在亏损扩大的风险。
-
移动平均存在滞后,可能错过趋势转折点。
-
可以考虑结合其他指标进行组合交易,避免错误信号。
-
动态计算上下轨参数,使之能自适应市场波动。
-
增加止损机制,控制单笔亏损。
-
调整移动平均类型,适应市场节奏。
-
优化移动平均周期参数,提高顺势捕捉效果。
-
可以考虑在突破上下轨时,采用追踪止损来锁定利润。
基于交易量的趋势追踪策略通过计算交易量正负性判断趋势,移平均产生交易信号,从而有效跟踪中长线趋势。该策略优势在于趋势判断准确,符合大多数交易者的长线操作习惯。但是也存在一定问题,需要进一步优化,使之能更好地应对市场的复杂性。总体而言,该策略为量化交易提供了一种简单实用的趋势追踪方案,契合大部分量化交易者的需求。
||
The volume oscillator based trend tracking strategy judges the current trend direction by calculating the ratio of positive and negative trading volume, and implements trend trading. Inspired by the On-Balance Volume (OBV) indicator, it determines the positivity and negativity of trading volume based on the relationship between close and open prices, and then constructs an indicator using the N-day moving average. It goes long when the indicator crosses above the upper rail, and goes short when crossing below the lower rail.
The main steps of this strategy are:
-
Calculate positive/negative volume: If the closing price is higher than the opening price, the volume of that candlestick is positive. If the closing price is lower than the opening price, the volume is negative. If they are equal, the volume is 0.
-
Sum up the N-day positive/negative volume to get the accumulated volume.
-
Calculate the N-day moving average of the accumulated volume to get the final indicator value.
-
Go long when the indicator crosses above the upper rail, and go short when crossing below the lower rail.
By judging the trend direction through volume positivity/negativity and generating trading signals with moving averages, this strategy can effectively track trends and capture medium- to long-term moves.
-
Using volume to determine trends is more convincing, as volume reflects market participation.
-
Smoothing with moving averages helps in trend tracking and reduces excessive trading.
-
The moving average period can be adjusted to fit different market rhythms.
-
The upper/lower rails provide clear long/short signals.
-
The logic is simple and easy to understand.
-
There is a risk of false signals. The strategy may also get stuck in range-bound markets.
-
Divergence may occur during huge market swings.
-
The static upper/lower rails cannot adapt to market volatility.
-
There is no stop loss, leading to excessive losses.
-
Moving averages lag and may miss trend turning points.
-
Combine with other indicators for confirmation to avoid false signals.
-
Compute upper/lower rails dynamically to adapt to volatility.
-
Add stop loss mechanisms to limit losses.
-
Adjust moving average type to match market rhythm.
-
Optimize moving average periods for better trend tracking.
-
Consider trailing stops on upper/lower rail breaks to lock in profits.
The volume oscillator strategy effectively tracks medium- to long-term trends by judging trends via volume positivity/negativity and generating signals with moving averages. Its advantage lies in accurate trend determination and alignment with most traders' long-term practices. However, some problems remain that require further enhancements to handle market complexity better. Overall, this simple and practical trend tracking approach caters well to the needs of most quant traders.
[/trans]
Strategy Arguments
| Argument | Default | Description |
|---|---|---|
| v_input_1 | 7 | AvgLen |
| v_input_2 | 40000 | TopBand |
| v_input_3 | -35000 | LowBand |
| v_input_4 | false | Trade reverse |
Source (PineScript)
/*backtest
start: 2022-10-27 00:00:00
end: 2023-11-02 00:00:00
period: 1d
basePeriod: 1h
exchanges: [{"eid":"Futures_Binance","currency":"BTC_USDT"}]
*/

//@version=2
////////////////////////////////////////////////////////////
//  Copyright by HPotter v1.0 15/12/2017
// This is the second part of TFS trading strategy. The concept of this
// indicator is similar to that of On-Balance Volume indicator (OBV). It
// is calculated according to these rules:
// If Close > Open, Volume is positive
// If Close < Open, Volume is negative
// If Close = Open, Volume is neutral
// Then you take the 7-day MA of the results.
//
// You can change long to short in the Input Settings
// WARNING:
// - For purpose educate only
// - This script to change bars colors.
////////////////////////////////////////////////////////////
strategy(title="TFS: Volume Oscillator", shorttitle="TFS: Volume Oscillator")
AvgLen = input(7, minval=1)
TopBand = input(40000, step=1)
LowBand = input(-35000, step=1)
reverse = input(false, title="Trade reverse")
hline(TopBand, color=red, linestyle=line)
hline(LowBand, color=green, linestyle=line)
hline(0, color=blue, linestyle=line)
xClose = close
xOpen = open
xVolume = volume
nVolAccum = sum(iff(xClose > xOpen, xVolume, iff(xClose < xOpen, -xVolume, 0))  ,AvgLen)
nRes = nVolAccum / AvgLen
pos = iff(nRes > TopBand, 1,
       iff(nRes < LowBand, -1, nz(pos[1], 0)))
possig = iff(reverse and pos == 1, -1,
          iff(reverse and pos == -1, 1, pos))
if (possig == 1)
    strategy.entry("Long", strategy.long)
if (possig == -1)
    strategy.entry("Short", strategy.short)
barcolor(possig == -1 ? red: possig == 1 ? green : blue )
plot(nRes, color=blue, title="TFS", style = histogram)
Detail
https://www.fmz.com/strategy/430991
Last Modified
2023-11-03 15:47:22
