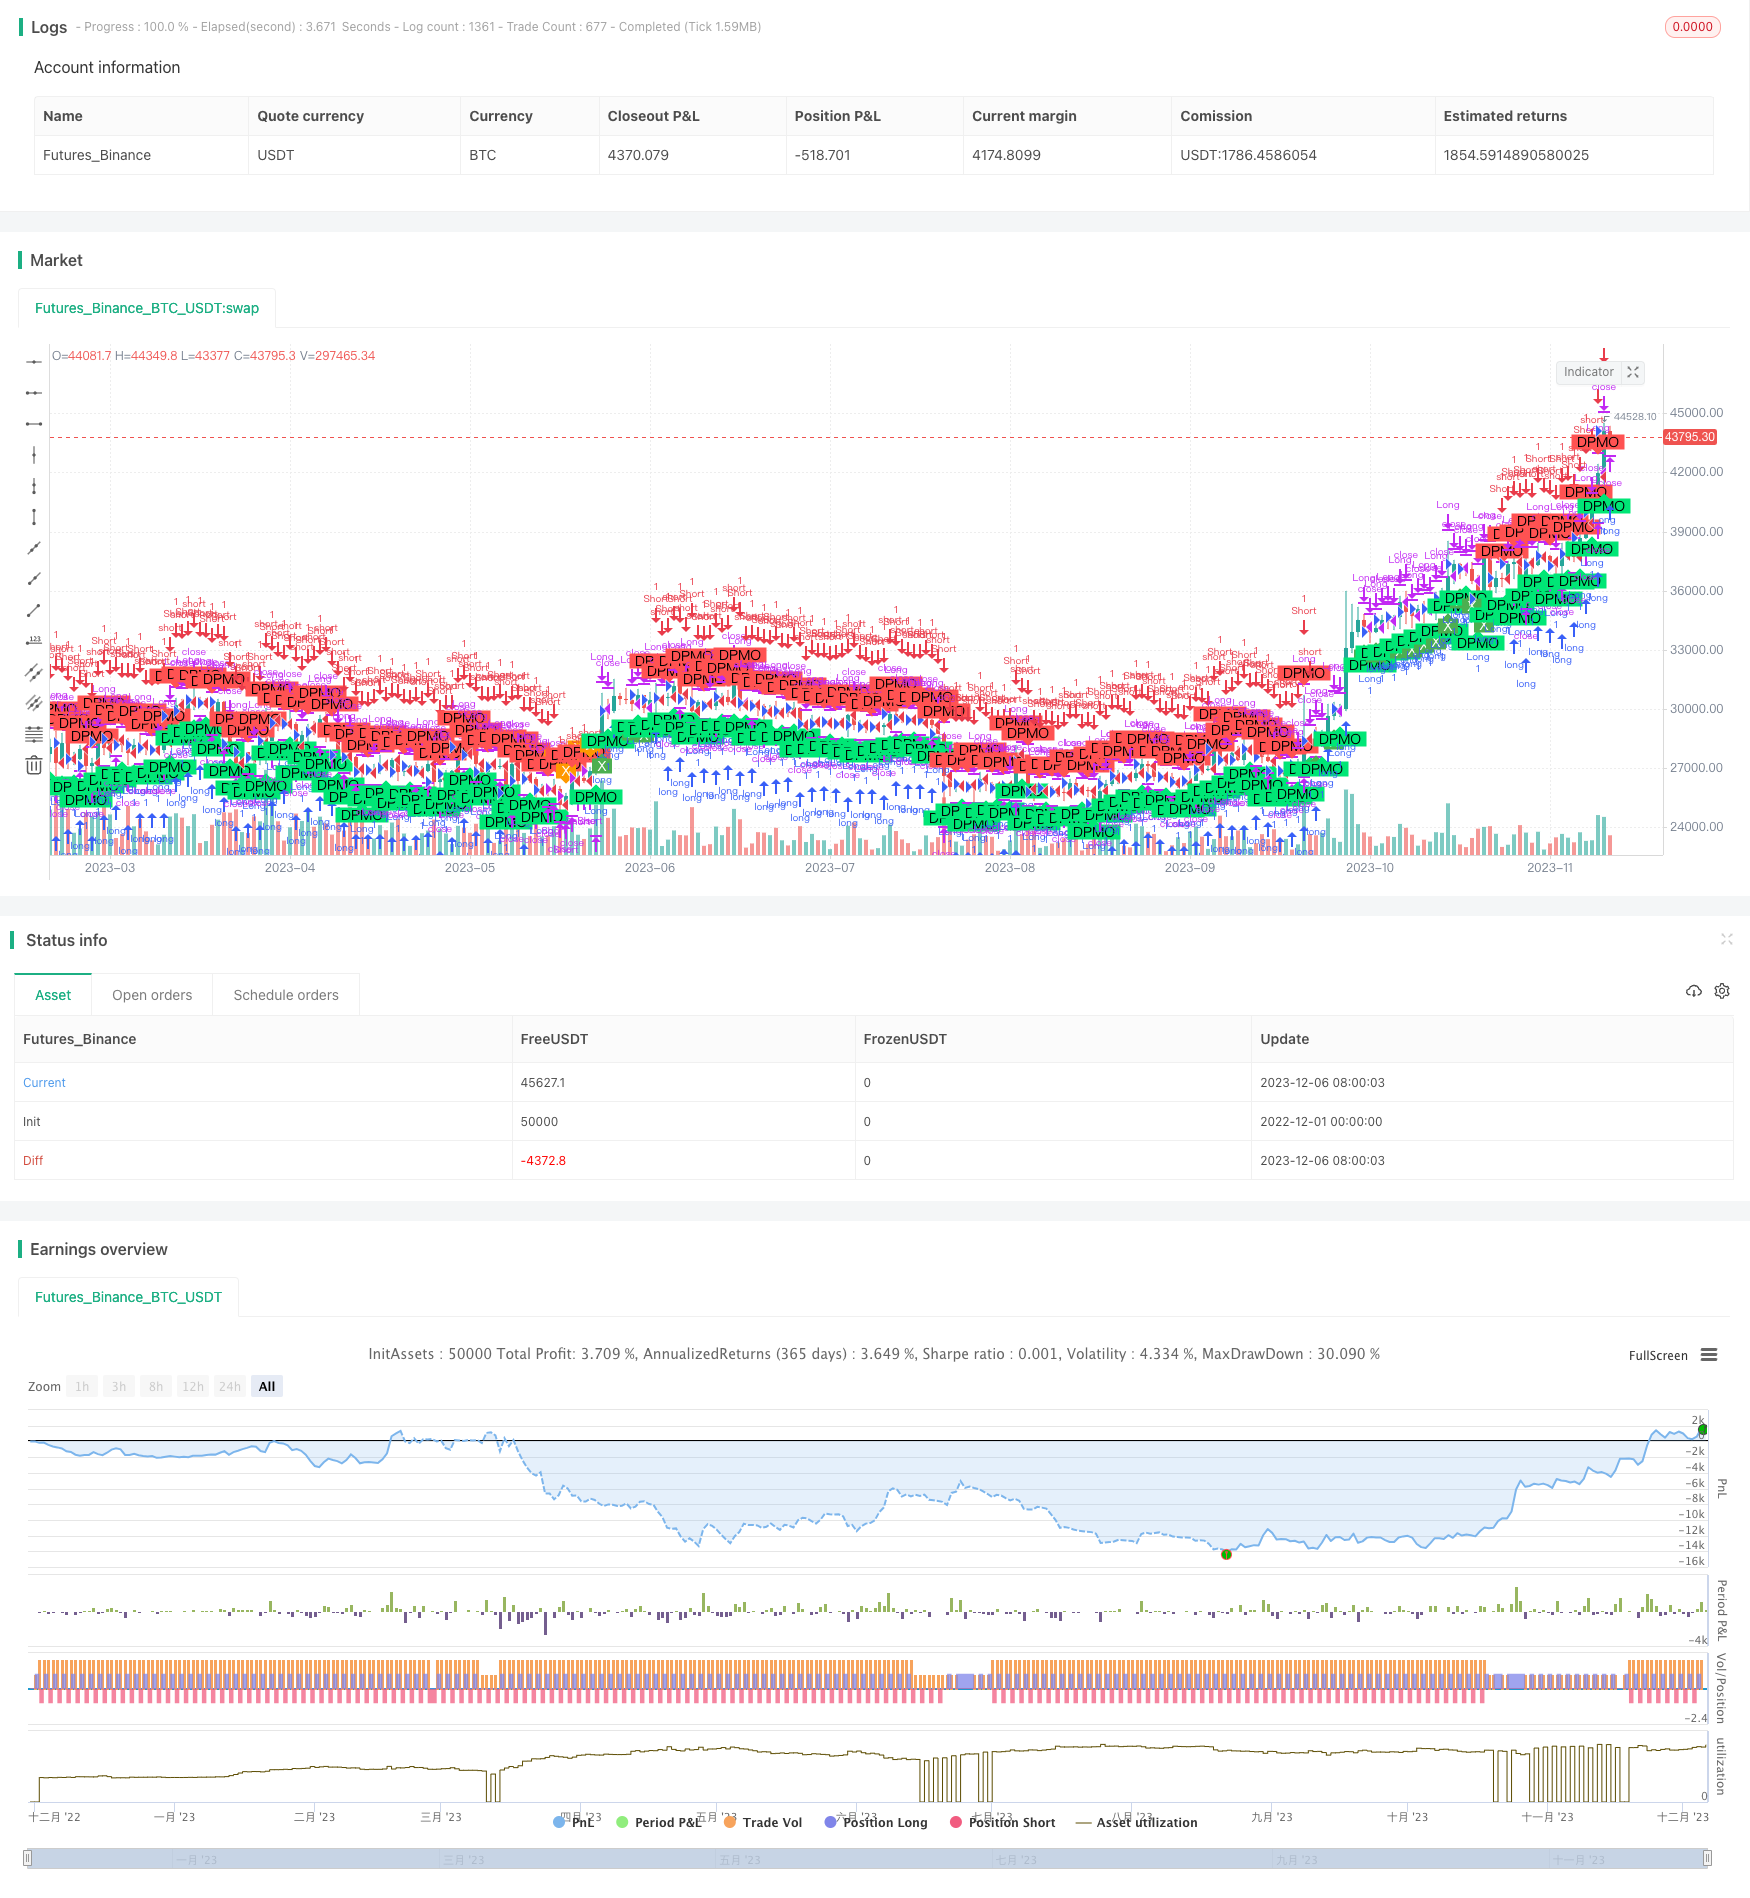
Name
基于价格波动率的双均线突破策略Price-Volatility-Breakout-Strategy-Based-on-Double-Moving-Averages
Author
ChaoZhang
Strategy Description
本策略的核心思想是利用价格的波动率来判断市场的趋势,当波动率上升时,表示市场正在形成新的趋势;当波动率下降时,表示当前趋势正在结束。策略通过计算价格的百分比变化,然后对其进行双均线滤波,得到反映价格波动率的指标。当该指标上穿其信号线时产生买入信号,下穿其信号线时产生卖出信号。
该策略首先计算价格的百分比变化:
i=(src/nz(src[1], src))*100
然后通过一个长度为35的均线滤波,得到初级的价格波动率指标pmol2。再通过一个长度为20的均线对pmol2进行二次滤波,得到最终的价格波动率指标pmol。最后,通过一个长度为10的均线得到pmol的信号线pmols。 当pmol上穿pmols时,产生买入信号;当pmol下穿pmols时,产生卖出信号。
- 利用双均线滤波,可较好地提取价格波动率,过滤噪音。
- 计算价格的百分比变化,可放大价格变化,更清晰地反映趋势变化。
- 获利方式比较明确:趋势开始买入,趋势结束卖出。
- 双均线滤波会带来一定程度的滞后。
- 百分比变化计算方式对价格幅度较敏感。
- 牛熊转换时,须及时平仓。
优化方向:
- 优化均线参数,提高对趋势的捕捉。
- 尝试不同的价格变化计算方式。
- 增加过滤条件,避免错误信号。
本策略通过计算百分比变化和双均线滤波的方式,提取价格波动率,判断市场趋势变化,属于较为成熟的技术指标类策略。该策略捕捉趋势的能力较强,但识别转换点能力一般。可通过调整参数和增加辅助条件来优化。
||
The core idea of this strategy is to use price volatility to judge market trends. When volatility rises, it means the market is forming a new trend. And when volatility declines, it means the current trend is ending. The strategy calculates the percentage change of price and then filters it with double moving averages to get an indicator reflecting price volatility. It generates buy signals when the indicator crosses above its signal line, and sells signals when crossing below.
The strategy first calculates the percentage change of price:
i=(src/nz(src[1], src))*100
Then it filters i with a 35-period moving average to get the preliminary volatility indicator pmol2. Pmol2 is filtered again with a 20-period moving average to get the final indicator pmol. Finally, a 10-period moving average of pmol is used as the signal line pmols. Buy when pmol crosses over pmols and sell when crossing below.
- The double MA filtering extracts volatility well and filters out noise.
- Calculating percentage change amplifies price movements, making trend changes more visible.
- Profit model is clear: buy at trend start, sell at trend end.
- Double filtering causes some lag.
- Percentage change calculation is sensitive to price amplitude.
- Need timely exits at bull-bear transitions.
- Optimize MA parameters to improve trend catching.
- Try different price change calculation methods.
- Add filters to avoid wrong signals.
This strategy uses percentage change and double MA filtering to extract price volatility and judge trend changes. It belongs to the relatively mature technical indicator strategies. The strategy has good trend catching capability but medium turning point recognition capability. Can optimize via parameter tuning and adding auxiliary conditions.
[/trans]
Strategy Arguments
| Argument | Default | Description |
|---|---|---|
| v_input_1_close | 0 | Source: close |
| v_input_2 | 35 | First Smoothing |
| v_input_3 | 20 | Second Smoothing |
| v_input_4 | 10 | Signal Smoothing |
| v_input_5 | false | Enable Bar Colors |
Source (PineScript)
/*backtest
start: 2022-12-01 00:00:00
end: 2023-12-07 00:00:00
period: 1d
basePeriod: 1h
exchanges: [{"eid":"Futures_Binance","currency":"BTC_USDT"}]
*/

//@version=2
strategy("Strategy for DPMO", overlay=true)

src=input(close, title="Source")
length1=input(35, title="First Smoothing")
length2=input(20, title="Second Smoothing")
siglength=input(10, title="Signal Smoothing")
ebc=input(false, title="Enable Bar Colors")

upSign = '↑' // indicates the indicator shows uptrend
downSign = '↓' // incicates the indicator showing downtrend
exitSign ='x' //indicates the indicator uptrend/downtrend ending

calc_csf(src, length) =>
	sm = 2.0/length
	csf=(src - nz(csf[1])) * sm + nz(csf[1])
	csf
i=(src/nz(src[1], src))*100
pmol2=calc_csf(i-100, length1)
pmol=calc_csf( 10 * pmol2, length2)
pmols=ema(pmol, siglength)
d=pmol-pmols
hc=d>0?d>d[1]?lime:green:d<d[1]?red:orange

buyDPMO = hc==lime and hc[1]!=lime
closeBuyDPMO = hc==green and hc[1]!=green
sellDPMO = hc==red and hc[1]!=red
closeSellDPMO = hc==orange and hc[1]!=orange

plotshape(buyDPMO, color=lime, style=shape.labelup, textcolor=#000000, text="DPMO", location=location.belowbar, transp=0)
plotshape(closeBuyDPMO, color=green, style=shape.labelup, textcolor=#ffffff,  text="X", location=location.belowbar, transp=0)
plotshape(sellDPMO, color=red, style=shape.labeldown, textcolor=#000000, text="DPMO", location=location.abovebar, transp=0)
plotshape(closeSellDPMO, color=orange, style=shape.labeldown, textcolor=#ffffff,  text="X", location=location.abovebar, transp=0)
barcolor(ebc?hc:na)


strategy.entry("Long", strategy.long, when=buyDPMO)
strategy.close("Long", when=closeBuyDPMO or sellDPMO)
strategy.entry("Short", strategy.short, when=sellDPMO)
strategy.close("Short", when=closeSellDPMO or buyDPMO)
Detail
https://www.fmz.com/strategy/434712
Last Modified
2023-12-08 16:44:22
