Name
基于价格通道和MACD的多时间框架交易策略Price-Channel-and-MACD-Based-Multi-Timeframe-Trading-Strategy
Author
ChaoZhang
Strategy Description
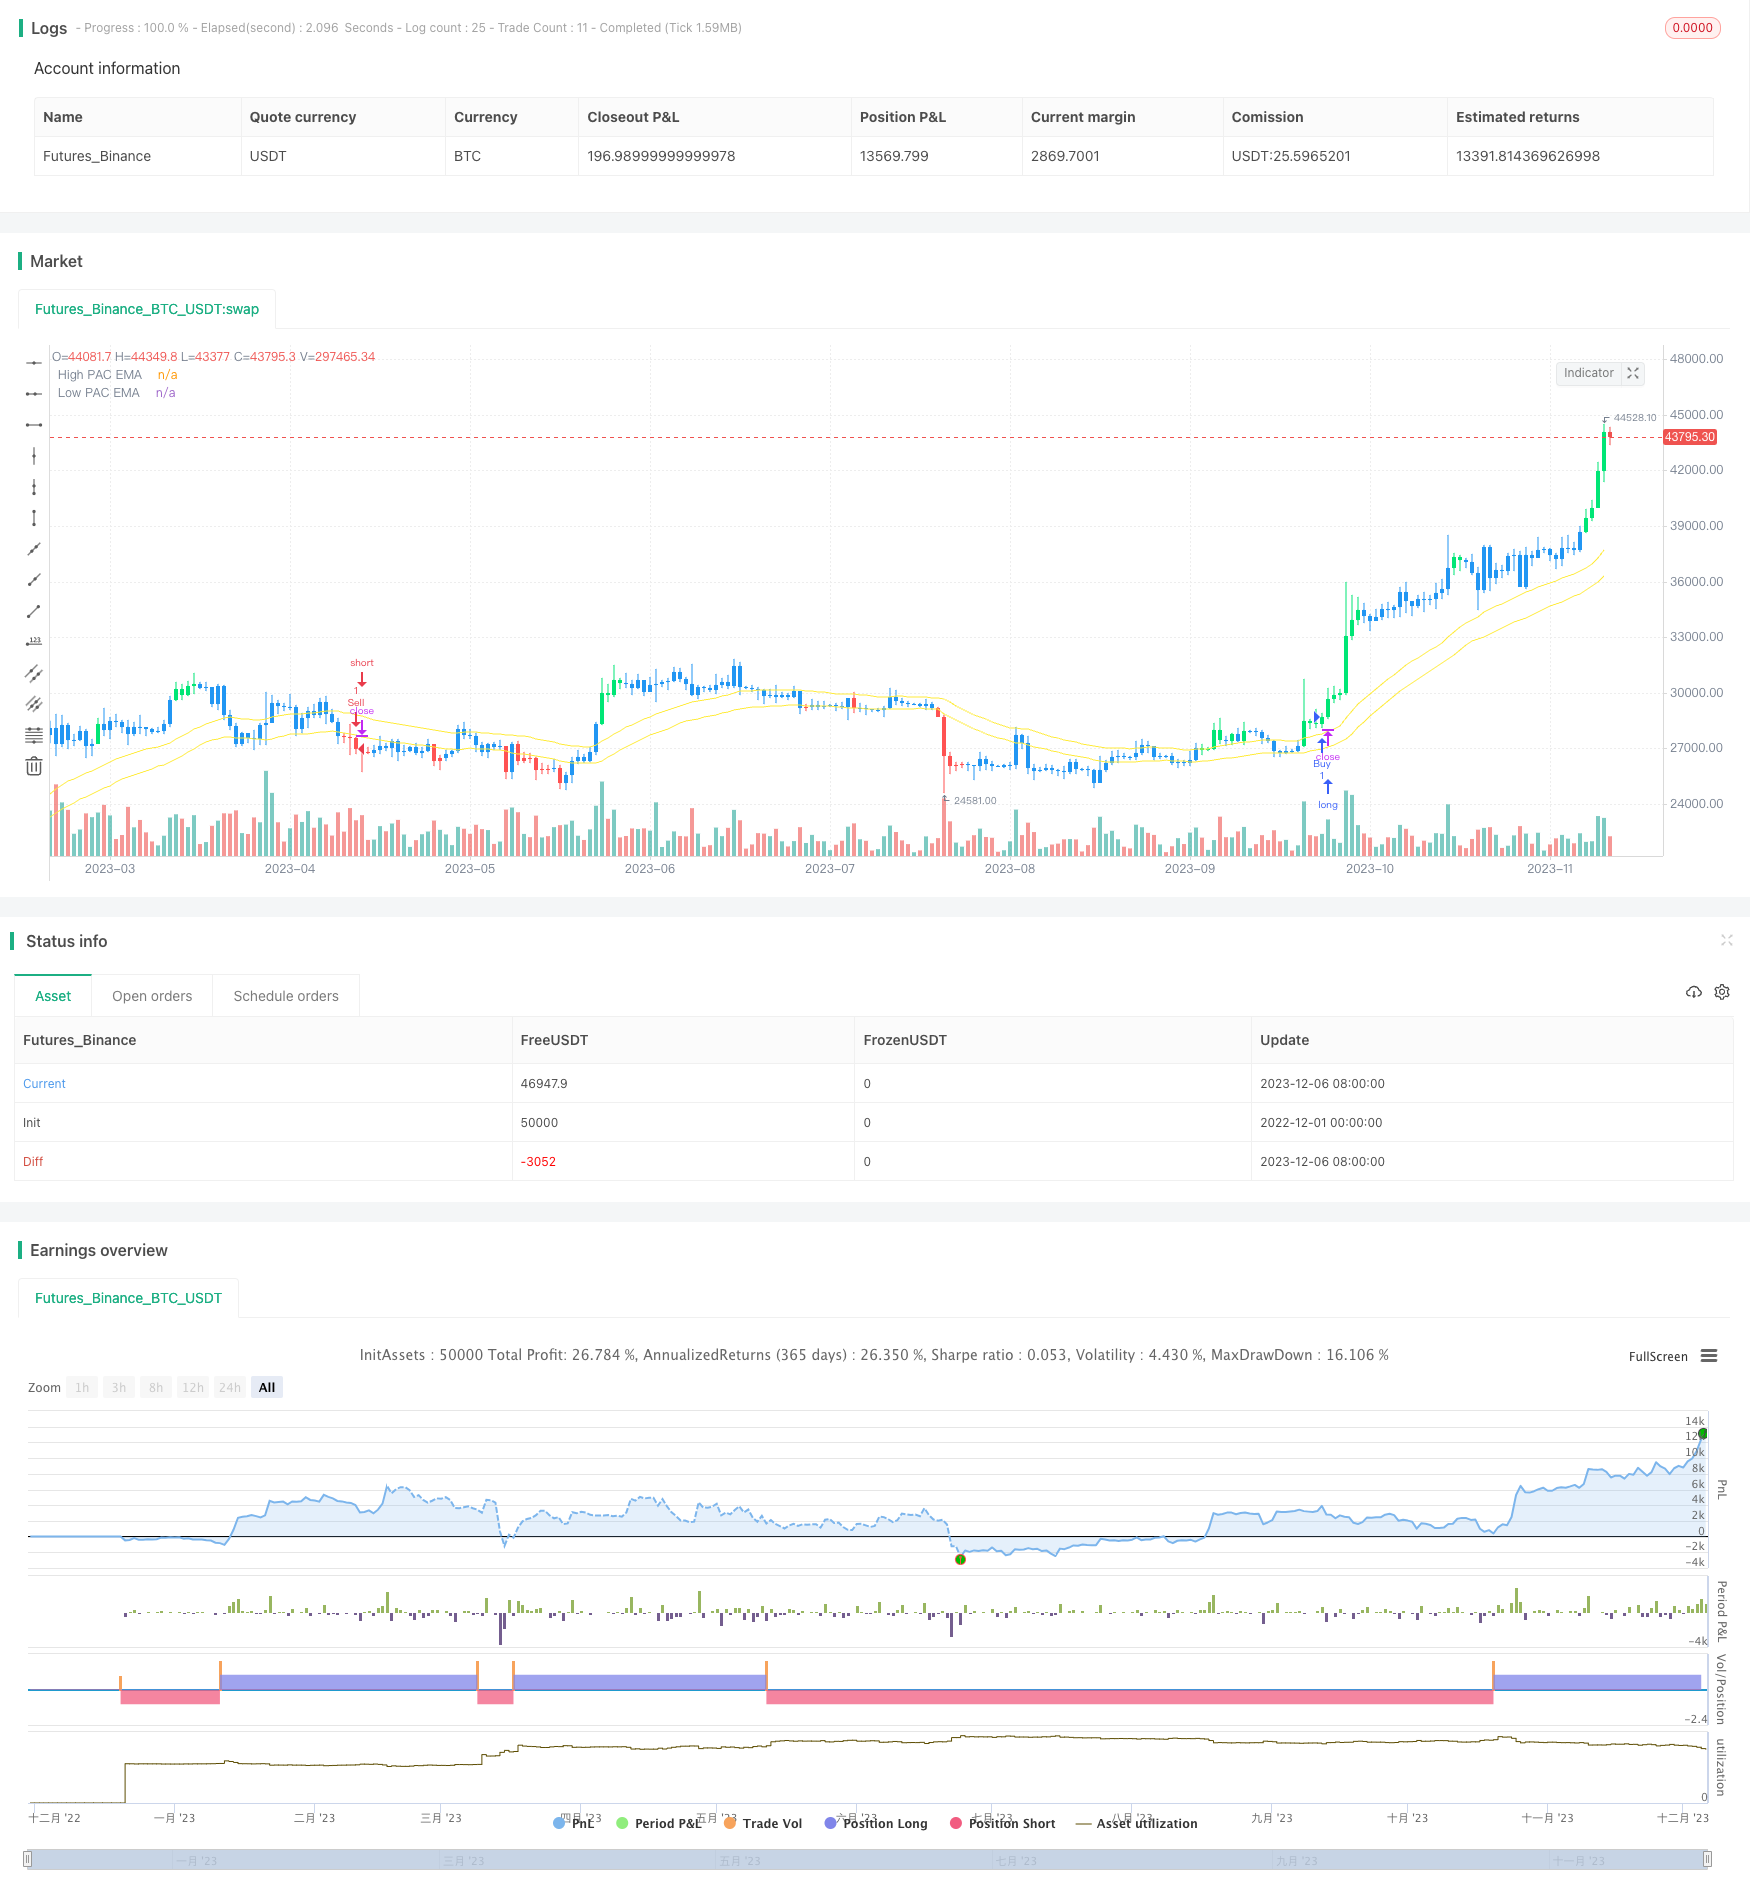
该策略结合了价格通道指标和MACD指标,实现在多时间框架下进行趋势跟踪和超买超卖的判断,从而制定买卖决策。策略同时结合止损止盈来管理风险。
价格通道指标基于最高价和最低价的EMA均线构建价格通道,通过价格突破通道判断趋势;MACD指标判断多空气势,在零轴以上为多头市场,以下为空头市场。
该策略的交易信号来源于以下几个方面:
-
MACD histogram翻红Enter多头,翻绿Enter空头
-
价格接近通道底部且MACD在零轴下方时Enter空头
-
价格接近通道顶部且MACD在零轴上方时Enter多头
-
MACD上穿零轴时Enter多头,下穿零轴时Enter空头
Exit信号来源于止损止盈设置。
-
多指标组合验证,避免假突破
-
不同时间框架指标组合,判断趋势方向更可靠
-
引入止损止盈机制,有效控制单笔损失
-
参数优化空间有限,容易过优化
-
价格通道参数设置过低,将错失较大行情
-
停损点设置过小,将承受较大亏损
解决方法:
-
采用walk forward方法,避免过优化参数
-
设置价格通道参数为自适应参数
-
引入波动率止损来动态调整止损距离
-
优化MACD参数组合
-
优化价格通道参数自适应计算
-
加入更多过滤条件,避免假突破使效率更高
该策略整合价格通道指标和MACD指标的优势,合理的参数设置和优化空间大,在趋势判断和超买超卖判断方面效果较好,止损止盈机制控制了单次亏损风险,是一种较为稳定的交易策略。后续可从参数优化、过滤条件添加、止损机制优化等方面进行改进。
||
This strategy combines price channel indicator and MACD indicator to track trends and identify overbought and oversold levels across multiple timeframes, thereby making buy and sell decisions. The strategy also incorporates stop loss and take profit to manage risks.
The price channel indicator constructs a price channel based on EMA lines of highest and lowest prices to determine trends when price breaks out of the channel. The MACD indicator judges bullish and bearish momentum. Values above zero line suggest a bull market while values below suggest a bear market.
The trading signals of this strategy come from the following aspects:
-
Enter long when MACD histogram flips red. Enter short when MACD histogram flips green.
-
Enter short when price approaches the bottom of the channel and MACD is below zero line.
-
Enter long when price approaches the top of the channel and MACD is above zero line.
-
Enter long when MACD crosses above zero line. Enter short when MACD crosses below zero line.
Exits are triggered by stop loss and take profit.
-
Combination of indicators prevents false breakout.
-
Combination of indicators across timeframes ensures reliable trend detection.
-
Incorporation of stop loss and take profit effectively controls per trade loss.
-
Limited optimization space leading to overoptimization.
-
Low setting of price channel misses larger moves.
-
Tight stop loss causes larger losses.
Solutions:
-
Adopt walk forward optimization to prevent overoptimization.
-
Set adaptive parameters for price channel.
-
Introduce volatility based stop loss for dynamic adjustment of stop distance.
-
Optimize combination of MACD parameters.
-
Optimize adaptive calculation of price channel parameters.
-
Add more filters to prevent false breakouts and improve efficiency.
This strategy combines the strengths of price channel and MACD by reasonable parameter setups and large optimization space. It performs well in trend detection and overbought/oversold identification. The stop loss/take profit mechanism controls per trade loss. Going forwards, improvements can be made by parameters optimization, adding filters and optimizing the stop loss mechanism.
[/trans]
Strategy Arguments
| Argument | Default | Description |
|---|---|---|
| v_input_1 | 34 | High Low channel Length |
| v_input_2 | 12 | fastLength |
| v_input_3 | 26 | slowlength |
| v_input_4 | 9 | MACDLength |
| v_input_5 | 34 | PeriodLookBack |
| v_input_6 | 100 | Stop Loss Point |
| v_input_7 | 0.1 | Reward/Risk |
| v_input_8 | false | Use exit order strategy? |
Source (PineScript)
/*backtest
start: 2022-12-01 00:00:00
end: 2023-12-07 00:00:00
period: 1d
basePeriod: 1h
exchanges: [{"eid":"Futures_Binance","currency":"BTC_USDT"}]
*/

//@version=2
strategy("Sonic R + Barcolor MACD", overlay=true)
HiLoLen     = input(34, minval=2,title="High Low channel Length")
pacL        = ema(low,HiLoLen)
pacH        = ema(high,HiLoLen)
// Plot the Price Action Channel (PAC) base on EMA high,low and close//
L=plot(pacL, color=yellow, linewidth=1, title="High PAC EMA",transp=0)
H=plot(pacH, color=yellow, linewidth=1, title="Low PAC EMA",transp=0)
fastLength = input(12)
slowlength = input(26)
MACDLength = input(9)
MACD = ema(close, fastLength) - ema(close, slowlength)
aMACD = ema(MACD, MACDLength)
delta = MACD - aMACD
hisup= iff(delta>delta[1] and delta>0, 1,
	     iff(delta<delta[1], -1, nz(hisup[1], 0)))
hisdown = iff(delta<delta[1] and delta<0, 1,
	     iff(delta>delta[1], -1, nz(hisdown[1], 0)))
barcolor(hisup==1 and MACD>0 ? lime: hisdown==1 and MACD<0 ? red : blue )
//SR
PeriodLookBack = input(34)
xHighest = highest(PeriodLookBack)
xLowest = lowest(PeriodLookBack)
Trend= close>xHighest[1] ? 1: close< xLowest[1]?-1 : nz(Trend[1],0)
// Strategy//
conbuy= hisdown==1 or MACD<0 ? 1: hisup[5]==1 and MACD[5]>0 ?-1 : nz(conbuy[1],0)
gobuy= conbuy==1 and close-open<2*(pacH-pacL) and high-close<(pacH-pacL)/2 and hisup==1 and MACD>0 and close-pacH<1.5*(pacH-pacL) and close>open and high-close<close-open and close>pacH
consell= hisup==1 or MACD>0 ?1 : hisdown[5]==1 and MACD[5]<0 ?-1 : nz(consell[1],0)
gosell= consell==1 and open-close<2*(pacH-pacL) and close-low<(pacH-pacL)/2 and hisdown==1 and MACD<0 and pacL-close<1.5*(pacH-pacL) and close<open and close-low<open-close and close<pacL
if(gobuy)
    strategy.entry("Buy",strategy.long)
if(gosell)
    strategy.entry("Sell",strategy.short)
//if(Trend==-1 and close<pacL)
//    strategy.close("Buy")
//if(Trend==1 and close>pacH)
//    strategy.close("Sell")
 ////////////// TP and SL//
SL = input(defval=100.00, title="Stop Loss Point", type=float, step=1)
rr= input(defval=0.1,title="Reward/Risk",type=float)
useTPandSL = input(defval = false, title = "Use exit order strategy?")
Stop = SL
Take=SL*rr
Q = 100
if(useTPandSL)
    strategy.exit("Out Long", "Buy", qty_percent=Q, profit= Take, loss=Stop)
    strategy.exit("Out Short", "Sell", qty_percent=Q, profit= Take, loss=Stop)
Detail
https://www.fmz.com/strategy/434699
Last Modified
2023-12-08 15:15:37
