Name
基于价格量变动的趋势策略Modified-Price-Volume-Trend-Strategy-Based-on-Price-Volume-Changes
Author
ChaoZhang
Strategy Description
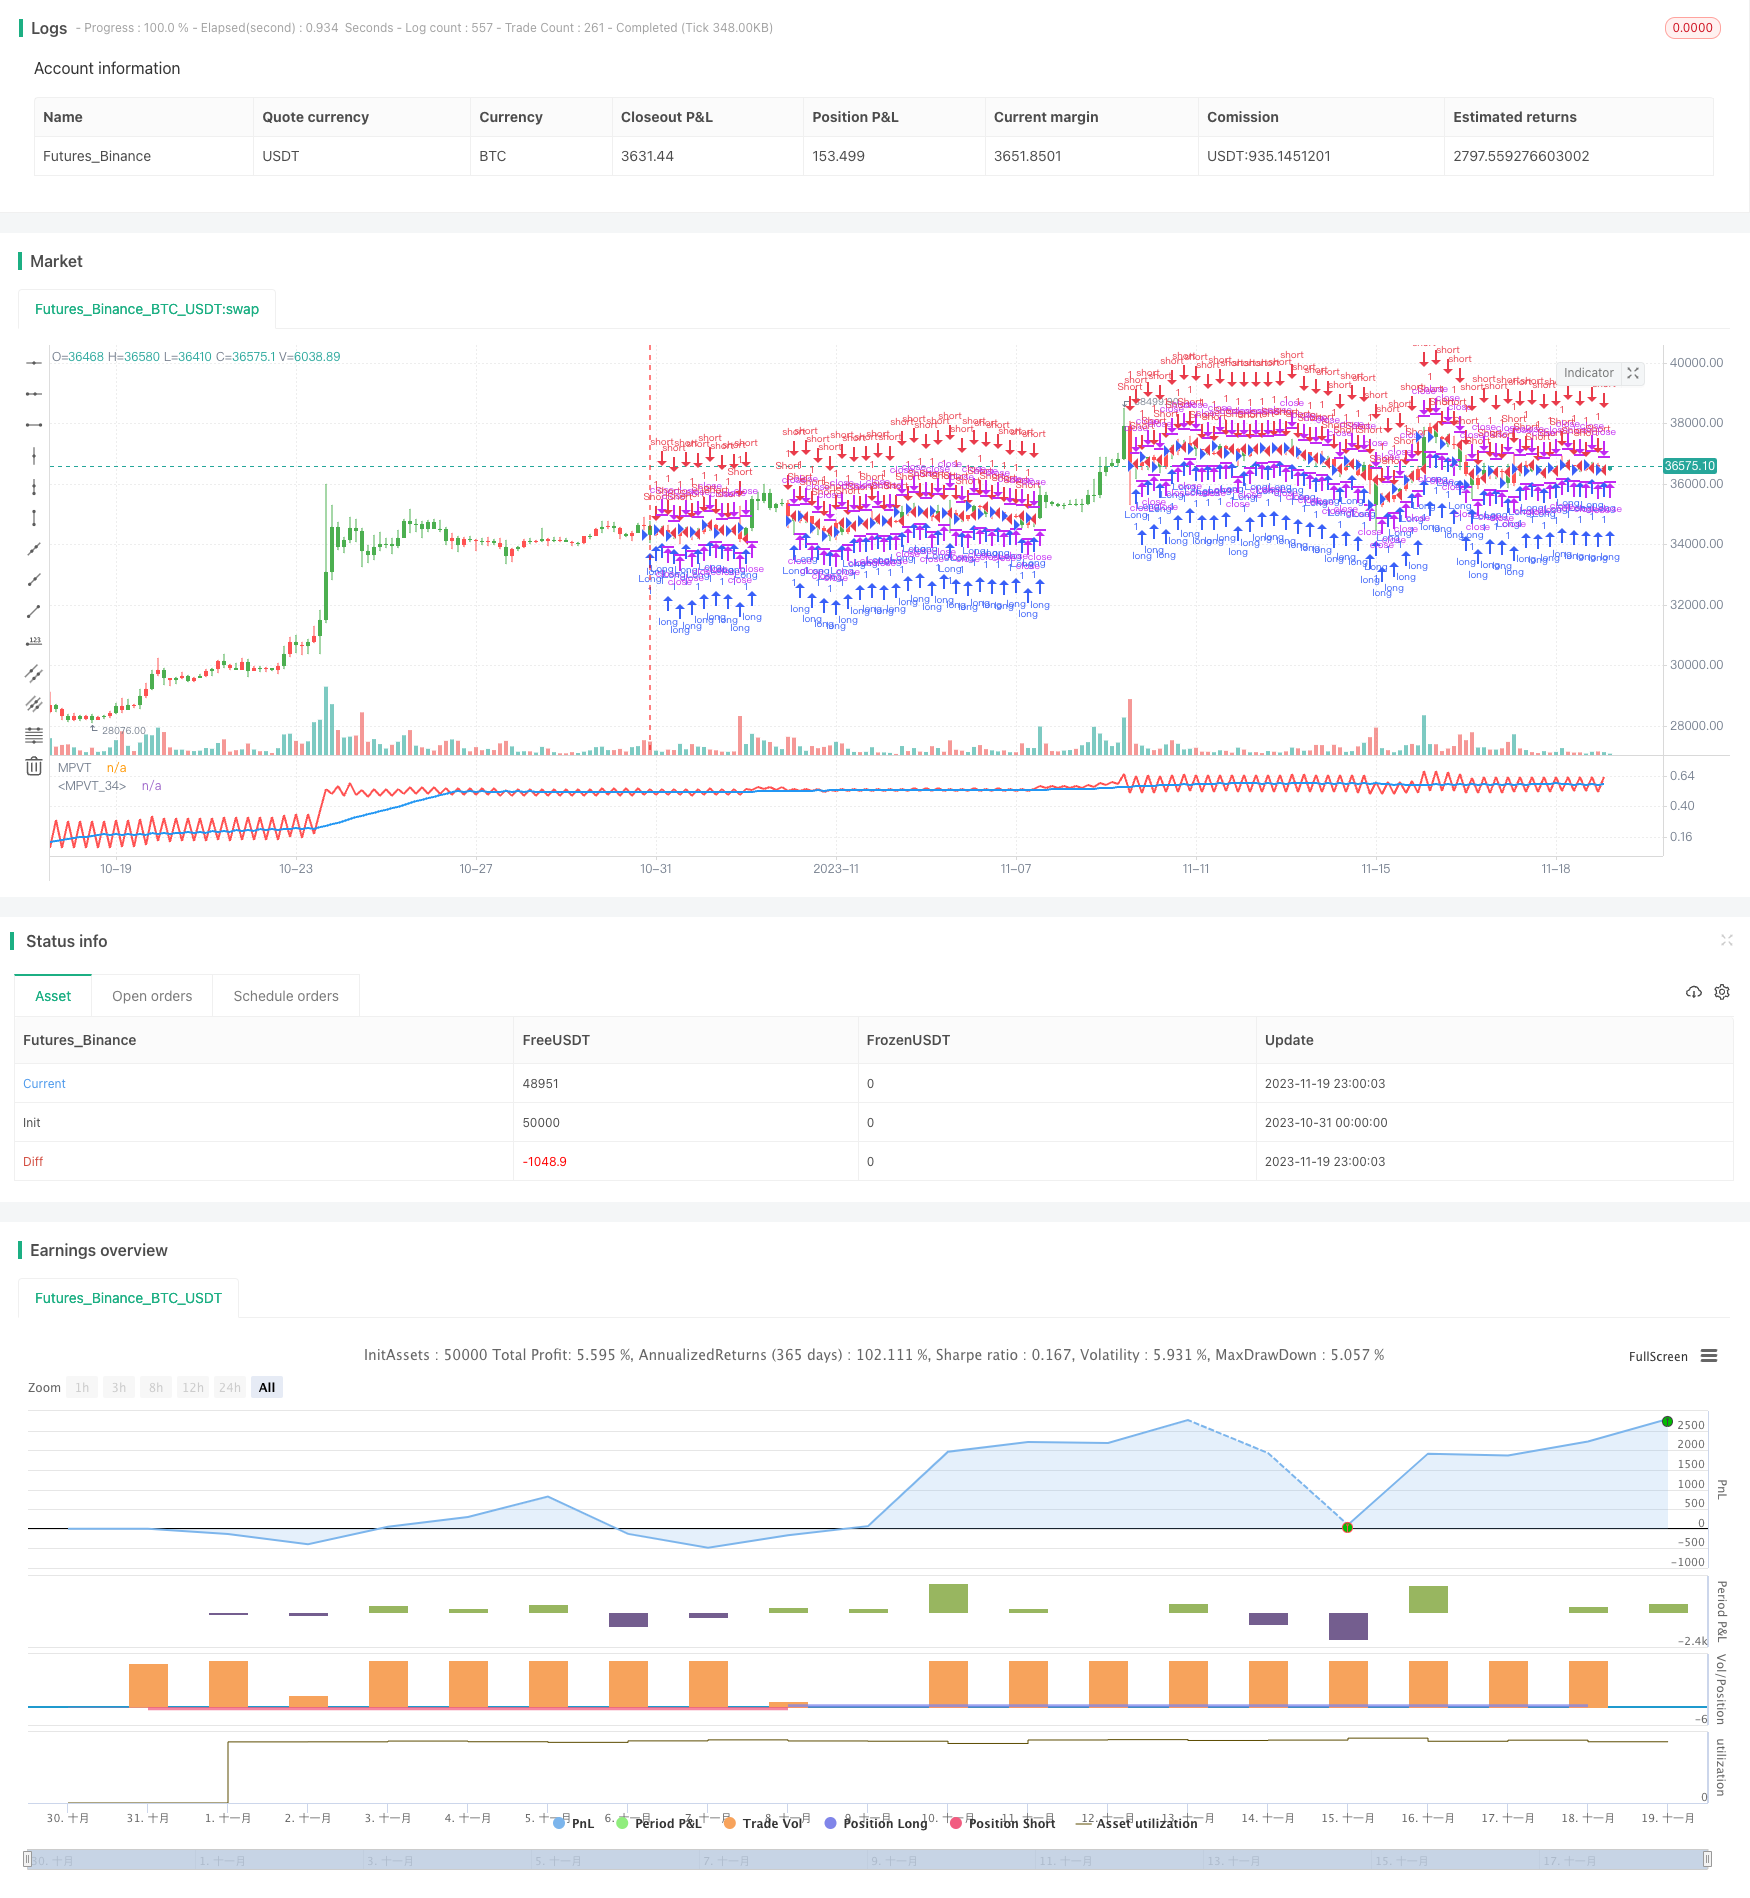
本策略名称为“基于价格量变动的趋势策略”。该策略通过计算价格和交易量的累计变动情况,结合移动平均线构建长短仓单,实现追踪趋势的目的。
该策略的核心指标是价量累计变动指标(MPVT)。该指标通过价格和交易量的变化情况,反映市场人气和资金流入流出的情况。具体计算公式如下:
rV = 交易量 / 50000
xCumPVT = 昨日xCumPVT + (rV * (最新收盘价 - 昨日收盘价) / 昨日收盘价)
然后结合参数Level和Scale,构建价量变动Residence指标:
nRes = Level + Scale * xCumPVT
Residence指标反映了价格和交易量的综合变化。当其上穿其N日简单移动平均线时,做多;当其下穿其N日简单移动平均线时,做空。
该策略主要具有以下优势:
- 通过价量指标判断市场人气和资金流向,可以及时捕捉到趋势的转折点。
- 结合参数优化,可以灵活调整策略的参数,适应不同市场环境。
- 可以通过反向输入参数,实现做空策略,扩大策略运用场景。
该策略也存在一些风险:
- 价量指标容易产生错误信号,可能出现突破不成立的情况。可以适当调整参数或结合其他指标进行过滤。
- 趋势行情适用性更好,盘整行情容易产生错误信号。可以考虑与趋势和波动率指标进行组合。
- 参数优化效果取决于历史周期,可能产生过拟合风险。应适当调整参数或采用步进优化方法。
该策略可以考虑从以下几个方面进行优化:
-
可以测试不同的移动平均线,如加权移动平均线、EMA等进行组合,看哪种效果更好。
-
可以结合其他指标,如RSI、KD等进行过滤信号,减少错误信号发生概率。
-
可以测试不同的参数组合,寻找最佳参数对。也可以采用步进优化方法,让参数实时更新。
-
可以通过和趋势以下指标,如布林带进行组合,提高策略的稳定性。
本策略通过计算价格和交易量变化累计值,设计出价量变动Residence指标,能够有效反映市场资金流入流出情况,是一种典型的价量COMBO策略。该策略简单实用,适用于趋势行情,通过参数优化和指标组合优化空间大,是非常值得推荐的趋势策略。
||
The name of this strategy is "Modified Price-Volume Trend Strategy Based on Price-Volume Changes". This strategy calculates the cumulative changes in price and volume, combined with moving average lines to establish long and short positions, in order to track the trend.
The core indicator of this strategy is the Modified Price Volume Trend (MPVT) indicator. This indicator reflects the market enthusiasm and capital inflows and outflows through the changes in price and trading volume. The specific calculation formula is as follows:
rV = Volume / 50000
xCumPVT = Yesterday's xCumPVT + (rV * (Latest Close Price - Yesterday's Close Price) / Yesterday's Close Price)
Then combined with the Level and Scale parameters, construct the Price-Volume Change Residence indicator:
nRes = Level + Scale * xCumPVT
The Residence indicator reflects the combined changes in price and volume. When it crosses above its N-day simple moving average, go long. When it falls below its N-day simple moving average, go short.
The main advantages of this strategy are:
-
Judging market enthusiasm and capital flow direction through price-volume indicators can timely capture turning points of the trend.
-
Flexible adjustment of strategy parameters through parameter optimization to adapt to different market environments.
-
The shorting strategy can be realized by setting the reverse input parameter to expand the application scenario of the strategy.
There are also some risks in this strategy:
-
Price-volume indicators are prone to false signals, and there may be cases where breakthroughs do not hold. Parameters can be adjusted or combined with other indicators for filtering.
-
It is more suitable for trend markets, and may produce false signals in range-bound markets. Can consider combining with trend and volatility indicators.
-
The effect of parameter optimization depends on the historical cycle, which may lead to over-fitting risks. Parameters should be adjusted appropriately or stepwise optimization methods adopted.
The following aspects can be considered to optimize this strategy:
-
Test different moving averages, such as weighted moving average, EMA, etc. to see which combination works better.
-
Combine with other indicators, such as RSI, KD, etc. to filter signals and reduce the probability of false signals.
-
Test different parameter combinations to find the optimal parameter pair. Stepwise optimization methods can also be adopted to update parameters in real time.
-
Improve the stability of the strategy by combining it with trend-following indicators such as Bollinger Bands.
This strategy calculates the cumulative changes in price and volume to design a Price-Volume Change Residence indicator, which can effectively reflect capital inflows and outflows. It is a typical price-volume COMBO strategy. The strategy is simple and practical, suitable for trend markets, with large optimization space through parameter optimization and indicator combination optimization, and is a highly recommended trend strategy.
[/trans]
Strategy Arguments
| Argument | Default | Description |
|---|---|---|
| v_input_1 | false | Level |
| v_input_2 | true | Scale |
| v_input_3 | 23 | Length |
| v_input_4 | false | Trade reverse |
Source (PineScript)
/*backtest
start: 2023-10-31 00:00:00
end: 2023-11-20 00:00:00
period: 3h
basePeriod: 15m
exchanges: [{"eid":"Futures_Binance","currency":"BTC_USDT"}]
*/

//@version=2
////////////////////////////////////////////////////////////
//  Copyright by HPotter v1.0 20/07/2018
//  The related article is copyrighted material from
//  Stocks & Commodities.
//  Strategy by HPotter.
//
// You can change long to short in the Input Settings
// WARNING:
// - For purpose educate only
// - This script to change bars colors.
////////////////////////////////////////////////////////////
strategy(title="Modified Price-Volume Trend Backtest", shorttitle="MPVT")
Level = input(0)
Scale = input(1)
Length = input(23)
reverse = input(false, title="Trade reverse")
xOHLC4 = ohlc4
xV = volume
rV = xV / 50000
xCumPVT = nz(xCumPVT[1]) + (rV * (xOHLC4 - xOHLC4[1]) / xOHLC4[1])
nRes = Level + Scale * xCumPVT
xMARes = sma(nRes, Length)
pos = iff(nRes > xMARes, 1,
       iff(nRes < xMARes, -1, nz(pos[1], 0)))
possig = iff(reverse and pos == 1, -1,
          iff(reverse and pos == -1, 1, pos))
if (possig == 1)
    strategy.entry("Long", strategy.long)
if (possig == -1)
    strategy.entry("Short", strategy.short)
barcolor(possig == -1 ? red: possig == 1 ? green : blue )
plot(nRes, color=red, title="MPVT", linewidth = 2)
plot(xMARes, color=blue, title="MPVT", linewidth = 2)
Detail
https://www.fmz.com/strategy/433925
Last Modified
2023-12-01 14:56:17
