Name
基于供需区域与EMA滑动止损的交易策略Trading-Strategy-Based-on-Supply-and-Demand-Zones-with-EMA-and-Trailing-Stop
Author
ChaoZhang
Strategy Description
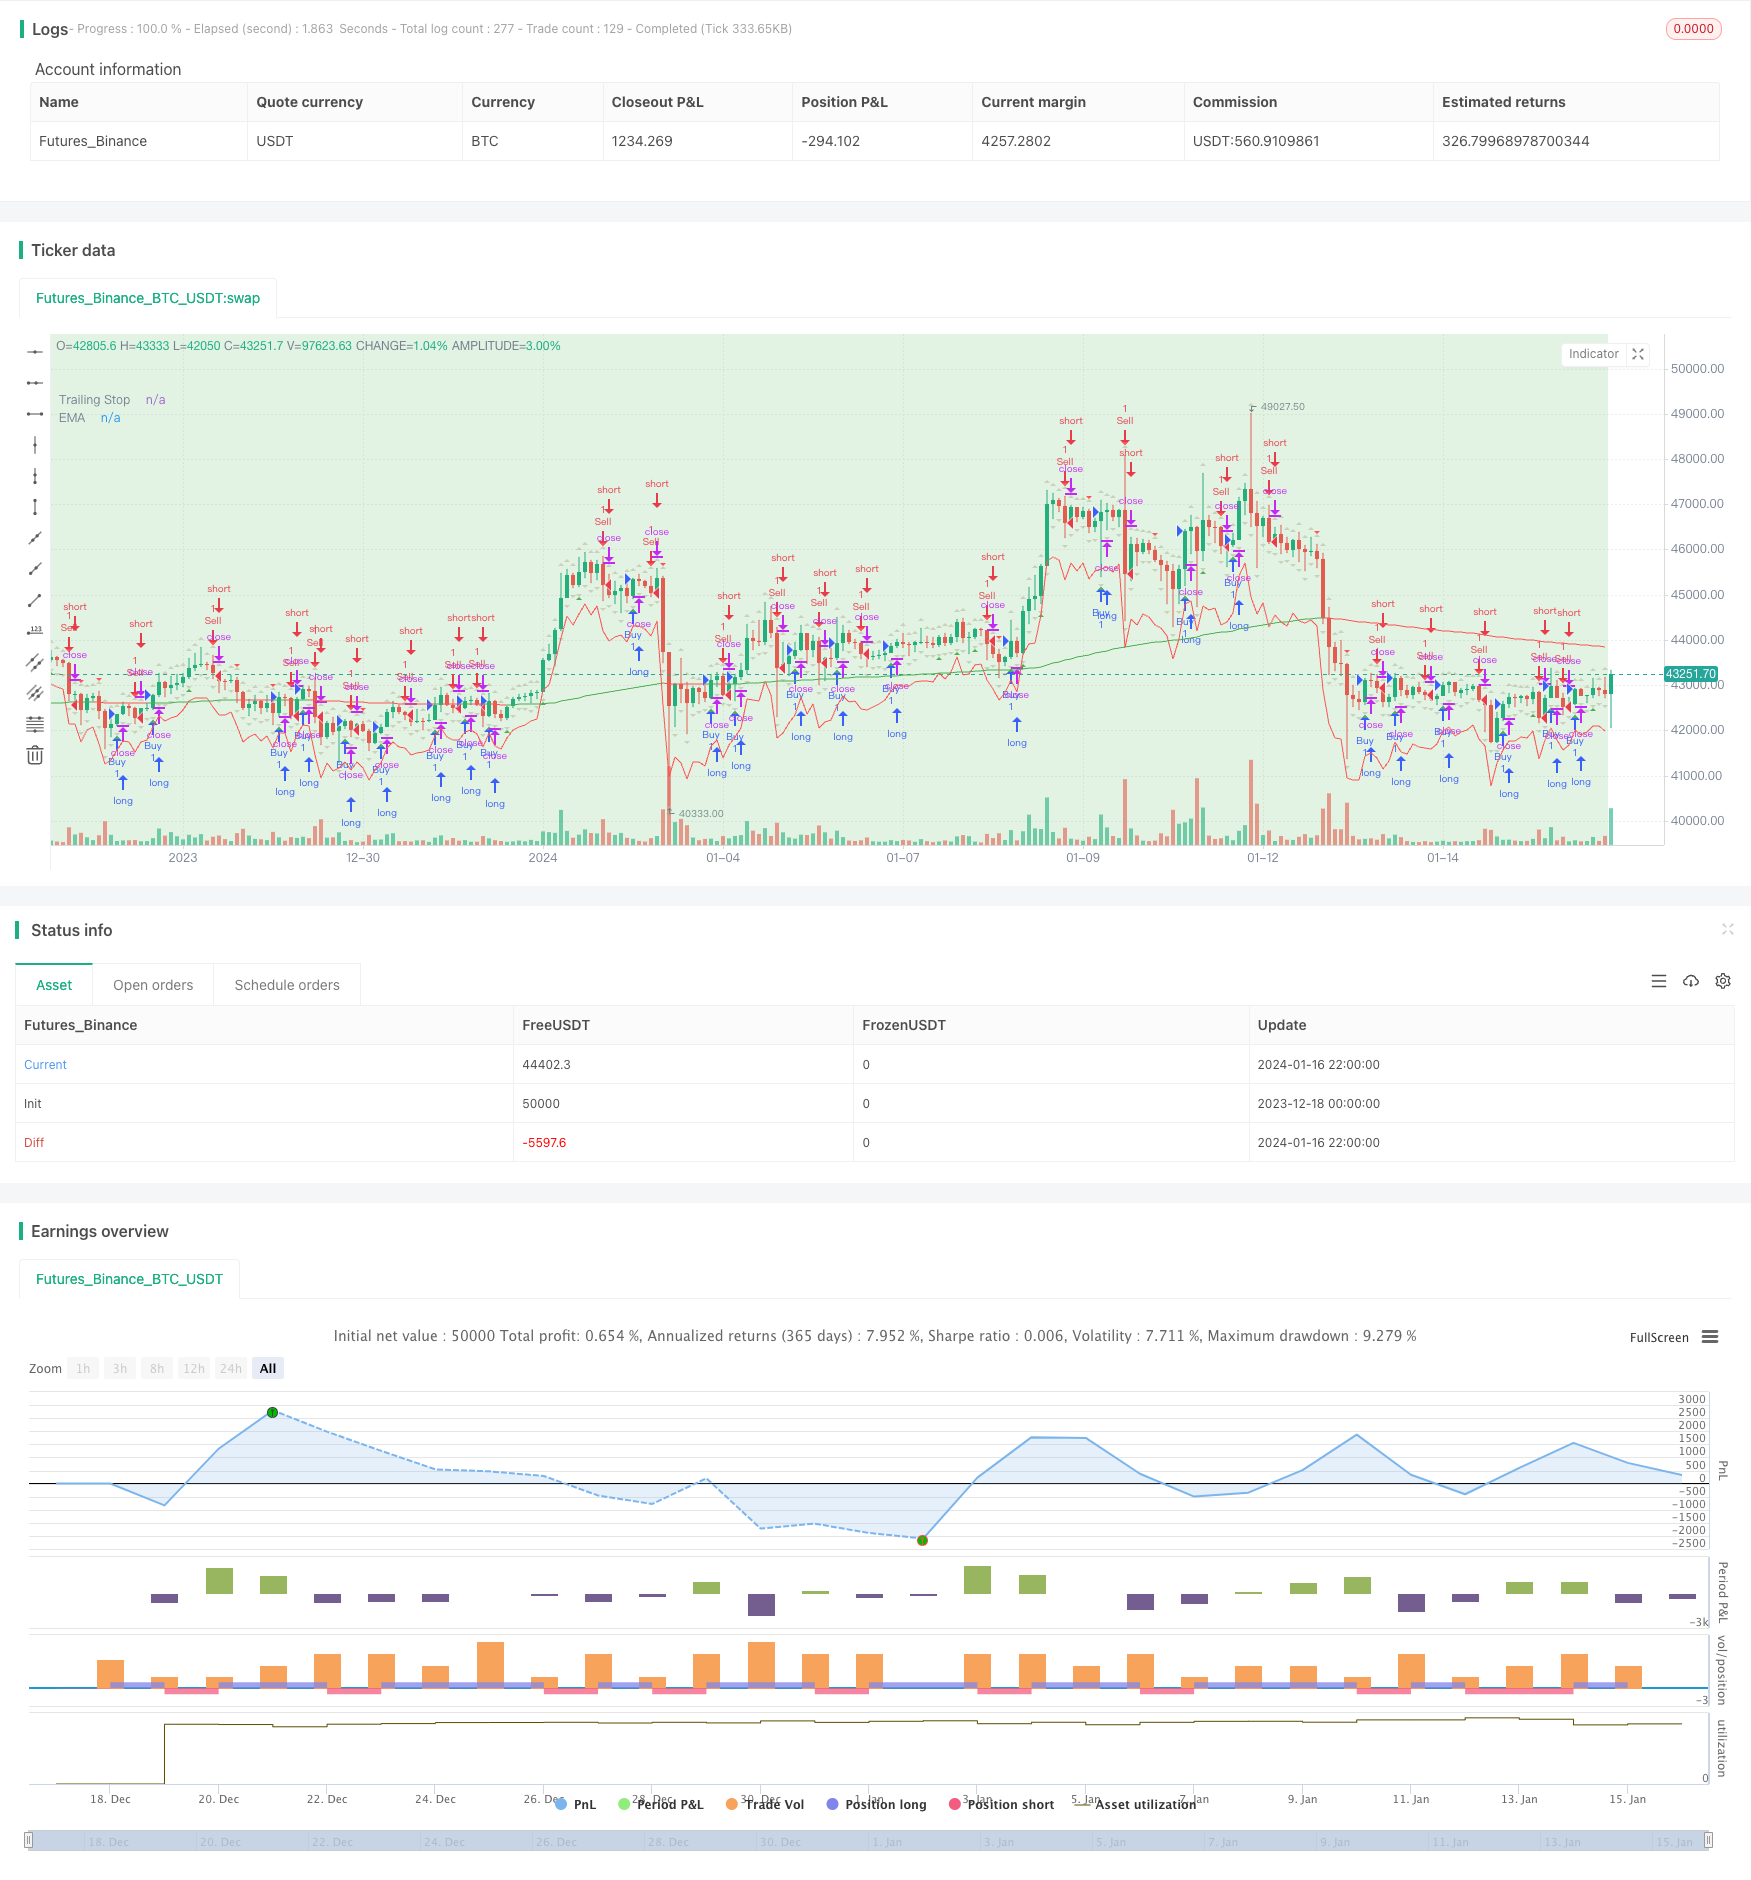
该策略利用供需区域、指数移动平均线(EMA)和平均真实波动范围(ATR)指数型移动止损进行交易信号判断。用户可以调整EMA参数设置和买卖信号的可见性。策略标记更高更高(HH)、更低更低(LL)、更低更高(LH)和更高更低(HL)等供需区域。第三根K线确认信号后发出交易指令。该脚本适合用来回测。
EMA指数移动平均线:
- EMA根据一定周期(默认200)的收盘价计算得到。
- EMA公式:(EMA=(Price_t \times \alpha)+(EMA_{t-1}×(1−\alpha))),其中(\alpha=\frac{2}{length+1})。
ATR平均真实波动幅度:
- ATR是衡量市场波动程度的指标,根据价格的真实波动范围计算。
- 真实波动范围为以下三者之最大值:
- 当前最高价减去当前最低价
- 当前最高价减去上一收盘价的绝对值
- 当前最低价减去上一收盘价的绝对值
- ATR典型计算周期为14。
这些计算用于判断EMA趋势判断和基于市场波动设置ATR移动止损。该策略旨在根据收盘价、EMA和ATR值的关系来提供买卖信号。
策略中使用了“HH”(更高更高)、“LL”(更低更低)、“HL”(更高更低)和“LH”(更低更高)等术语来识别不同的价格行为模式,常用于趋势分析:
-
更高更高(HH):当前价格最高点高于之前的最高点,表示潜在的向上动量。
-
更低更低(LL):当前价格最低点低于之前的最低点,表示潜在的向下动量。
-
更高更低(HL):当前价格最低点高于之前的最低点,表示潜在的向上趋势继续。
-
更低更高(LH):当前价格最高点低于之前的最高点,表示潜在的向下趋势继续。
这些模式与其他技术指标配合使用可以确定潜在趋势的反转或继续。该策略利用这些模式来识别进入或退出的时机。
入场信号:第三根K线收盘价高于/低于前一日最高价/最低价时产生买入/卖出信号。
止损方式:以ATR值的一定倍数(默认2倍)作为后撤止损点。
- 结合了趋势、反转和波动率等多种因素,综合判断市场,避免假突破。
- 利用供需区域判断关键支撑阻力。
- ATR止损系统动态跟踪市场波动。
- 可自定义EMA和ATR参数。
- 简单的入场规则容易实施。
- 误判风险,需适当优化EMA长度。
- ATR倍数设置过大有追涨杀跌风险。
- 可考虑结合其他因素过滤入场信号。
- 可尝试以趋势狙击为主,供需为辅的策略。
该策略综合运用趋势、反转、波动率等多种技术指标和价格形态判断,在回测中表现不俗。但是实盘复杂多变,优化和适当过滤入场信号仍有必要。该策略为基础策略,可在其基础上进行扩展,与其他因素或模型结合。
||
The strategy utilizes supply and demand zones, Exponential Moving Average (EMA), and Average True Range (ATR) trailing stop for trade signals. Users can adjust EMA settings and signal visibility. The strategy marks Higher High (HH), Lower Low (LL), Lower High (LH), and Higher Low (HL) zones. Signals are shown after the third candle, suitable for backtesting.
Exponential Moving Average (EMA):
- EMA is calculated from closing prices over a period (default: 200).
- Formula: EMA = (Price_t x α) + (EMA_t-1 x (1 - α)), where α = 2/(length + 1)
Average True Range (ATR):
- ATR measures market volatility from true range of prices.
- True range is the greatest of:
- Current high minus current low
- Absolute value of current high minus previous close
- Absolute value of current low minus previous close
- ATR typically uses 14 periods.
Used to determine EMA for trend and ATR for volatility-based trailing stop.
It identifies "HH" (Higher High), "LL" (Lower Low), "HL" (Higher Low) and "LH" (Lower High) patterns:
-
Higher High (HH): Current peak > previous peak, upward momentum.
-
Lower Low (LL): Current trough < previous trough, downward momentum.
-
Higher Low (HL): Current trough > previous trough, upward continuation.
-
Lower High (LH): Current peak < previous peak, downward continuation.
Used with trends to identify reversals or continuations.
Entry Signal: Buy/sell on third candle closing above/below previous high/low.
Exit: Trailing stop loss based on ATR.
- Combines trends, reversals, volatility for robust signals.
- Demand/supply zones identify key S/R.
- Dynamic ATR stop adjusts to volatility.
- Customizable parameters.
- Simple entry rules.
- False signals: Optimize EMA length.
- High ATR multiplier risks chasing trends.
- Consider additional filters on entries.
- Test trend-focused approach.
Combines multiple techniques for decent backtests. Real-world is complex, optimization is key. Basic strategy allows extensions and combinations. [/trans]
Strategy Arguments
| Argument | Default | Description |
|---|---|---|
| v_input_1 | true | (?Signals)Show Buy Signals |
| v_input_2 | true | Show Sell Signals |
| v_input_3 | true | (?Zones)Show HL Zone |
| v_input_4 | true | Show LH Zone |
| v_input_5 | true | Show HH Zone |
| v_input_6 | true | Show LL Zone |
| v_input_7 | 200 | (?EMA Settings)EMA Length |
| v_input_8 | 14 | (?Trailing Stop)ATR Length |
| v_input_9 | 2 | ATR Multiplier |
Source (PineScript)
/*backtest
start: 2023-12-18 00:00:00
end: 2024-01-17 00:00:00
period: 2h
basePeriod: 15m
exchanges: [{"eid":"Futures_Binance","currency":"BTC_USDT"}]
*/

//@version=5
strategy("Supply and Demand Zones with EMA and Trailing Stop", shorttitle="SD Zones", overlay=true)

showBuySignals = input(true, title="Show Buy Signals", group="Signals")
showSellSignals = input(true, title="Show Sell Signals", group="Signals")
showHLZone = input(true, title="Show HL Zone", group="Zones")
showLHZone = input(true, title="Show LH Zone", group="Zones")
showHHZone = input(true, title="Show HH Zone", group="Zones")
showLLZone = input(true, title="Show LL Zone", group="Zones")

emaLength = input(200, title="EMA Length", group="EMA Settings")
atrLength = input(14, title="ATR Length", group="Trailing Stop")
atrMultiplier = input(2, title="ATR Multiplier", group="Trailing Stop")

// Function to identify supply and demand zones
getZones(src, len, mult) =>
    base = request.security(syminfo.tickerid, "D", close)
    upper = request.security(syminfo.tickerid, "D", high)
    lower = request.security(syminfo.tickerid, "D", low)
    multiplier = request.security(syminfo.tickerid, "D", mult)
    zonetype = base + multiplier * len
    zone = src >= zonetype
    [zone, upper, lower]

// Identify supply and demand zones
[supplyZone, _, _] = getZones(close, high[1] - low[1], 1)
[demandZone, _, _] = getZones(close, high[1] - low[1], -1)

// Plot supply and demand zones
bgcolor(supplyZone ? color.new(color.red, 80) : na)
bgcolor(demandZone ? color.new(color.green, 80) : na)

// EMA with Linear Weighted method
ema = ta.ema(close, emaLength)

// Color code EMA based on its relation to candles
emaColor = close > ema ? color.new(color.green, 0) : close < ema ? color.new(color.red, 0) : color.new(color.yellow, 0)

// Plot EMA
plot(ema, color=emaColor, title="EMA")

// Entry Signal Conditions after the third candle
longCondition = ta.crossover(close, high[1]) and bar_index >= 2
shortCondition = ta.crossunder(close, low[1]) and bar_index >= 2

// Trailing Stop using ATR
atrValue = ta.atr(atrLength)
trailStop = close - atrMultiplier * atrValue

// Strategy Entry and Exit
if (longCondition)
    strategy.entry("Buy", strategy.long)
    strategy.exit("TrailStop", from_entry="Buy", loss=trailStop)

if (shortCondition)
    strategy.entry("Sell", strategy.short)
    strategy.exit("TrailStop", from_entry="Sell", loss=trailStop)

// Plot Entry Signals
plotshape(series=showBuySignals ? longCondition : na, title="Buy Signal", color=color.new(color.green, 0), style=shape.triangleup, location=location.belowbar)
plotshape(series=showSellSignals ? shortCondition : na, title="Sell Signal", color=color.new(color.red, 0), style=shape.triangledown, location=location.abovebar)

// Plot Trailing Stop
plot(trailStop, color=color.new(color.red, 0), title="Trailing Stop")

// Plot HH, LL, LH, and HL zones
plotshape(series=showHHZone and ta.highest(high, 2)[1] and ta.highest(high, 2)[2] ? 1 : na, title="HH Zone", color=color.new(color.blue, 80), style=shape.triangleup, location=location.abovebar)
plotshape(series=showLLZone and ta.lowest(low, 2)[1] and ta.lowest(low, 2)[2] ? 1 : na, title="LL Zone", color=color.new(color.blue, 80), style=shape.triangledown, location=location.belowbar)
plotshape(series=showLHZone and ta.highest(high, 2)[1] and ta.lowest(low, 2)[2] ? 1 : na, title="LH Zone", color=color.new(color.orange, 80), style=shape.triangleup, location=location.abovebar)
plotshape(series=showHLZone and ta.lowest(low, 2)[1] and ta.highest(high, 2)[2] ? 1 : na, title="HL Zone", color=color.new(color.orange, 80), style=shape.triangledown, location=location.belowbar)
Detail
https://www.fmz.com/strategy/439275
Last Modified
2024-01-18 16:41:16
