Name
基于动态支撑阻力带的趋势跟踪策略Trend-Tracking-Strategy-Based-on-Dynamic-Pivot-Bands
Author
ChaoZhang
Strategy Description
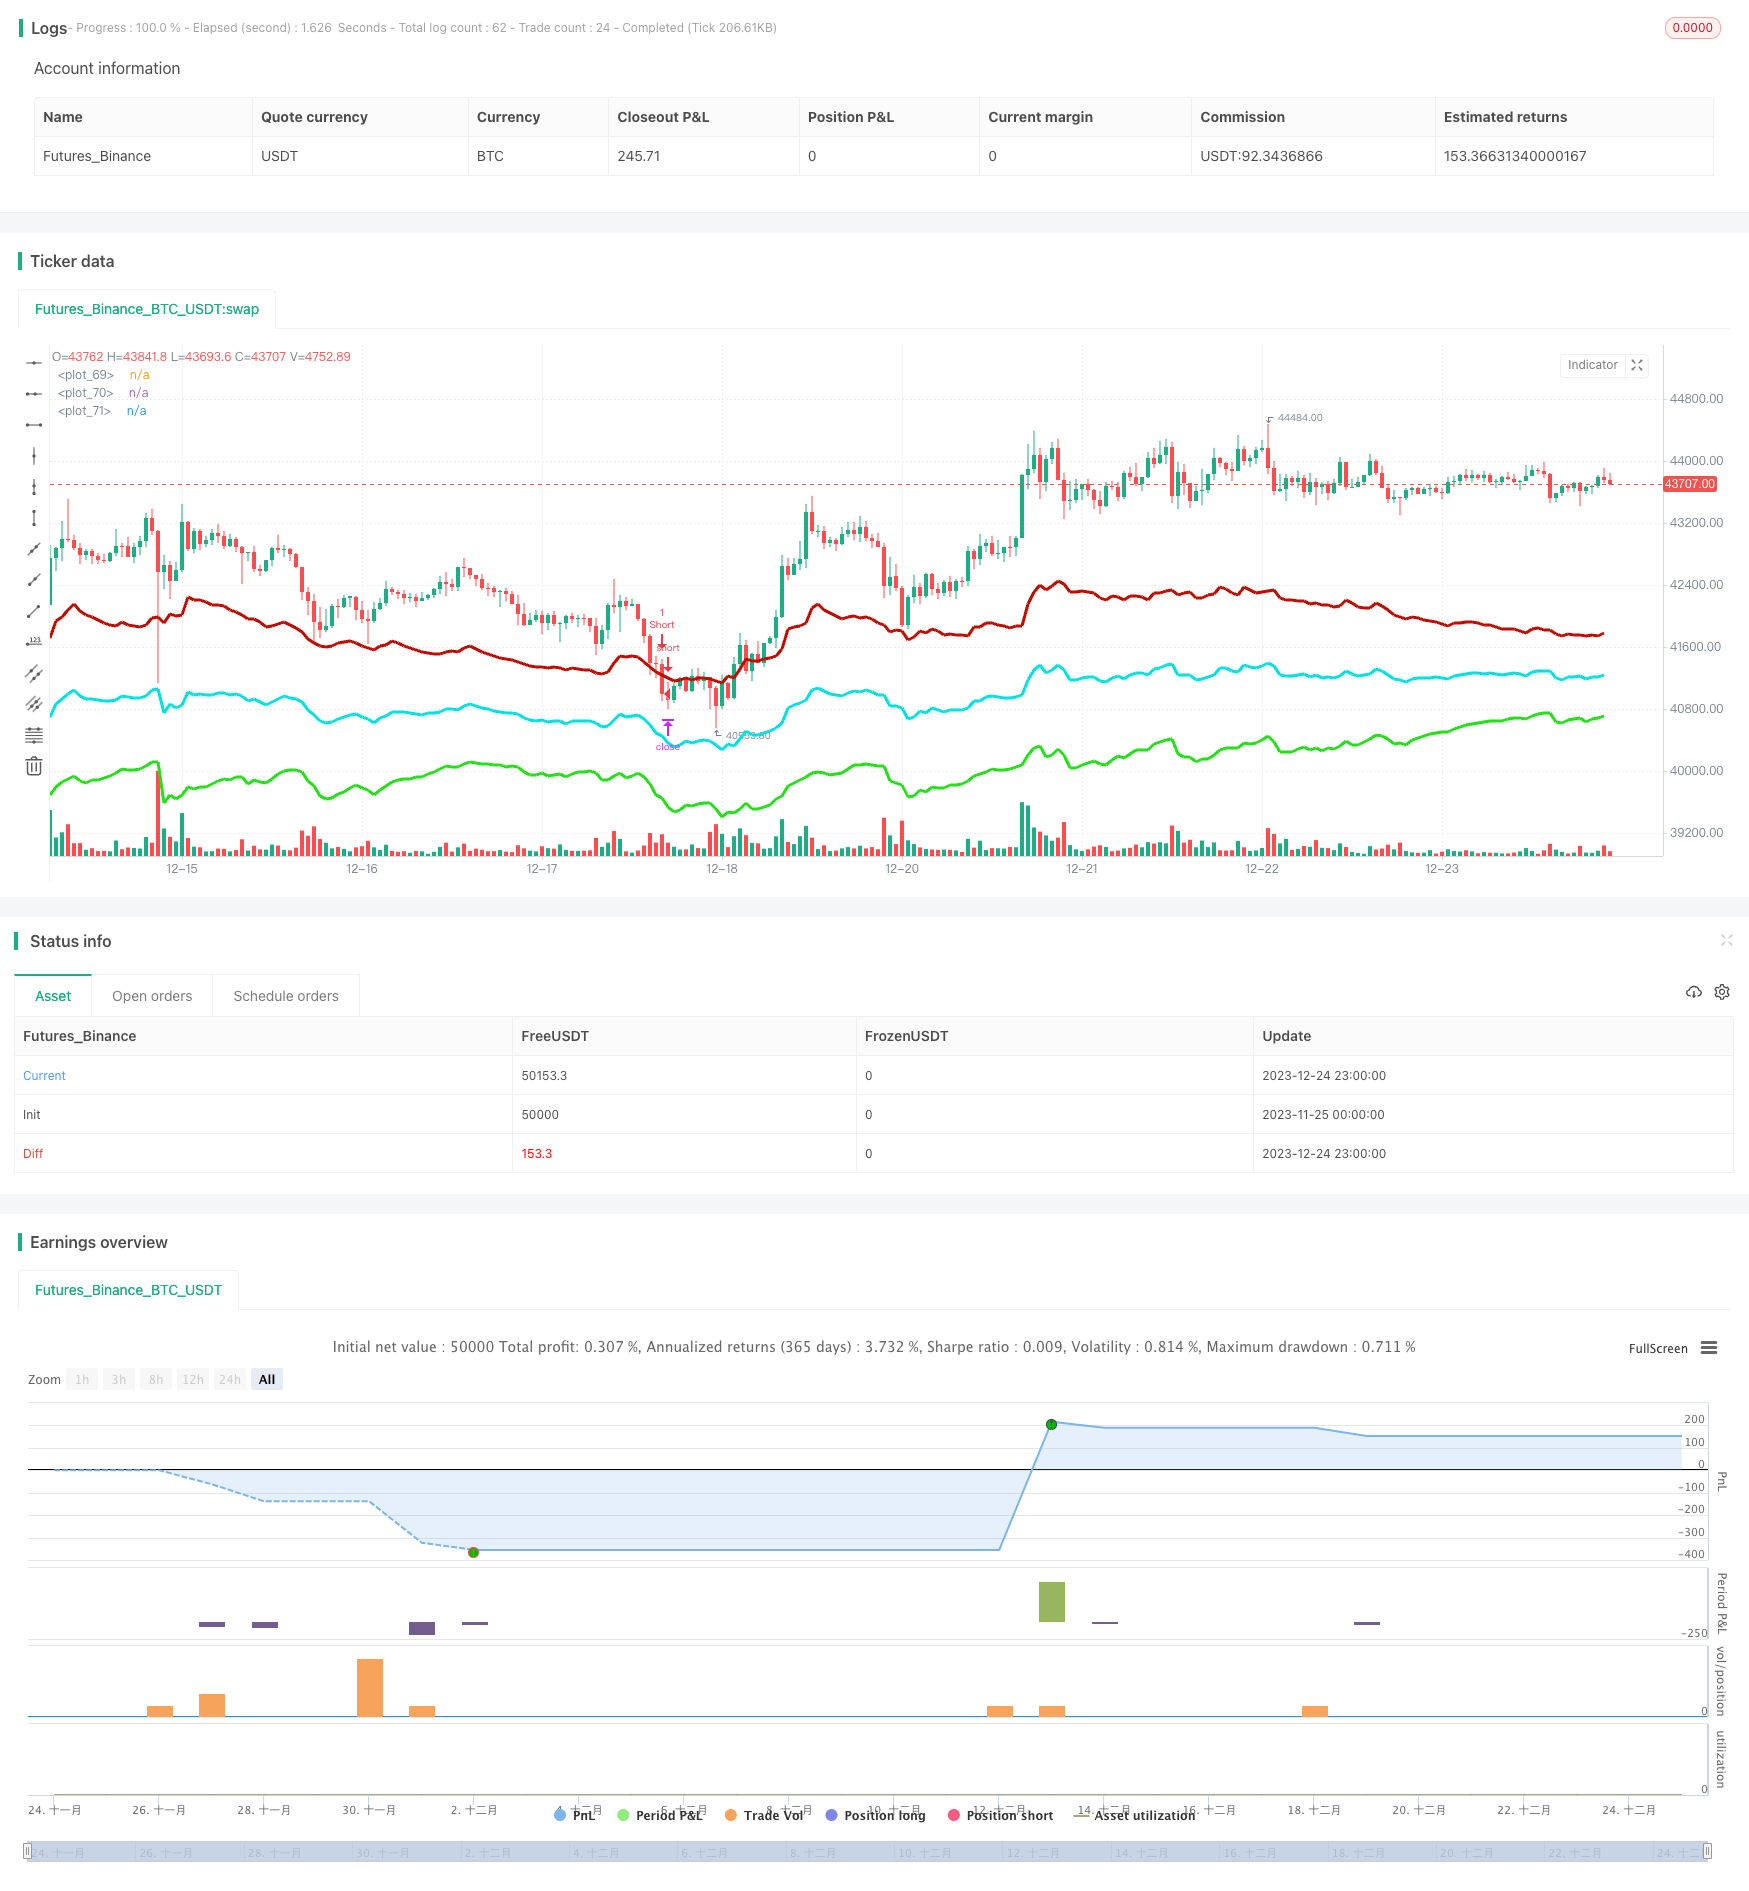
该策略通过计算最近一定时间段内的最高价和最低价,结合当前价格,形成一个动态的中轴线。然后根据最近的波动率生成红色下行通道和绿色上行通道。这三条通道线构成一个可交易范围。当价格接近通道边界时,做反向操作,目标是回到中轴线上获利。同时,策略内部包含一个趋势计算,用于过滤不顺趋势的交易,防止被大趋势捣毁。
- 计算最近N周期内的最高价和最低价,结合当前收盘价形成动态中轴线
- 根据ATR和乘数生成动态通道带,带宽随市场波动率变化
- 当价格从下方通道线反弹时做多,从上方通道线反弹时做空
- 有止盈和止损逻辑,目标回到中轴线停利
- 同时计算趋势指数,用于过滤不顺势的交易
- 通道线位置动态变化,能实时捕捉市场波动率
- 顺势交易概率较大,有利于把握趋势
- 有止损逻辑控制单笔损失
- 参数优化不当可能导致过度交易
- 大趋势下无法完全滤除逆势交易
- 单边突破通道线可能继续运行
- 调整通道线的参数,使其更符合不同品种的特点
- 调整趋势指数参数,提高顺势概率
- 增加机器学习元素,使参数动态优化
该策略主要依赖市场的震荡特征获利。通过动态通道捕捉价格反转点,并结合趋势过滤,可以有效利用反转交易获利,同时控制风险。关键在与参数的调节,需要使通道线既能实时跟踪价格,又不会过于敏感。同时趋势指数也需要选取合适周期才能发挥过滤作用。该策略理论顺势且有止损,实际运用中通过参数优化可以获得不错回报。
||
This strategy calculates the recent highest and lowest prices over a certain period, combined with the current price, to form a dynamic middle line. Red downside channel and green upside channel are then generated based on recent volatility. The three channel lines form a tradable range. When the price approaches the channel boundaries, reverse operations are carried out targeting profits back to the middle line. Meanwhile, there is a trend calculation inside the strategy to filter trades against the trend and avoid being destroyed by the major trend.
- Calculate dynamic middle line with recent highest price, lowest price and current close price
- Generate dynamic bands based on ATR and multiplier, width changes with market volatility
- Go long when price bounces off the bottom band, go short when bounces off the top band
- Have take profit and stop loss logic targeting middle line
- Meanwhile calculate trend index to filter trades against trend
- Dynamic bands adapt to real-time market volatility
- High probability of trading along trend
- Stop loss controls single loss
- Improper parameter optimization may lead to overtrading
- Unable to completely eliminate counter-trend trades under major trends
- One-sided breakout may continue running
- Adjust parameters of bands to fit different products
- Fine tune trend index parameters to improve trend-trading probability
- Introduce machine learning elements for dynamic parameter optimization
This strategy mainly relies on the oscillation of the market to make profits. By capturing price reversal points dynamically with the bands, combined with trend filtering, it can effectively profit from mean-reversion while controlling risks. The key lies in parameter tuning to make the bands responsive yet not oversensitive. The trend index also needs proper periods to play its role. With theoretical favorable trend and stops, this strategy can achieve decent returns through optimization.
[/trans]
Strategy Arguments
| Argument | Default | Description |
|---|---|---|
| v_input_1 | 24 | Pivot Length, defines lookback for highs and lows to make pivots |
| v_input_2 | 22 | ATR lookback (Lower = bands more responsive to recent price action) |
| v_input_3 | 3 | ATR multiplier (Lower = wider bands) |
| v_input_4 | 2 | Momentum Period |
| v_input_5 | 20 | Slow Period |
| v_input_6 | 5 | Fast Period |
| v_input_7 | 3 | Smoothing Period |
| v_input_8 | 4 | Signal Period |
| v_input_9 | 50 | Extreme Value |
| v_input_10 | false | Take Profit (In Market MinTick Value) |
| v_input_11 | 100 | Stop Loss (In Market MinTick Value) |
Source (PineScript)
/*backtest
start: 2023-11-25 00:00:00
end: 2023-12-25 00:00:00
period: 1h
basePeriod: 15m
exchanges: [{"eid":"Futures_Binance","currency":"BTC_USDT"}]
*/

//@version=4
strategy(title="Strategy - Bobo PAPATR", overlay=true, default_qty_type = strategy.fixed, default_qty_value = 1, initial_capital = 10000)

// === STRATEGY RELATED INPUTS AND LOGIC ===
len = input(24, minval=1, title="Pivot Length, defines lookback for highs and lows to make pivots")
length = input(title="ATR lookback (Lower = bands more responsive to recent price action)", type=input.integer, defval=22)
myatr = atr(length)
dailyatr = myatr[1]
atrmult = input(title="ATR multiplier (Lower = wider bands)", type=input.float, defval=3)
pivot0 = (high[1] + low[1]  + close[1]) / 3

// PIVOT CALC
h = highest(len)
h1 = dev(h, len) ? na : h
hpivot = fixnan(h1)
l = lowest(len)
l1 = dev(l, len) ? na : l
lpivot = fixnan(l1)
pivot = (lpivot + hpivot + pivot0) / 3
upperband1 = (dailyatr * atrmult) + pivot
lowerband1 = pivot - (dailyatr * atrmult)
middleband = pivot

// == TREND CALC ===
i1=input(2, "Momentum Period", minval=1) //Keep at 2 usually
i2=input(20, "Slow Period", minval=1)
i3=input(5, "Fast Period", minval=1)
i4=input(3, "Smoothing Period", minval=1)
i5=input(4, "Signal Period", minval=1)
i6=input(50, "Extreme Value", minval=1)
hiDif = high - high[1]
loDif = low[1] - low
uDM = hiDif > loDif and hiDif > 0 ? hiDif : 0
dDM =  loDif > hiDif and loDif > 0 ? loDif : 0
ATR = rma(tr(true), i1)
DIu = 100 * rma(uDM, i1) / ATR
DId = 100 * rma(dDM, i1) / ATR
HLM2 =  DIu - DId
DTI = (100 * ema(ema(ema(HLM2, i2), i3), i4)) /  ema(ema(ema(abs(HLM2), i2), i3), i4)
signal = ema(DTI, i5)


// === RISK MANAGEMENT INPUTS ===
inpTakeProfit   = input(defval = 0, title = "Take Profit (In Market MinTick Value)", minval = 0)
inpStopLoss     = input(defval = 100, title = "Stop Loss (In Market MinTick Value)", minval = 0)

// === RISK MANAGEMENT VALUE PREP ===
// if an input is less than 1, assuming not wanted so we assign 'na' value to disable it.
useTakeProfit   = inpTakeProfit  >= 1 ? inpTakeProfit  : na
useStopLoss     = inpStopLoss    >= 1 ? inpStopLoss    : na

// === STRATEGY - LONG POSITION EXECUTION ===
enterLong = (((low<=lowerband1) and (close >lowerband1)) or ((open <= lowerband1) and (close > lowerband1))) and (strategy.opentrades <1) and (atr(3) > atr(50)) and (signal>signal[3])
exitLong = (high > middleband)
strategy.entry(id = "Long", long = true, when = enterLong)
strategy.close(id = "Long", when = exitLong)

// === STRATEGY - SHORT POSITION EXECUTION ===
enterShort = (((high>=upperband1) and (close < upperband1)) or ((open >= upperband1) and (close < upperband1))) and (strategy.opentrades <1) and (atr(3) > atr(50)) and (signal<signal[3])
exitShort = (low < middleband)
strategy.entry(id = "Short", long = false, when = enterShort)
strategy.close(id = "Short", when = exitShort)

// === STRATEGY RISK MANAGEMENT EXECUTION ===
strategy.exit("Exit Long", from_entry = "Long", profit = useTakeProfit, loss = useStopLoss)
strategy.exit("Exit Short", from_entry = "Short", profit = useTakeProfit, loss = useStopLoss)

// === CHART OVERLAY ===
plot(upperband1, color=#C10C00, linewidth=3)
plot(lowerband1, color=#23E019, linewidth=3)
plot(middleband, color=#00E2E2, linewidth=3)
//plot(strategy.equity, title="equity", color=red, linewidth=2, style=areabr)
Detail
https://www.fmz.com/strategy/436614
Last Modified
2023-12-26 11:57:20
