Name
基于动量指标的自适应交易策略Adaptive-Trading-Strategy-Based-on-Momentum-Indicators
Author
ChaoZhang
Strategy Description
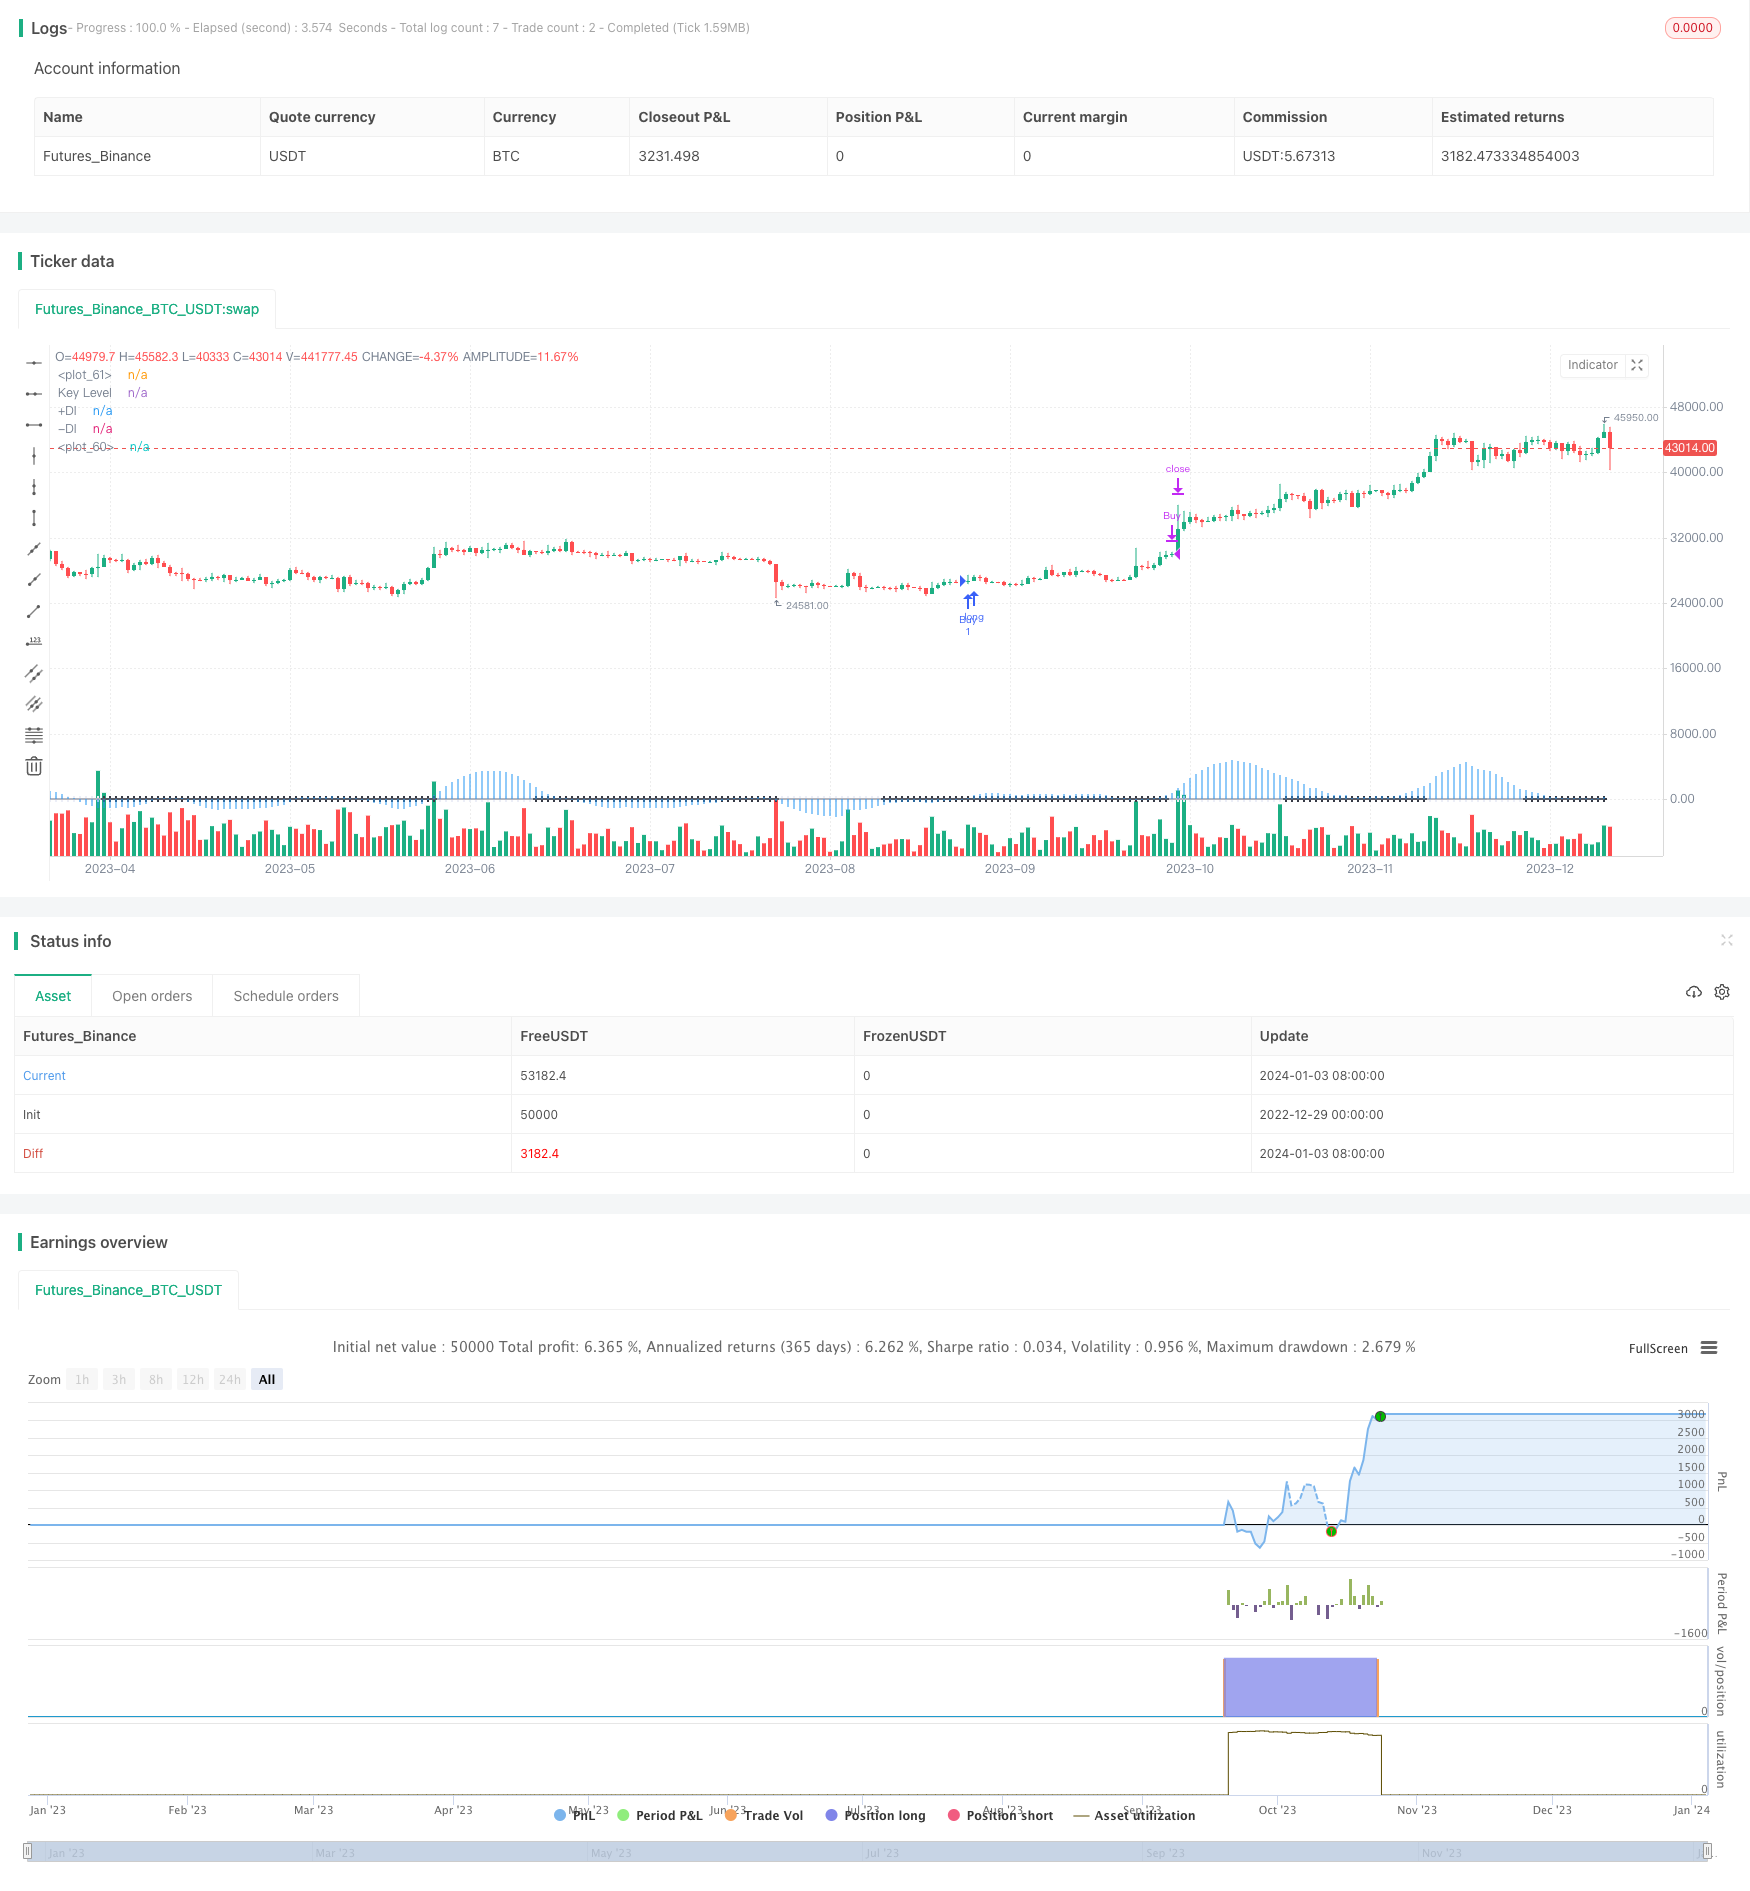
该策略是一个基于动量指标的自适应股票交易策略。它整合了布林带、Keltner通道和价格压缩指标,实现了趋势判断、突破点识别和止损退出的全自动交易。
该策略主要通过布林带和Keltner通道构建价格通道,识别通道突破形成交易信号。当价格从下向上突破通道时,采取看涨操作;当价格从上向下突破通道时,采取看跌操作。此外,策略还使用价格压缩指标判定目前处于价格通道内时,根据指标差值的正负采取相应的操作。
具体来说,布林带通过计算价格的标准差,得到上下轨;Keltner通道通过计算价格的平均值±平均波动范围,得到上下轨。当两者 channel 发生fdopen时,认为行情进入盘整,等待下一次突破。价格压缩指标反映价格是否被压缩在两个通道内,根据压缩指标差值的正负情况判断行情方向。
综上,该策略融合多种指标判断价格走势,形成清晰的长短逻辑,可以有效过滤假突破,识别高概率的交易机会。
-
整合多种指标,判断力强。指标组合实现互补,可以提高识别准确率。
-
压缩指标差值判定,减少假突破。指标差值作为辅助条件,避免无谓交易。
-
自适应通道止损,有效控制风险。通道作为止损位置,可以根据市场波动自动调整,减少亏损。
-
简单参数设定,适合自动化。只有几个主要参数,便于测试优化,易于集成到自动交易系统。
-
多空转换频繁时,会增多交易次数。行情震荡时,可能导致频繁开仓平仓。
-
指标参数不当可能错过训练好的机会。需要充分测试优化,找到最佳参数。
-
仅适合具有明确方向的股价,不适合极度震荡的市场。指标容易被迷惑,产生错误信号。
-
增加仓位控制模块,优化资金利用效率。例如根据突破强度分配资金等。
-
增加机器学习模型动态调整指标参数。让指标参数能自动适应不同周期、不同股票。
-
增强止损策略,引入更多辅助指标判断止损时机。改进后可以在关键点减少止损次数。
该策略整合布林带、Keltner通道和价格压缩指标,形成清晰的判断逻辑和风险控制体系。它融合趋势判断和突破操作,可以自动适应行情,识别高概率交易机会。通过参数优化和辅助条件增加,该策略可以进一步强化,成为量化交易的重要工具。
||
This strategy is an adaptive stock trading strategy based on momentum indicators. It integrates Bollinger Bands, Keltner Channels and price squeeze indicator to achieve trend judgment, breakthrough point identification and stop-loss exit for automated trading.
The core of this strategy is to build a price channel through Bollinger Bands and Keltner Channels and identify trading signals when price breaks through the channel. It will take long position when price breaks up the channel and take short position when price breaks down the channel. In addition, when price is squeezed in the channel, the strategy will determine the operation direction based on the positive and negative value of the price squeeze indicator.
Specifically, Bollinger Bands calculates standard deviation of price to plot the upper and lower rail; Keltner Channels plots the upper and lower rail based on average price ± average volatility range. When channel fusion happens between the two, it is considered that the market enters consolidation while waiting for the next breakout. The price squeeze indicator reflects whether the price is compressed between the two channels. The strategy determines the market direction based on the positive and negative value of the squeeze indicator.
In summary, this strategy integrates multiple indicators to judge the price movement and form a clear long and short logic, which can effectively filter false breakouts and identify high probability trading opportunities.
-
Integrates multiple indicators with strong judgment capability. The combination of indicators can improve accuracy.
-
Squeeze indicator difference to determine, reduce false breakout. The indicator difference serves as an auxiliary condition to avoid unnecessary trading.
-
Adaptive channel stop loss, effectively manage risks. The channel serves as the stop-loss position, which can adjust automatically based on market fluctuation to reduce losses.
-
Simple parameter settings, suitable for automation. With only a few key parameters, it is easy to test, optimize and integrate into automated trading systems.
-
Frequent long-short switch when market fluctuates sharply, leading to increased number of trades.
-
Improper indicator parameters may miss good trading opportunities. Requires sufficient testing and optimization to find the optimal parameters.
-
Only applicable to stocks with a clear direction, not suitable for extremely volatile markets. Indicators can be easily misguided and produce false signals.
-
Increase position control module to optimize capital utilization efficiency. For example, allocate capital based on the breakout strength.
-
Increase machine learning model to dynamically adjust indicator parameters, allowing indicators to automatically adapt to different cycles and different stocks.
-
Enhance the stop loss strategy by introducing more auxiliary indicators to determine the stop loss timing. Improved strategy can reduce the number of stop losses at key points.
This strategy integrates Bollinger Bands, Keltner Channels and price squeeze indicator to form a clear logic for judgement and risk control system. It combines trend judgment and breakout operations, can automatically adapt to market conditions and identify high probability trading opportunities. With further parameter optimization and auxiliary conditions improvement, this strategy can be further strengthened into an important tool for quantitative trading. [/trans]
Strategy Arguments
| Argument | Default | Description |
|---|---|---|
| v_input_1 | 20 | BB Length |
| v_input_2 | 2 | BB MultFactor |
| v_input_3 | 20 | KC Length |
| v_input_4 | 1.5 | KC MultFactor |
| v_input_5 | true | Use TrueRange (KC) |
| v_input_6 | 14 | ADX Smoothing |
| v_input_7 | 14 | DI Length |
| v_input_8 | 23 | Key Level for ADX |
Source (PineScript)
/*backtest
start: 2022-12-29 00:00:00
end: 2024-01-04 00:00:00
period: 1d
basePeriod: 1h
exchanges: [{"eid":"Futures_Binance","currency":"BTC_USDT"}]
*/

// This Pine Script™ code is subject to the terms of the Mozilla Public License 2.0 at https://mozilla.org/MPL/2.0/
// © juliopetronilo

//@version=4
strategy("DMI/ADX/Squeeze Robot", shorttitle="DMI/ADX/SQZ", overlay=true)

// Squeeze Momentum Indicator
length = input(20, title="BB Length")
mult = input(2.0, title="BB MultFactor")
lengthKC = input(20, title="KC Length")
multKC = input(1.5, title="KC MultFactor")
useTrueRange = input(true, title="Use TrueRange (KC)")

source = close
basis = sma(source, length)
dev = multKC * stdev(source, length)
upperBB = basis + dev
lowerBB = basis - dev

ma = sma(source, lengthKC)
rangeKC = useTrueRange ? tr : (high - low)
rangema = sma(rangeKC, lengthKC)
upperKC = ma + rangema * multKC
lowerKC = ma - rangema * multKC

sqzOn = (lowerBB > lowerKC) and (upperBB < upperKC)
sqzOff = (lowerBB < lowerKC) and (upperBB > upperKC)
noSqz = not (sqzOn or sqzOff)

val = linreg(source - avg(avg(highest(high, lengthKC), lowest(low, lengthKC)), sma(close, lengthKC)), lengthKC, 0)

// DMI/ADX Plot
adxlen = input(14, title="ADX Smoothing")
dilen = input(14, title="DI Length")
keyLevel = input(23, title="Key Level for ADX")

dirmov(len) =>
    up = change(high)
    down = -change(low)
    truerange = rma(tr, len)
    plus = fixnan(100 * rma(up > down and up > 0 ? up : 0, len) / truerange)
    minus = fixnan(100 * rma(down > up and down > 0 ? down : 0, len) / truerange)
    [plus, minus]

adx(dilen, adxlen) =>
    [plus, minus] = dirmov(dilen)
    sum = plus + minus
    adx_val = abs(plus - minus) / (sum == 0 ? 1 : sum) * 100
    [adx_val, plus, minus]

[sig, up, down] = adx(dilen, adxlen)

// Estrategia de Trading
strategy.entry("Buy", strategy.long, when=sqzOn and crossover(up, down) and crossover(val, 0))
strategy.entry("Sell", strategy.short, when=sqzOn and crossunder(up, down) and crossunder(val, 0))
strategy.close("Buy", when=sqzOff)
strategy.close("Sell", when=sqzOff)

// Plot de los indicadores
plot(val, color=color.blue, style=plot.style_histogram, linewidth=4)
plot(0, color=noSqz ? color.blue : sqzOn ? color.black : color.rgb(236, 238, 247), style=plot.style_cross, linewidth=2)
plot(up, color=color.blue, title="+DI")
plot(down, color=color.gray, title="-DI")
plot(keyLevel, color=color.white, title="Key Level")
Detail
https://www.fmz.com/strategy/437742
Last Modified
2024-01-05 11:43:25
