Name
基于动量指标的趋势跟踪突破交易策略Momentum-Breakout-Trading-Strategy
Author
ChaoZhang
Strategy Description
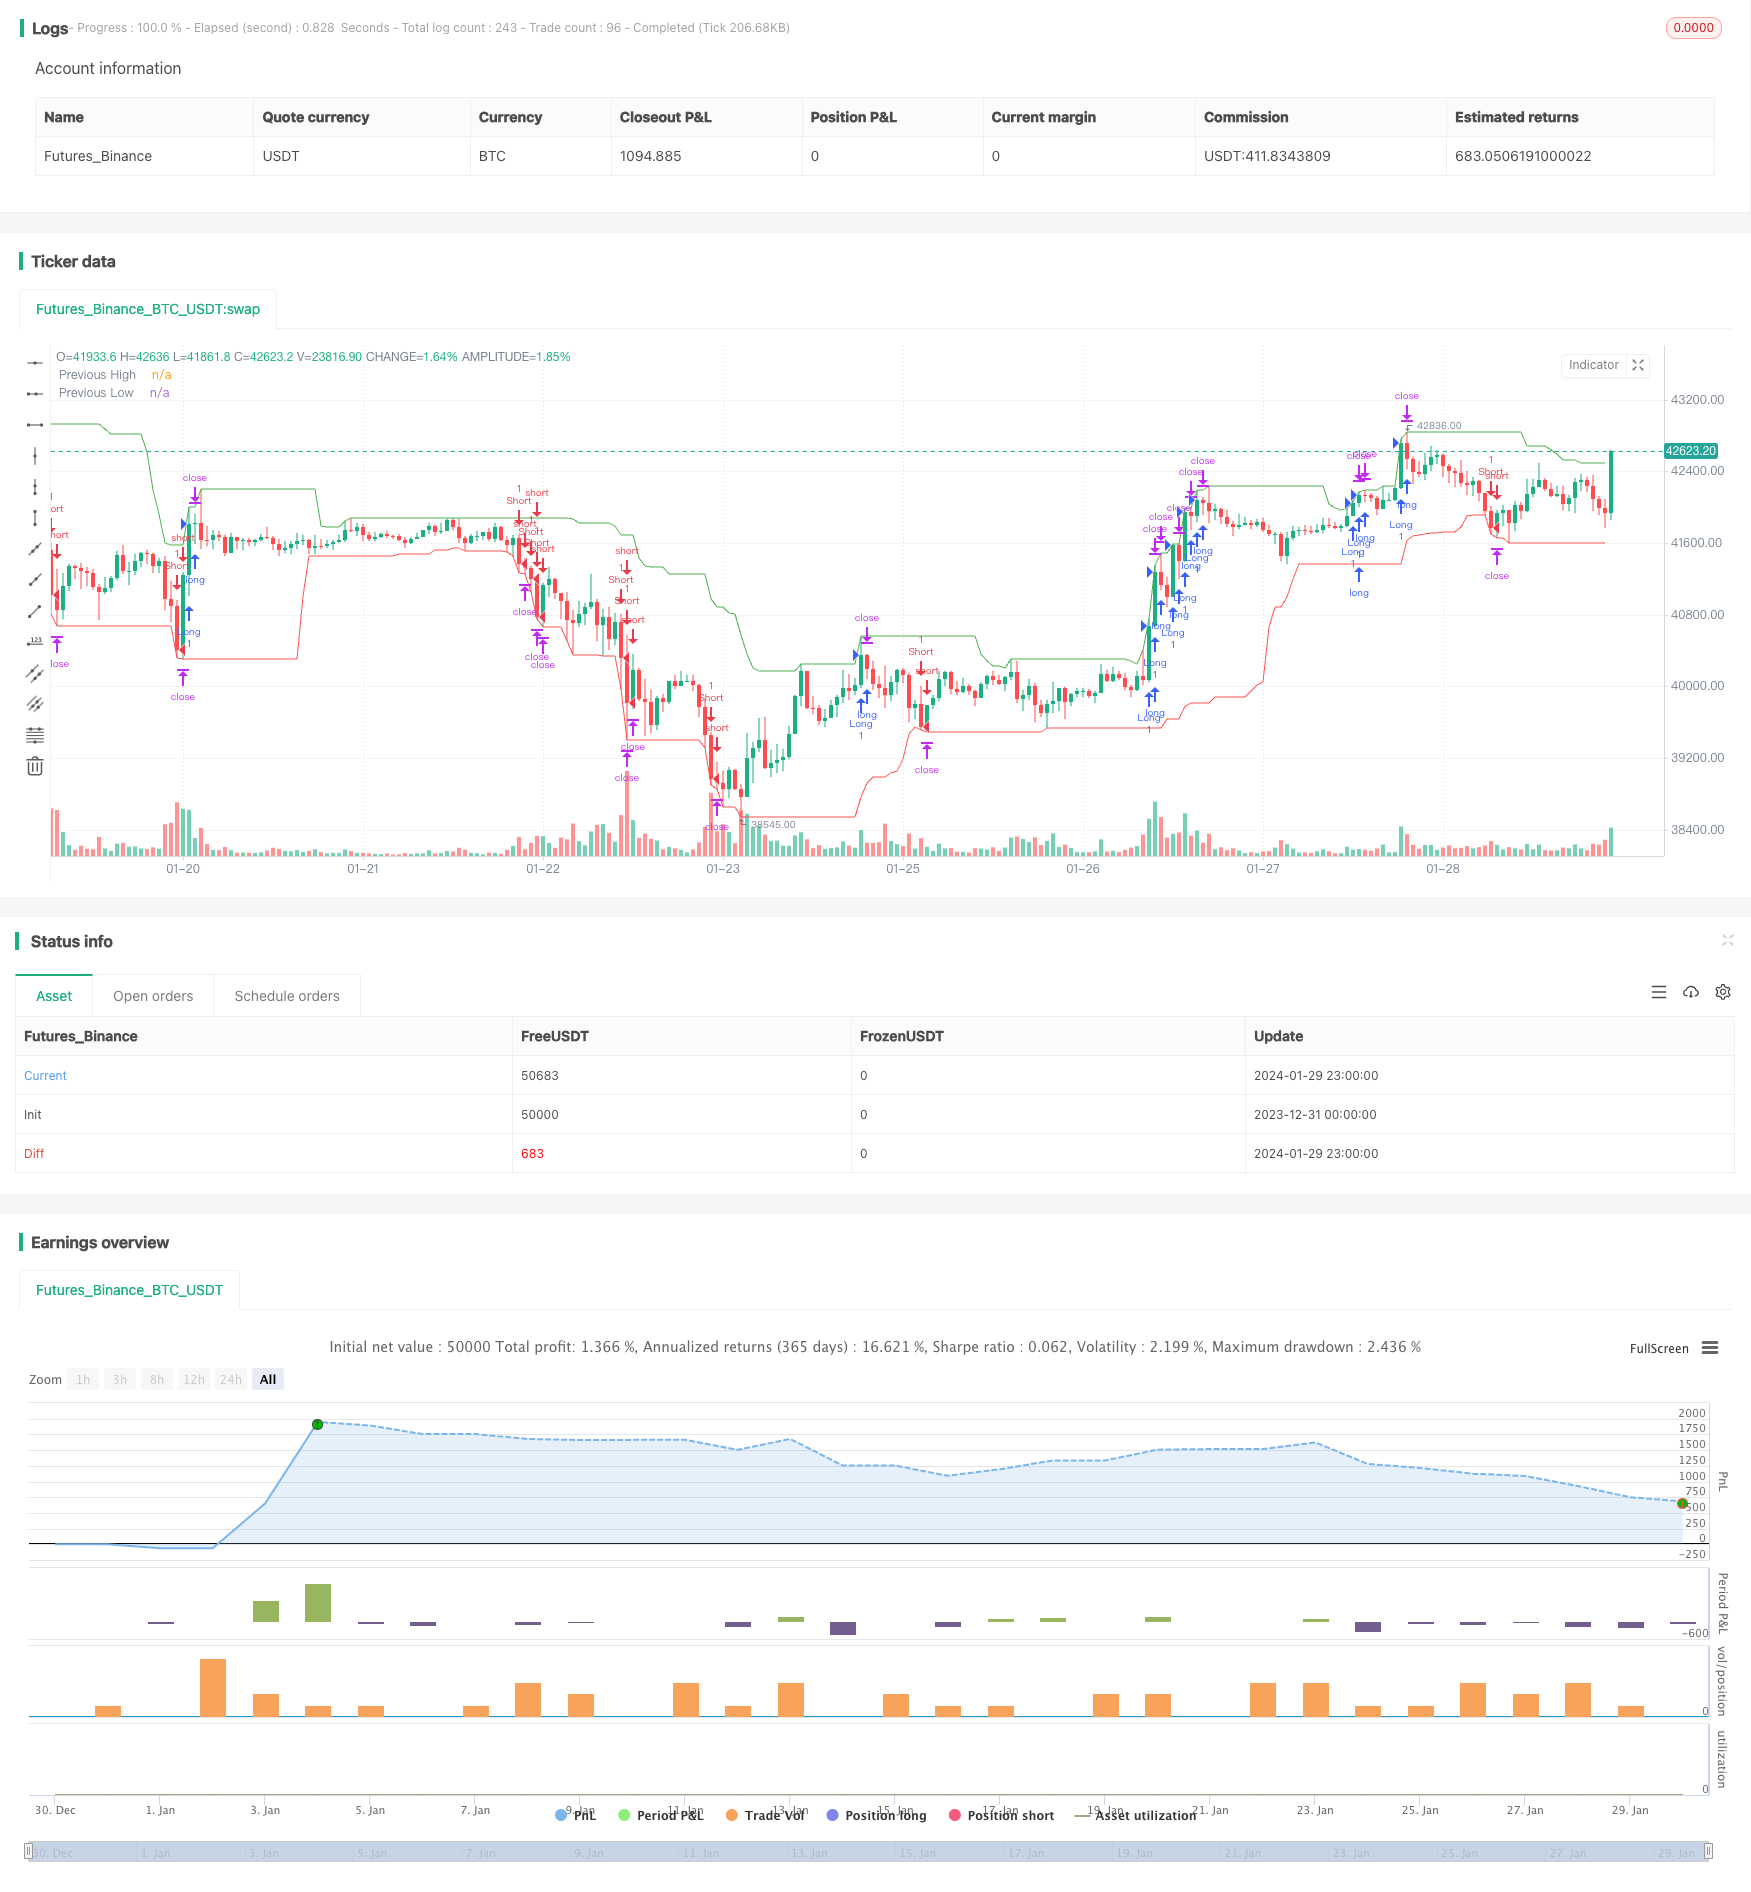
该策略是一个基于动量指标的趋势跟踪突破交易策略。它通过计算一定周期内的最高价和最低价,判断市场趋势方向,并在价格突破关键价格位时进行买入或卖出操作。
该策略的核心逻辑是:
-
使用highest()和lowest()函数计算最近20根K线的最高价和最低价,作为判断趋势的动量指标。
-
当最新收盘价超过上一周期最高价时,进行买入操作,进入多头仓位。此为向上突破信号。
-
当最新收盘价低于上一周期最低价时,进行卖出操作,进入空头仓位。此为向下突破信号。
-
为控制风险,设置1%的止损距离和2%的止盈距离。即盈亏比为2:1。
-
绘图显示最近20根K线内的最高价和最低价,以直观判断趋势方向和突破情况。
以上就是该策略的核心交易逻辑。它利用动量指标判断趋势方向,在价格突破关键价格位时进行操作,属于趋势跟踪突破交易策略。
该策略具有以下优势:
-
捕捉趋势的方向和力度,针对性强。通过计算最高价和最低价判断趋势,只有在明确趋势形成后才入场,可以有效滤除震荡市的假信号。
-
操作简单清晰。仅基于突破最高价或最低价的逻辑进行买卖,容易理解和实现。
-
风险可控。设置止损和止盈距离后,最大亏损为1%,最大盈利为2%,盈亏比合理。
-
容易优化。可以调整计算最高最低价的周期参数,优化入场时机。也可以调整止损止盈参数,实现更大的盈利或更好的风险控制。
该策略也存在一些风险:
-
可能出现止损被击穿的情况。当价格快速、大幅波动时,无法完全避免此风险。
-
趋势反转时无法及时平仓。计算最高最低价的周期越长,趋势判断滞后,可能错过趋势反转点位的操作时机。
-
参数设置不当可能无法实现盈利。计算周期和止损止盈距离需要仔细测试优化,否则无法获利。
该策略可以从以下几个方面进行优化:
-
增加过滤条件,确保在趋势足够明确时才入场,避免不必要的交易。例如可以计算趋势指标,判断趋势强度。
-
调整计算最高最低价的周期参数,平衡趋势判断的及时性和稳定性。周期过短容易被短期波动误导,过长则趋势判断滞后。
-
添加止损追踪功能。以一定幅度追踪止损,可以锁定更多利润,同时也可以一定程度避免止损被击穿。
-
进行参数优化。可以通过历史回测,测试计算周期和止损止盈参数的不同组合,找到最优参数。
该策略是一个较为典型的趋势跟踪突破交易策略。它利用动量指标判断趋势方向,在价格突破关键点位时进行操作。策略优点是简单清晰,风险可控,容易理解和优化。但也可能在某些市场环境下表现不佳。通过进一步优化,可以提高策略的稳定性和效率。
||
This is a momentum-based trend following breakout trading strategy. It calculates the highest and lowest prices over a certain period to determine the trend direction, and enters long or short trades when prices break key levels.
The core logic of this strategy is:
-
Use the highest() and lowest() functions to calculate the highest and lowest prices of the recent 20 candlesticks, as momentum indicators to judge the trend.
-
When the latest close price breaks above the highest price of the previous period, go long. This is an upward breakout signal.
-
When the latest close price breaks below the lowest price of the previous period, go short. This is a downward breakout signal.
-
To control risks, set a 1% stop loss distance and 2% take profit distance, giving a risk-reward ratio of 2:1.
-
Plot the highest and lowest prices within the 20 candlesticks to visually determine the trend direction and breakout levels.
The above is the core trading logic of this strategy. It uses momentum indicators to judge the trend, and trades breakouts of key levels, making it a trend following breakout strategy.
The advantages of this strategy include:
-
Catching the direction and strength of trends with high precision. Calculating highest and lowest prices helps filter out false signals from range-bound markets.
-
Simple and clear logic. Just long above previous highest, and short below previous lowest. Easy to understand and implement.
-
Controllable risks. The max loss is 1% and max profit is 2% with stop loss and take profit set, giving a reasonable risk-reward ratio.
-
Easy to optimize. The calculation period can be adjusted for better entry timing. Stop loss and take profit levels can also be tuned for more profits or lower risks.
There are also some risks:
-
Stop loss being hit is still possible with fast, huge price swings.
-
Missing reversal signals if the calculation period is too long. Trend judgment then lags behind.
-
Improper parameter settings may lead to unprofitability. The calculation period and stop loss/take profit levels need careful testing and optimization.
This strategy can be improved in aspects like:
-
Adding filters to ensure sufficient trend strength before entering trades. Trend metrics can be used.
-
Adjusting the period parameter to balance timeliness and stability of trend judgment. Too short leads to false signals, too long leads to lag.
-
Incorporating trailing stop loss to lock in profits and avoid stop loss being hit.
-
Parameter optimization through historical backtesting to find the optimal combinations of settings.
This is a typical trend following breakout trading strategy. It uses momentum indicators to determine the trend, and trades breakouts of key levels. The pros are simplicity, controllable risks, and ease of understanding/optimization. But it may underperform in certain market environments. Further optimizations can improve its robustness and efficiency.
[/trans]
Strategy Arguments
| Argument | Default | Description |
|---|---|---|
| v_input_1 | 20 | Length |
| v_input_2 | true | Stop Loss % |
Source (PineScript)
/*backtest
start: 2023-12-31 00:00:00
end: 2024-01-30 00:00:00
period: 1h
basePeriod: 15m
exchanges: [{"eid":"Futures_Binance","currency":"BTC_USDT"}]
*/

//@version=4
strategy("Trend Following Breakout Strategy with 2:1 RRR", overlay=true)

// 定义前高和前低的计算
length = input(20, minval=1, title="Length")
highestHigh = highest(high, length)
lowestLow = lowest(low, length)

// 定义买入和卖出的条件
longCondition = close > highestHigh[1] // 当前收盘价高于前一期的最高价
shortCondition = close < lowestLow[1] // 当前收盘价低于前一期的最低价

// 为了确保盈亏比为2:1,我们需要定义止损和目标价
stopLoss = input(1, title="Stop Loss %") / 100
takeProfit = stopLoss * 2

// 如果满足买入条件,进入多头
if (longCondition)
    strategy.entry("Long", strategy.long)
    strategy.exit("Long TP", "Long", profit=takeProfit * close, loss=stopLoss * close)

// 如果满足卖出条件,进入空头
if (shortCondition)
    strategy.entry("Short", strategy.short)
    strategy.exit("Short TP", "Short", profit=takeProfit * close, loss=stopLoss * close)

// 绘图显示前高和前低
plot(highestHigh, color=color.green, title="Previous High")
plot(lowestLow, color=color.red, title="Previous Low")
Detail
https://www.fmz.com/strategy/440531
Last Modified
2024-01-31 14:14:56
