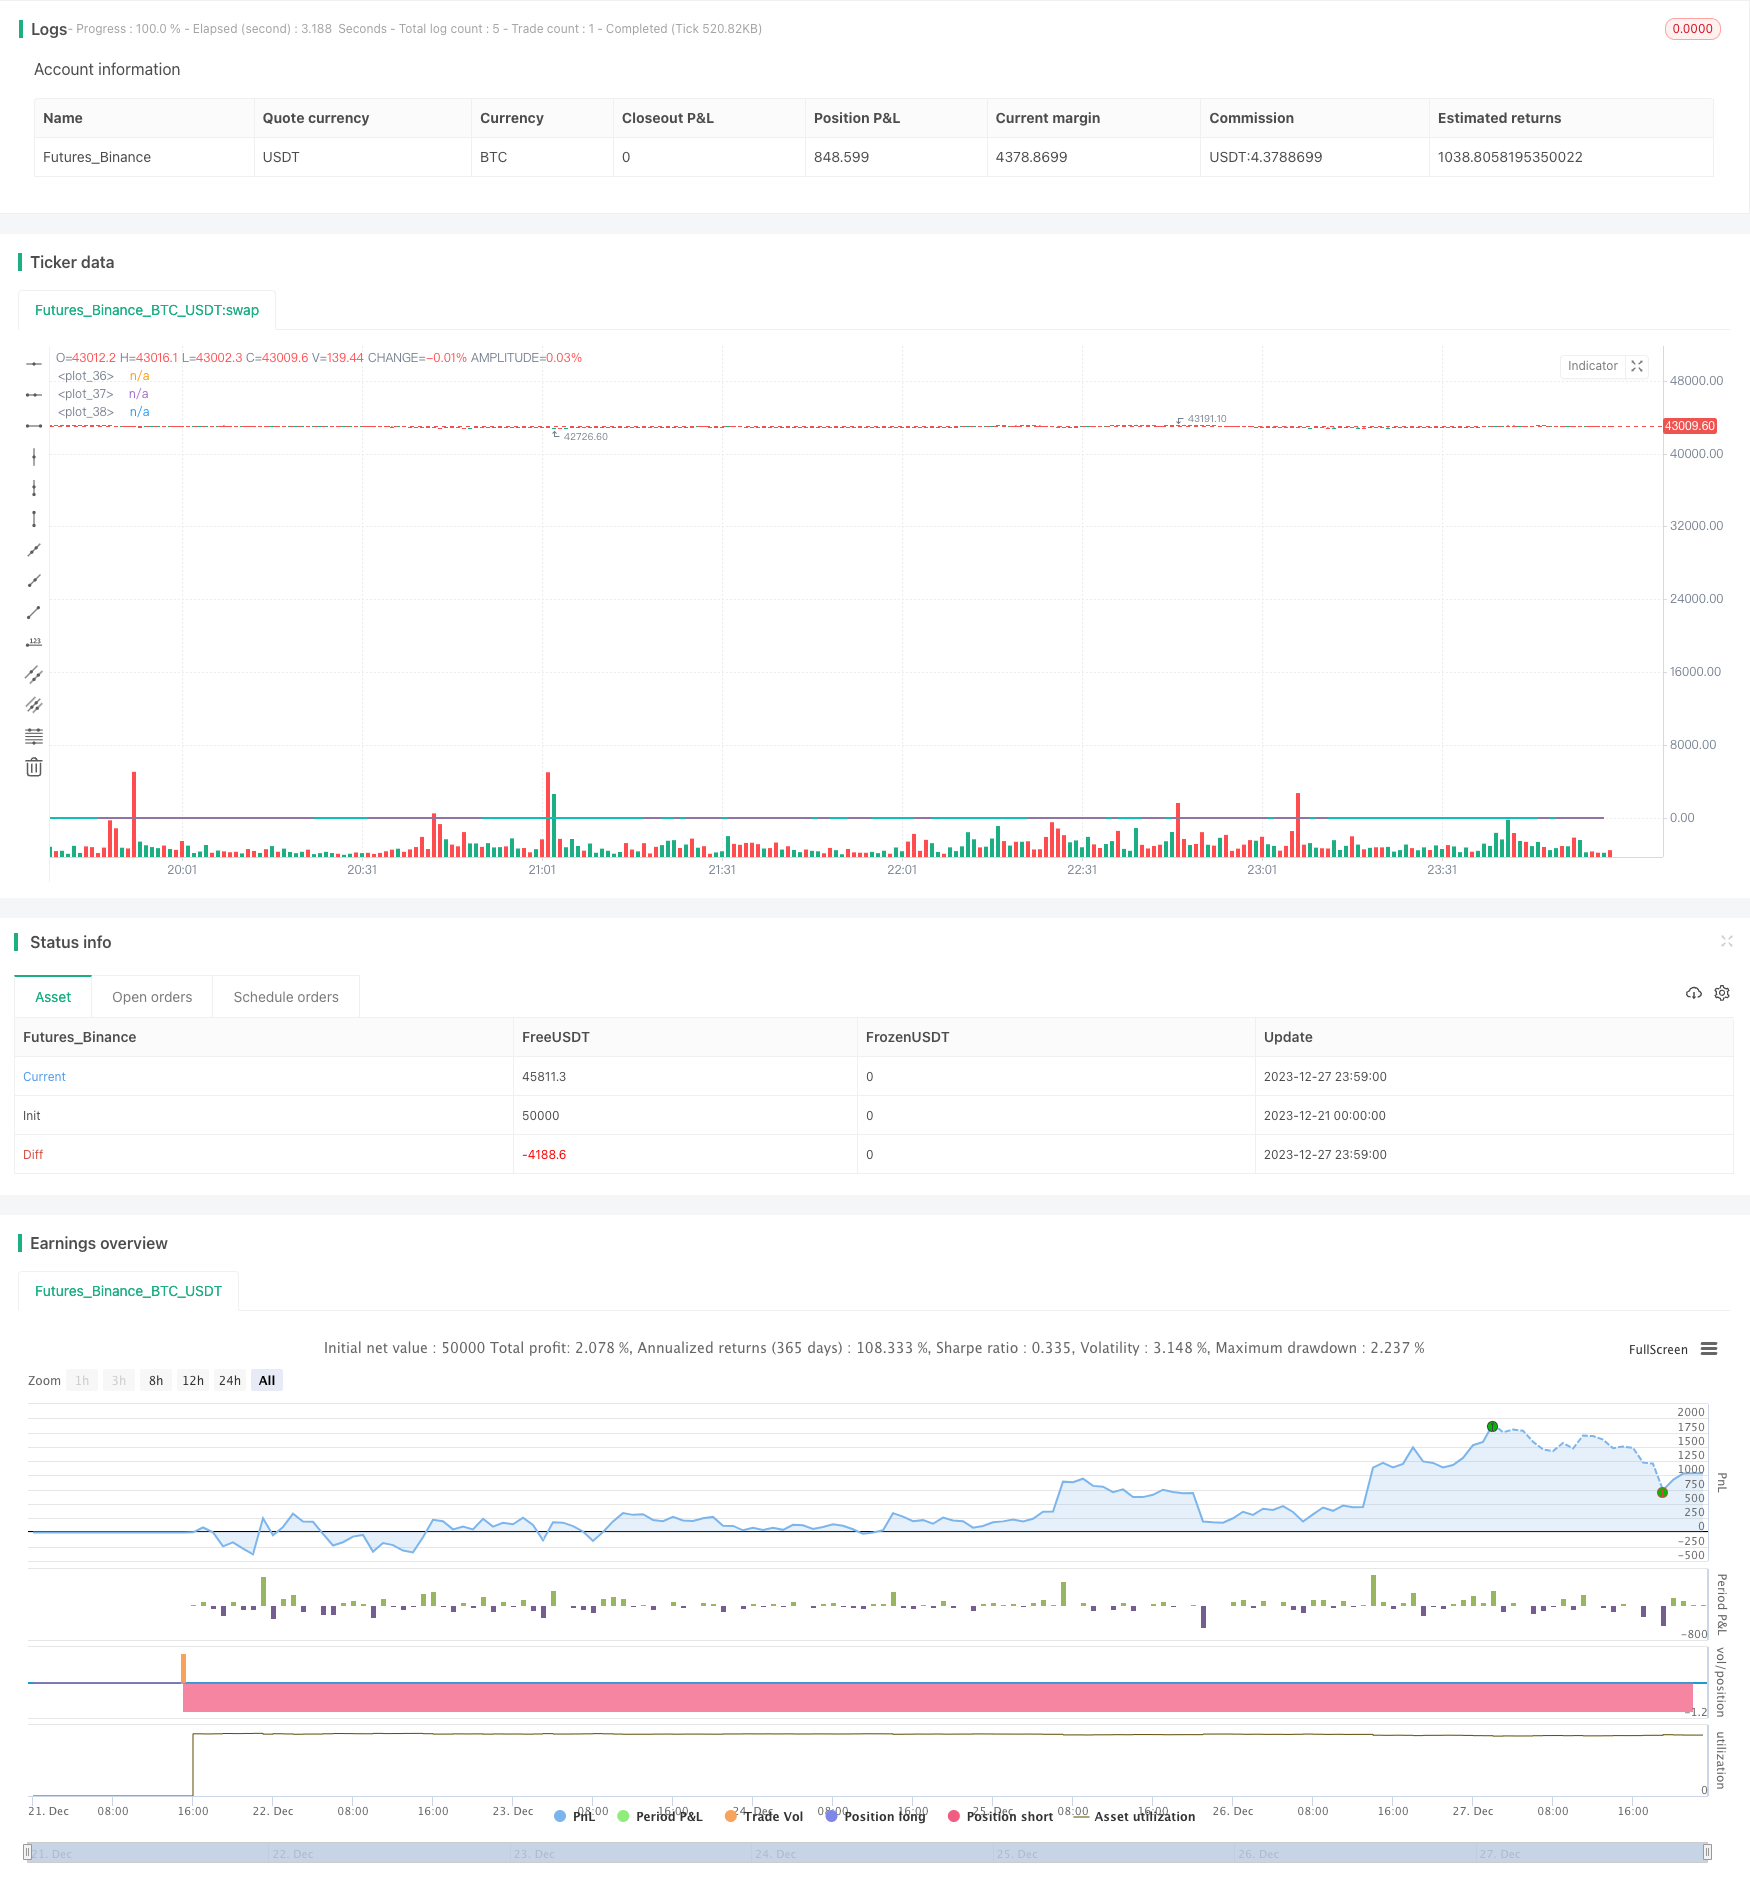
Name
基于卡尔曼滤波和均值回归的量化交易策略Transitive-Ratio-Trading-Strategy-Based-on-Kalman-Filter-and-Mean-Reversion
Author
ChaoZhang
Strategy Description
该策略运用卡尔曼滤波和均值回归的思想,捕捉股票价格的短期异常波动,实现对股票的定向交易。策略先建立一个股票与市场指数的价格比率模型,然后使用卡尔曼滤波技术对比率进行预测和滤波。当比率偏离正常水平时产生交易信号。此外,策略还结合了交易量过滤来避免误交易。
该策略的核心思路是建立股票自身价格与市场指数价格的比率模型。这个比率可以反映个股相对于整体市场的价格水平。当比率偏高时,认为个股被高估,产生卖出信号;当比率偏低时,认为个股被低估,产生买入信号。
为了对比率信号进行平滑滤波,策略采用了卡尔曼滤波算法。卡尔曼滤波将比率的实际观测值与预测值进行加权,实时更新比率的预测。并计算出一个平滑的卡尔曼滤波值。当滤波值高于正常水平2个标准差或低于正常水平2个标准差时,产生交易信号。
此外,策略还考虑了交易量因素。只有在交易量较大时才产生真正的交易信号,这可以避免一些误交易的发生。
该策略最大的优势在于利用卡尔曼滤波算法对价格比率进行了有效的平滑和预测。相比简单的均值回归模型,卡尔曼滤波能够更好地反映价格的动态变化,特别是在价格出现剧烈波动的时候。这使得策略可以及时发现价格异常,产生准确的交易信号。
其次,交易量的结合也增强了策略的实际应用性。合理的交易量过滤有助于避免一些错误信号,减少不必要的交易成本。
总体上说,该策略成功地结合了卡尔曼滤波、均值回归和交易量分析等多种技术,形成了一个比较强劲的量化交易策略。
尽管该策略在理论和技术上都比较完善,但是在实际运用中仍然存在一些潜在风险需要关注。
首先是模型风险。卡尔曼滤波模型中的一些关键参数,如过程噪声方差、观测噪声方差等,需要根据历史数据进行估计。如果估计不准或者市场环境发生重大变化,将导致模型预测的偏差。
其次是滑点成本风险。频繁交易会产生较多的滑点成本,这会损耗策略收益。Parameter优化和交易量过滤都可以在一定程度上减少不必要的交易。
最后,跟随市场指数作为基准存在一定的市场系统性风险。当整个市场出现剧烈波动时,个股与市场的价格比率也会出现异常。这时策略会产生错误信号。我们可以考虑选择更加稳定的指数作为基准。
该策略还具有进一步优化的空间:
-
使用更复杂的深度学习模型来拟合和预测价格比率。这可以提高模型的精确度和鲁棒性。
-
优化交易量过滤规则,实现更加动态和智能化的交易量阈值设置。这可以降低误交易概率。
-
测试不同的市场指数作为策略基准,选择波动更小、更加稳定的指数。这可以减少市场系统性风险的影响。
-
结合股票基本面分析,避免交易一些基本面明显恶化的个股。这可以筛选出质量更好的交易标的。
-
使用高频intraday数据进行策略回测和优化,这可以提高策略的实盘表现。
该策略成功地利用卡尔曼滤波模型捕捉了股票价格的短期反常波动。同时交易量信号的引入也增强了策略的实用性。虽然仍存在一定的模型风险和市场风险,但是这是一个非常有前景的量化交易策略。未来在模型和交易信号优化方面还具有很大的提升空间和应用潜力。
||
This strategy utilizes the concepts of Kalman filter and mean reversion to capture abnormal short-term fluctuations in stock prices and implement directional trading of stocks. The strategy first establishes a price ratio model between a stock and a market index, and then uses the Kalman filter technique to predict and filter the ratio. Trading signals are generated when the ratio deviates from normal levels. In addition, the strategy also incorporates volume filtering to avoid false trades.
The core idea of the strategy is to establish a price ratio model between the price of the stock itself and the price of the market index. This ratio reflects the price level of individual stocks relative to the overall market. When the ratio is high, it is considered that the individual stock is overvalued and a sell signal is generated. When the ratio is low, it is considered that the individual stock is undervalued and a buy signal is generated.
In order to filter the ratio signal smoothly, the strategy adopts the Kalman filter algorithm. The Kalman filter weights the actual observed value of the ratio with the predicted value and updates the prediction of the ratio in real time. And calculate a smooth Kalman filter value. Trading signals are generated when the filtered value exceeds 2 standard deviations above or below normal levels.
In addition, the strategy also considers trading volume factors. Real trading signals are only generated when trading volume is large. This avoids some false trades.
The biggest advantage of this strategy is the effective smoothing and prediction of the price ratio using the Kalman filter algorithm. Compared with simple mean reversion models, the Kalman filter can better reflect the dynamic changes in prices, especially when prices fluctuate sharply. This allows the strategy to detect price anomalies in a timely manner and generate accurate trading signals.
Secondly, the combination of trading volume also enhances the practical applicability of the strategy. Reasonable trading volume filtering helps avoid some erroneous signals and reduces unnecessary trading costs.
Overall, the strategy successfully combines Kalman filtering, mean reversion, trading volume analysis and other techniques to form a robust quantitative trading strategy.
Although the strategy is theoretically and technically sound, there are still some potential risks in actual use that need attention.
The first is model risk. Some key parameters in the Kalman filter model, such as process noise variance, observation noise variance, etc., need to be estimated based on historical data. If the estimation is inaccurate or there is a major change in market conditions, it will lead to deviation in model prediction.
Second is the risk of slippage costs. Frequent trading will incur higher slippage costs, which will erode strategy returns. Parameter optimization and transaction volume filtering can reduce unnecessary transactions to some extent.
Finally, there is some systemic market risk in following the market index as a benchmark. When the entire market fluctuates sharply, the price ratio between individual stocks and the market will also be abnormal. The strategy will then generate wrong signals. We can consider choosing a more stable index as the benchmark.
There is room for further optimization of the strategy:
-
Use more complex deep learning models to fit and predict price ratios. This can improve model accuracy and robustness.
-
Optimize trading volume filtering rules to achieve more dynamic and intelligent threshold settings. This reduces the probability of false trades.
-
Test different market indexes as strategy benchmarks and choose indexes with smaller and more stable fluctuations. This reduces the impact of market systemic risk.
-
Incorporate fundamental analysis of stocks to avoid trading some stocks with significantly deteriorated fundamentals. This screens for higher quality trading targets.
-
Use high-frequency intraday data for strategy backtesting and optimization. This improves real trading performance of the strategy.
The strategy successfully captures abnormal short-term price fluctuations in stocks using the Kalman filter model. Meanwhile, the introduction of volume signals also enhances the practicality of the strategy. Although there are still some model risks and market risks, this is a very promising quantitative trading strategy. There is great room for improvement and application potential in future model and signal optimization.
[/trans]
Strategy Arguments
| Argument | Default | Description |
|---|---|---|
| v_input_1_close | 0 | v_input_1: close |
| v_input_2_close | 0 | particular: close |
| v_input_float_1 | true | Sharpness |
| v_input_float_2 | true | K |
| v_input_3 | 20 | v_input_3 |
| v_input_4 | 20 | v_input_4 |
Source (PineScript)
/*backtest
start: 2023-12-21 00:00:00
end: 2023-12-28 00:00:00
period: 1m
basePeriod: 1m
exchanges: [{"eid":"Futures_Binance","currency":"BTC_USDT"}]
*/

// This source code is subject to the terms of the Mozilla Public License 2.0 at https://mozilla.org/MPL/2.0/
// © xXM3GAXx

//@version=5
strategy("My strategy", overlay=true)

//SPY or QQQ
context = request.security("BTC_USDT:swap", timeframe.period, input(close))
//our stock
particular = input(close)

//ratio
src = ta.roc(particular, 1) / math.abs(ta.roc(context, 1))

//kalman calculation
Sharpness = input.float(1.0)
K = input.float(1.0)


greencolor =  color.lime
redcolor =  color.red

velocity = 0.0
kfilt = 0.0

Distance = src - nz(kfilt[1], src)
Error = nz(kfilt[1], src) + Distance * math.sqrt(Sharpness*K/ 100)
velocity := nz(velocity[1], 0) + Distance*K / 100
kfilt := Error + velocity

//2 std devs up and down
upper = kfilt[1] + 2 * ta.stdev(kfilt, input(20))
lower = kfilt[1] - 2 * ta.stdev(kfilt, input(20))

//plotting for visuals
plot(kfilt, color=velocity > 0 ? greencolor : redcolor, linewidth = 2)
plot(upper)
plot(lower)
//plot(ta.ema(ta.roc(particular, 1)/ta.roc(context, 1), 5), color = #00ffff, linewidth=2)

//volume data
vol = volume
volema = ta.ema(volume, 10)

//buy when ratio too low
longCondition = kfilt<=lower and vol>=volema
if (longCondition)
    strategy.entry("My Long Entry Id", strategy.long)

//sell when ratio too high
shortCondition = kfilt>=upper and vol>=volema
if (shortCondition)
    strategy.entry("My Short Entry Id", strategy.short)
Detail
https://www.fmz.com/strategy/437046
Last Modified
2023-12-29 17:23:14
