Name
基于双向突破均线交易策略Dual-Breakthrough-Moving-Average-Trading-Strategy
Author
ChaoZhang
Strategy Description
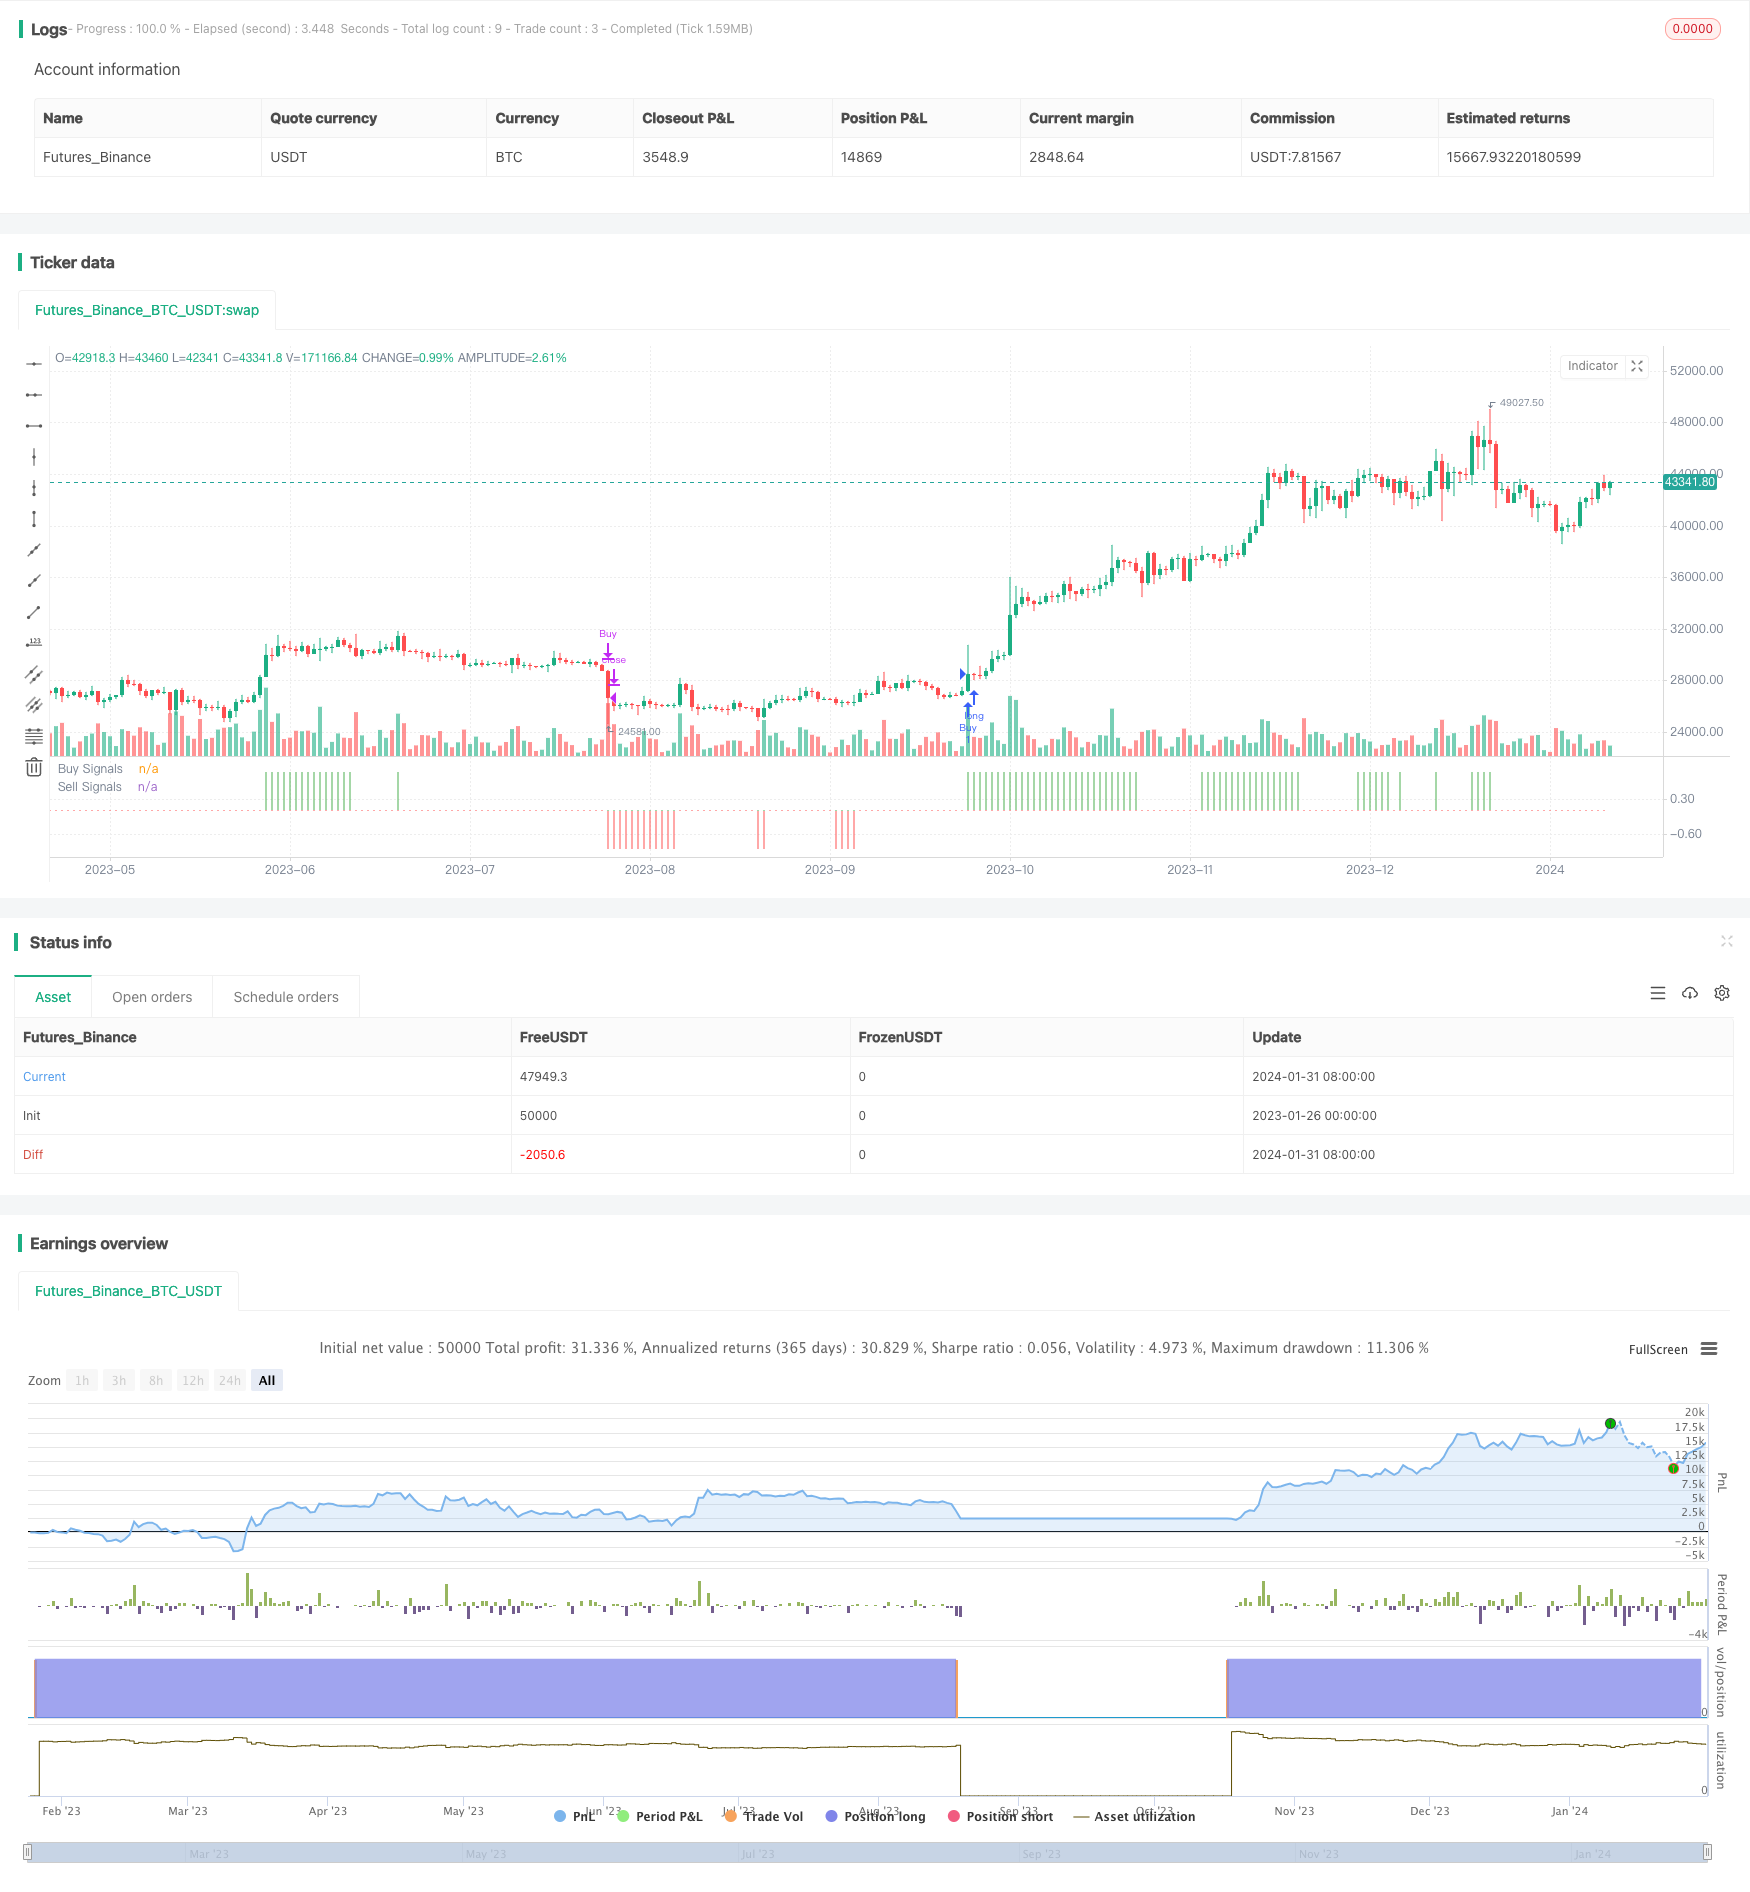
双向突破均线交易策略是一个基于多个指标进行买入和卖出信号判断的策略。它整合了均线、支撑压力指标、趋势指标以及超买超卖指标,形成一个全方位的交易体系。
买入信号需要同时满足以下四个条件:
- 收盘价高于抛物线指标
- 收盘价高于Length=200的简单移动平均线
- MACD指标的MACD线高于0
- Length=7的RSI指标高于50
只要上述四个条件同时满足,就产生1的买入信号。
卖出信号的判断逻辑和买入信号正好相反,需要同时满足以下四个条件:
- 收盘价低于抛物线指标
- 收盘价低于Length=200的简单移动平均线
- MACD指标的MACD线低于0
- Length=7的RSI指标低于50
一旦上述四个条件同时满足,就产生-1的卖出信号。
策略中,入场条件根据买入和卖出信号判断,做多时要求买入信号=1,做空时要求卖出信号=-1。
出场条件有两个,一个是快速出场,一旦信号改变就出场;另一个是等待相反信号才出场,比如做多后等待卖出信号才平仓。
双向突破均线策略最大的优势在于多指标组合,能够全方位判断趋势、超买超卖状态等情况。具体来说,主要有以下几点优势:
- 抛物线指标能判断是否有效突破作为支撑压力;
- 均线判断大趋势方向,避免逆势操作;
- MACD判断明确的多空状态;
- RSI避免了超买超卖的风险;
- 结合多指标,可以大幅提高稳定性和成功率。
总的来说,这套系统非常适合新手自我学习,也适合专业人员使用。
尽管双向突破均线策略有很多优势,但也存在一些风险需要关注,主要集中在以下几个方面:
- 参数设置易造成过度优化,实盘效果可能不理想;
- 指标发散的概率较大,入场前后需要再次确认;
- 止损策略不完善,容易被套牢;
- 交易频率可能过高,增加交易成本和滑点损耗。
针对以上风险,可以采取如下措施加以优化和改进:
- 增加指标过滤,确保一致信号;
- 严格止损,控制单笔损失;
- 交易次数控制,合理频率;
- 参数组合测试,防止过优化。
双向突破均线策略还有很大的优化空间,主要可以从以下几个方面入手:
- 增加机器学习模型预测信号强度;
- 结合文本分析等判断重大消息面影响;
- 增加市场结构指标,根据阶段调整策略;
- 优化止损方式,跟踪止损或振荡止损;
- 参数调整与组合,找到最优参数对。
如果能在上述方面有所改进,相信该策略的效果能得到进一步提升,更适合实盘应用。
双向突破均线交易策略是一种多指标组合的全能策略。它同时结合了趋势、支持压力、超买超卖等指标判断买入卖出时机。具有指标效果互补、全面判断的优势。但也存在一定的风险,需要继续优化以适应更多市场情况。总体而言,该策略为人类量化交易提供了一个非常Outstanding的策略思路,值得深入研究与应用。
||
The Dual Breakthrough Moving Average Trading Strategy is a strategy that generates buy and sell signals based on multiple indicators. It integrates moving averages, support/resistance indicators, trend indicators and overbought/oversold indicators to form a comprehensive trading system.
The buy signal requires the following four conditions to be true at the same time:
- Close price above Parabolic SAR indicator
- Close price above Simple Moving Average with length = 200
- MACD indicator's MACD line above 0
- RSI indicator with length = 7 above 50
Once all four conditions are met, a buy signal of 1 is generated.
The sell signal logic is exactly the opposite of the buy signal. It requires the following four conditions:
- Close price below Parabolic SAR indicator
- Close price below Simple Moving Average with length = 200
- MACD indicator's MACD line below 0
- RSI indicator with length = 7 below 50
When all four conditions are true at the same time, a sell signal of -1 is generated.
The entry conditions depend on the buy and sell signals. To go long, the buy signal must equal 1. To go short, the sell signal must equal -1.
There are two exit conditions. One is a fast exit once the signal changes. The other is to wait for the opposite signal before exiting a position. For example, wait for a sell signal after going long.
The biggest advantage of the Dual Breakthrough Moving Average Strategy is the combination of multiple indicators, which enables comprehensive judgment of trends, overbought/oversold status, etc. Specifically, the main advantages are:
- Parabolic SAR judges effective breakthroughs as support/resistance;
- Moving averages determine overall trend direction, avoiding counter-trend operations;
- MACD clearly judges bullish/bearish status;
- RSI avoids overbought/oversold risks;
- Combining multiple indicators greatly improves stability and success rate.
In general, this system is very suitable for self-learning by beginners, as well as for use by professionals.
Although the strategy has many advantages, there are still some risks to watch out for:
- Parameter optimization may lead to overfitting and poor live performance;
- High probability of indicator divergence, requiring reconfirmation before entries;
- Stop loss strategy not perfect, prone to being trapped in positions;
- Potentially excessive trading frequency, increasing costs and slippage.
To address these risks, the following measures could be adopted:
- Add filters to ensure consistent signals;
- Strict stop loss to control single trade loss;
- Control number of trades and trade frequency;
- Test parameter combinations to prevent overfitting.
There is still great potential to optimize this strategy further:
- Add machine learning models to predict signal strength;
- Incorporate text analysis to judge impact of significant news events;
- Add market structure indicators and adjust strategy by period;
- Optimize stop loss methods, such as trailing stop loss or shock stop loss;
- Parameters tuning and combination to find optimum pairs.
With improvements in the above aspects, the strategy's performance can be further enhanced for live trading applications.
The Dual Breakthrough Moving Average Trading Strategy is a versatile strategy combining multiple indicators. It incorporates trend, support/resistance, overbought/oversold indicators to determine entries and exits. With complementary effects and comprehensive judgments, the strategy provides an Outstanding idea model for quantitative trading that is worth in-depth research and application.
[/trans]
Strategy Arguments
| Argument | Default | Description |
|---|---|---|
| v_input_1 | 200 | MA Length |
| v_input_2 | 12 | Fast EMA Length |
| v_input_3 | 26 | Slow EMA Length |
| v_input_4 | 7 | RSI Length |
| v_input_5 | 50 | RSI Threshold |
| v_input_6 | true | Long Trades |
| v_input_7 | false | Short Trades |
| v_input_8 | false | Quick Exits |
Source (PineScript)
/*backtest
start: 2023-01-26 00:00:00
end: 2024-02-01 00:00:00
period: 1d
basePeriod: 1h
exchanges: [{"eid":"Futures_Binance","currency":"BTC_USDT"}]
*/

//@version=4
//Original Indicator by @Shizaru - simply made into a strategy!

strategy("Simple Buy/Sell Strategy", overlay=false)
psar = sar(0.02,0.02,0.2)
c1a = close > psar
c1v = close < psar

malen = input(200, title="MA Length")
mm200 = sma(close, malen)
c2a = close > mm200
c2v = close < mm200

fast = input(12, title="Fast EMA Length")
slow = input(26, title="Slow EMA Length")
[macd,signal,hist] = macd(close, fast,slow, 9)
c3a = macd >= 0
c3v = macd <= 0

rsilen = input(7, title="RSI Length")
th = input(50, title="RSI Threshold")
rsi14 = rsi(close, rsilen)
c4a = rsi14 >= th
c4v = rsi14 <= th

buy = c1a and c2a and c3a and c4a ? 1 : 0
sell = c1v and c2v and c3v and c4v ? -1 : 0

longtrades = input(true, title="Long Trades")
shorttrades = input(false, title="Short Trades")
quickexit = input(false, title="Quick Exits")

strategy.entry("Buy", strategy.long, when=buy==1 and longtrades==true)
strategy.close("Buy", when=quickexit==true ? buy==0 : sell==-1)
strategy.entry("Sell", strategy.short, when=sell==-1 and shorttrades==true)
strategy.close("Sell", when=quickexit==true ? sell==0 : buy==1)

plot(buy, style=plot.style_histogram, color=color.green, linewidth=3, title="Buy Signals")
plot(sell, style=plot.style_histogram, color=color.red, linewidth=3, title="Sell Signals")
Detail
https://www.fmz.com/strategy/440863
Last Modified
2024-02-02 17:33:14
