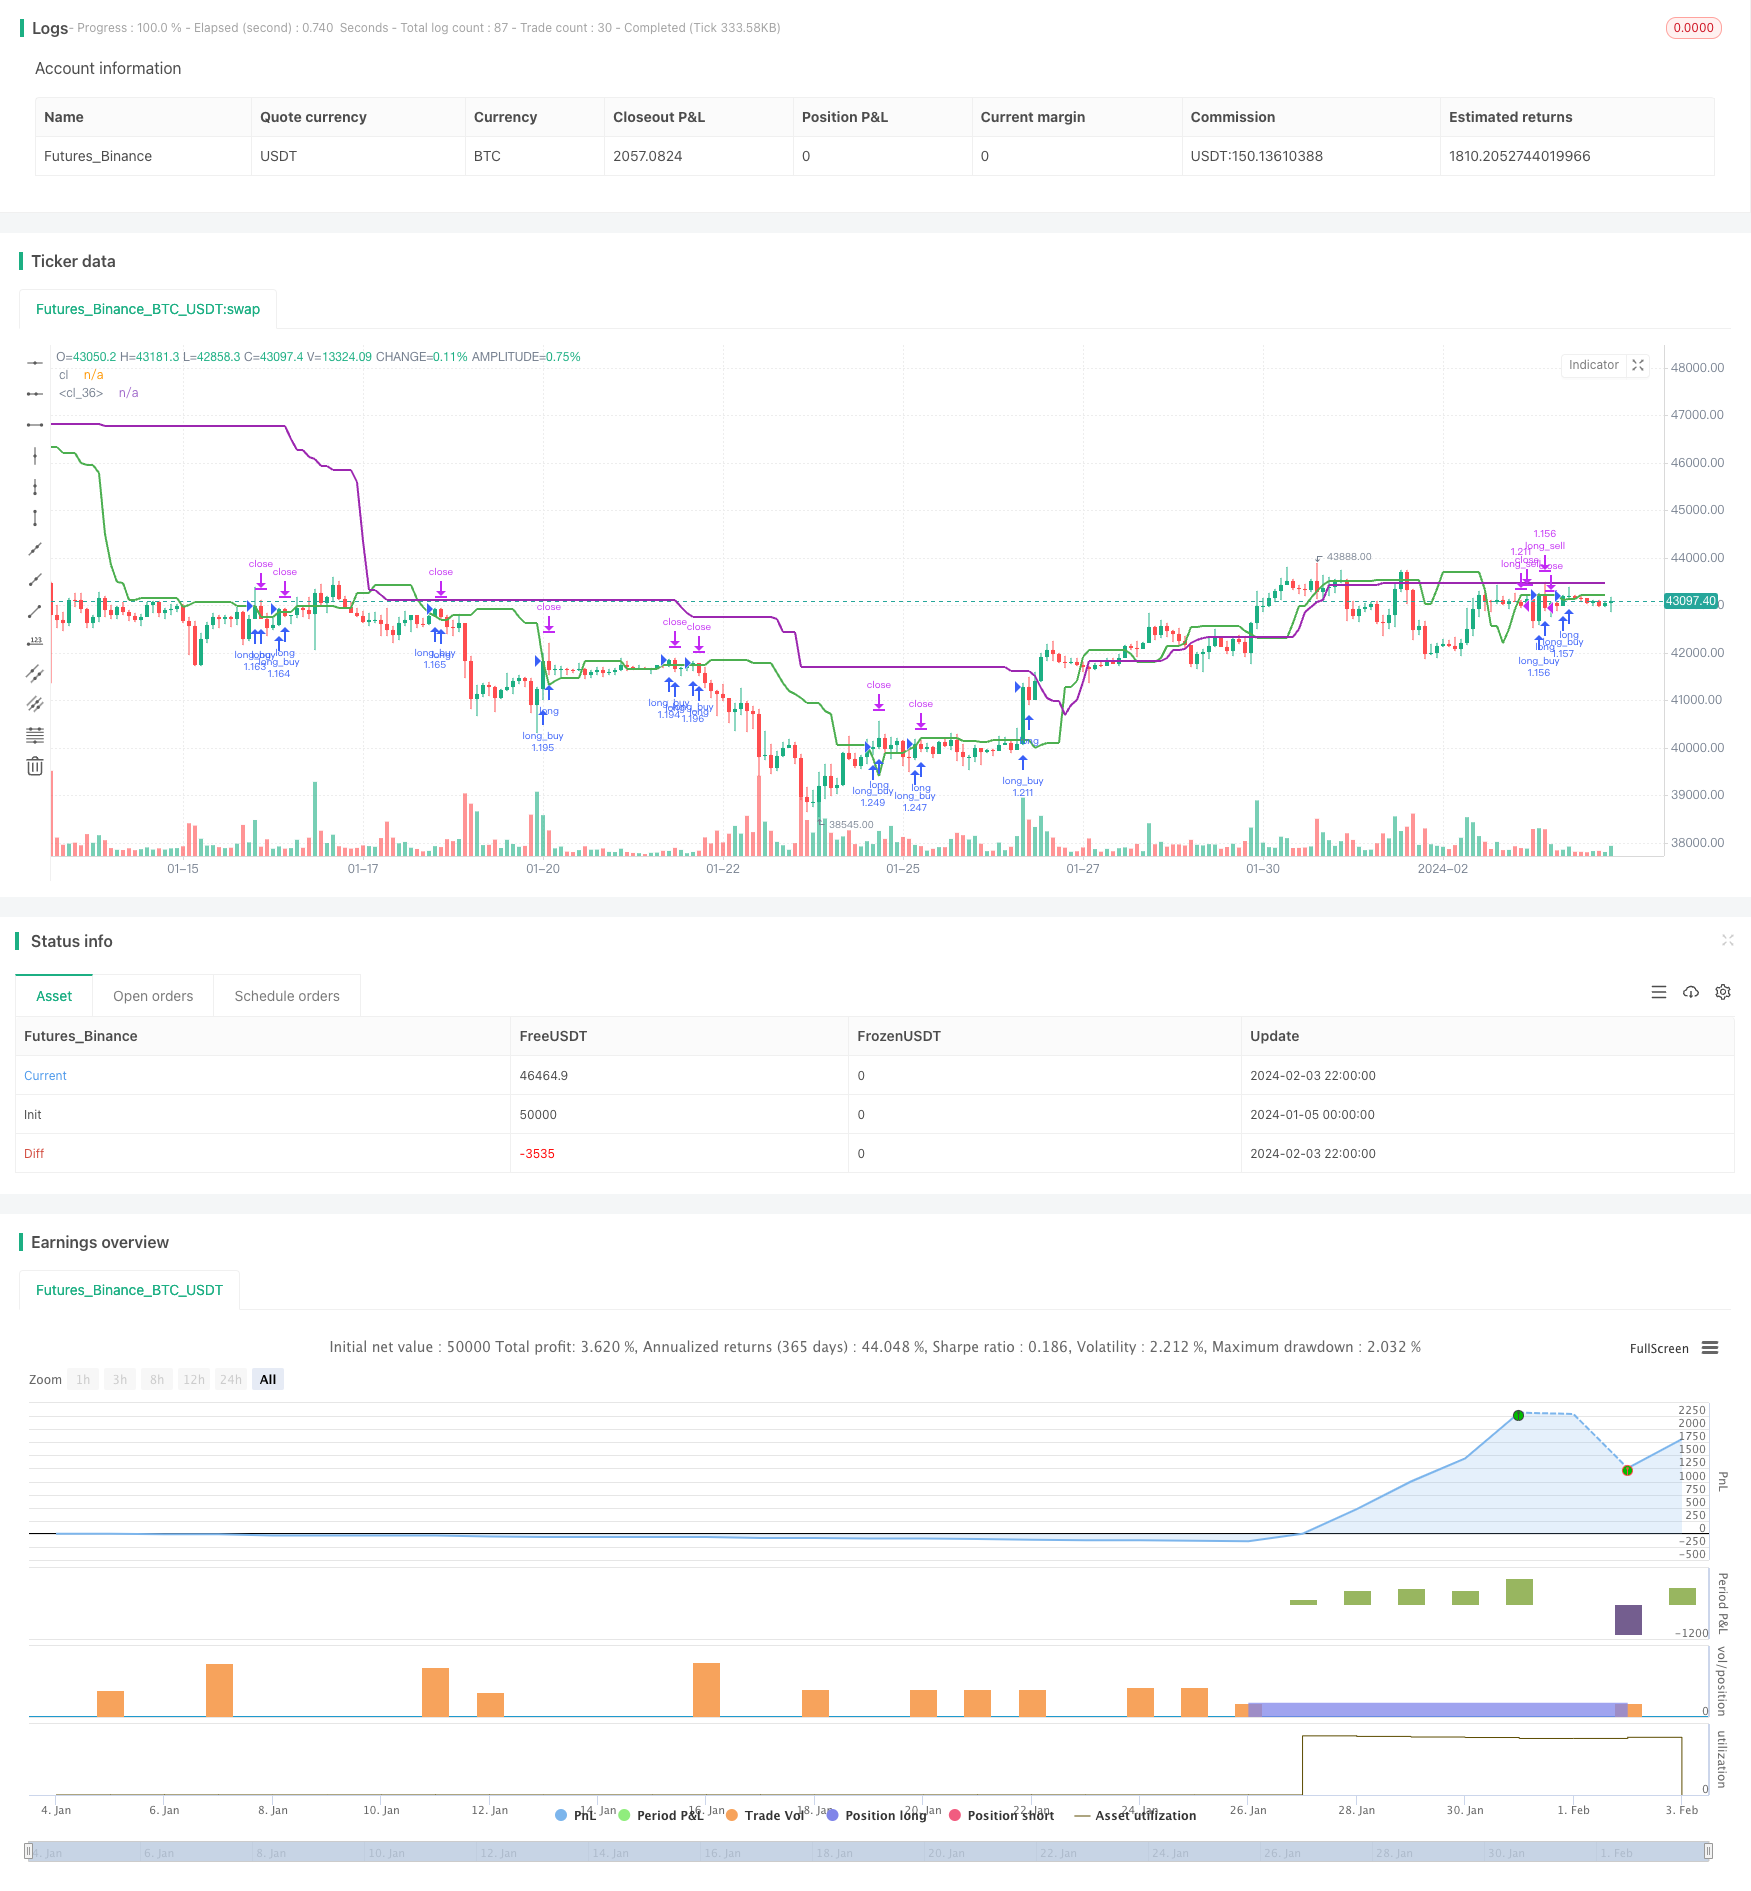
Name
基于双均线交叉策略Closing-Price-Comparison-Dual-Moving-Average-Crossover-Strategy
Author
ChaoZhang
Strategy Description
双均线交叉策略是一种比较简单的量化交易策略。它通过计算最近7根K线的平均收盘价和20根K线的平均收盘价,当短期均线从下方上穿长期均线时做多,当短期均线从上方下穿长期均线时做空,采取此类操作可以捕捉市场中期趋势的转折点。
该策略的核心逻辑是计算最近7根K线(不包含当前K线)的平均收盘价作为短期均线,计算20根K线(不包含最近7根K线)的平均收盘价作为长期均线。当短期均线从下方上穿长期均线时,表示市场由跌转涨,做多;当短期均线从上方下穿长期均线时,表示市场由涨转跌,做空。
做多信号触发后,按整个账户资金的数量开仓做多;做空信号触发后,按做多头寸的数量平掉做多头寸再按该数量开仓做空。每次开仓后的头寸将持有20-25根K线,在此期间如果出现亏损将止损一半头寸,如果出现足够的盈利会止盈一半头寸。
这是一个非常简单的双均线交叉策略,它的优势主要体现在:
- 思路简单,容易理解和实现;
- 通过计算不同周期均线的交叉来判断市场中期趋势的转折点,这是许多量化策略广泛采用的技术指标;
- 可以有效过滤市场上的随机性噪音,抓住中期趋势;
- 该策略特别适合中长线交易,每个头寸持仓20-25根K线,可以获得较好的盈亏比;
- 策略内置了止损和止盈机制来控制风险和锁定利润。
这是一个较简单的趋势跟踪策略,它也面临一些潜在的风险:
- 当市场进入震荡区间时,短期均线和长期均线可能出现多次交叉导致虚假信号和过度交易;
- 持仓期内价格短线大幅震荡造成止损被触发的可能;
- 无法有效判断市场真实趋势反转点,交易信号可能出现滞后。
针对上述风险,可以通过以下方式进行优化:
- 增加过滤条件,在均线交叉时判断价格是否突破关键的支持或阻力位来过滤虚假信号;
- 调整持仓周期,缩短每个头寸的平均持仓时间,以控制亏损;
- 增加其他技术指标判断,如量能指标、波动指标等来确定市场真实的反转点。
这是一个较为简单的双均线交叉策略,主要可以从以下几个方面进行深入优化:
- 优化均线参数,测试不同的短期和长期均线组合,寻找最优参数;
2.增加其他过滤指标,如量能指标、波动率指标等,避免在震荡市场中产生错误信号;
-
优化止损止盈策略,测试不同的止损止盈比例,确定最优参数;
-
测试不同的市场周期,优化持仓时间长度,判断哪些周期该策略效果最好;
-
增加机器学习算法,通过反向测试不断优化策略参数,使策略更稳定。
本策略是一个较为简单的双均线交叉策略,通过计算不同周期的均线交叉来判断中期趋势转折点。该策略实用性较强,思路简单易于操作。但该策略也存在一定的局限性,主要问题在于无法有效判断市场真实转折点。未来需要从增加过滤指标、优化参数以及加入机器学习等方面不断对该策略进行优化,使其能够在更多类型的市场中稳定获得 Alpha。
||
The Closing Price Comparison Dual Moving Average Crossover strategy is a relatively simple quantitative trading strategy. It calculates the recent 7 candle’s average closing price and 20 candle’s average closing price. When the short-term moving average crosses over the long-term moving average from below, it signals a long position. When the short-term moving average crosses below the long-term moving average, it signals a short position. This allows the strategy to capture the inflection points in market’s mid-term trends.
The core logic of this strategy is to calculate the average closing price of recent 7 candles (excluding the current candle) as the short-term moving average, and the average closing price of 20 candles (excluding recent 7 candles) as the long-term moving average. When the short-term moving average crosses over the long-term moving average from below, it indicates the market is turning from decline to rise, signaling a long position. When the short-term moving average crosses below the long-term moving average from above, it indicates the market is turning from rise to decline, signaling a short position.
Upon long signal, long position will be opened using the whole account capital. Upon short signal, the existing long position will be closed first before opening the short position using the same amount. Each opened position will be hold for 20-25 candles. During this period, if loss occurs, 50% of the position will be stopped loss. If sufficient profit occurs, 50% of the position will be taken profit.
The advantages of this simple dual moving average crossover strategy are:
- Simple logic, easy to understand and implement;
- Using crossing of different period moving averages to determine inflection points in mid-term market trends, which is a widely used technical indicator;
- Can filter out market noise effectively and capture mid-term trends;
- Suitable for mid-long term trading, with 20-25 candle hold per position and good profit/loss ratio;
- Built-in stop loss and take profit mechanisms to control risks and lock in profits.
As a simple trend following strategy, it also faces some potential risks:
- Increased whipsaws and false signals when market enters consolidation;
- Price spikes during hold period may trigger stop loss;
- Hard to effectively determine true market reversal points, trading signal may lag.
The optimizations to address these risks are:
- Add filters, check if price breaks key support/resistance levels when MAs cross to remove false signals;
- Adjust hold period, shorten average hold time per position to control loss;
- Add other technical indicators to determine true market reversal points.
As a simple dual moving average crossover strategy, the main optimizations are:
-
Optimize MA parameters, test different short and long term MA combinations for best parameters;
-
Add other filter indicators like volume, volatility index etc. to avoid wrong signals in choppy markets;
-
Optimize stop loss and take profit strategies, test different ratios to find optimum;
-
Test effectiveness across different market cycles and optimize hold period;
-
Add machine learning algorithms, keep optimizing parameters through back-testing for more robustness.
In summary, this is a simple dual moving average crossover strategy, using MA crossovers across different periods to determine mid-term trend inflection points. It has high practicality and is easy to operate. But it also has limitations in effectively determining true market reversal points. Further optimizations on adding filters, parameter tuning, machine learning etc. are needed to make it more robust across varying market conditions for consistent alpha.
[/trans]
Source (PineScript)
/*backtest
start: 2024-01-05 00:00:00
end: 2024-02-04 00:00:00
period: 2h
basePeriod: 15m
exchanges: [{"eid":"Futures_Binance","currency":"BTC_USDT"}]
*/

// This source code is subject to the terms of the Mozilla Public License 2.0 at https://mozilla.org/MPL/2.0/
// © nrathi2211

//@version=5
strategy("Closing Prices", overlay=true)

//variables
closingB7 = ta.highest(close, 7)[7]
closingB14 = ta.highest(close, 7)[20]
highB14 = ta.highest(low, 50)[7]
capital = 50000

//functions
qty_find(float price) => capital / int(price)

profit_take() =>
    profit = strategy.opentrades.profit(strategy.opentrades - 1)
    profit*.95

if(closingB7 < closingB14)
    if(ta.crossover(close, closingB7))
        strategy.entry("long_buy", strategy.long, qty_find(close))

    current_profit = strategy.opentrades.profit(strategy.opentrades - 1)
    if(current_profit < 0)
        strategy.close("Exit long_buy SL", "long_buy", qty_percent = 50)

    else if(current_profit < profit_take())
        strategy.close("Exit long_buy TP", "long_buy", qty_percent = 50)

    if(ta.crossunder(close, closingB7))
        strategy.exit("long_sell", from_entry = "long_buy", stop = closingB7)

plot(closingB7, "cl", color.green, 2)
//plot(closingB14, "cl", color.red, 2)
plot(highB14, "cl", color.purple, 2)
Detail
https://www.fmz.com/strategy/441049
Last Modified
2024-02-05 10:34:57
