Name
基于双移动平均线突破策略Dual-Moving-Average-Crossover-Strategy
Author
ChaoZhang
Strategy Description
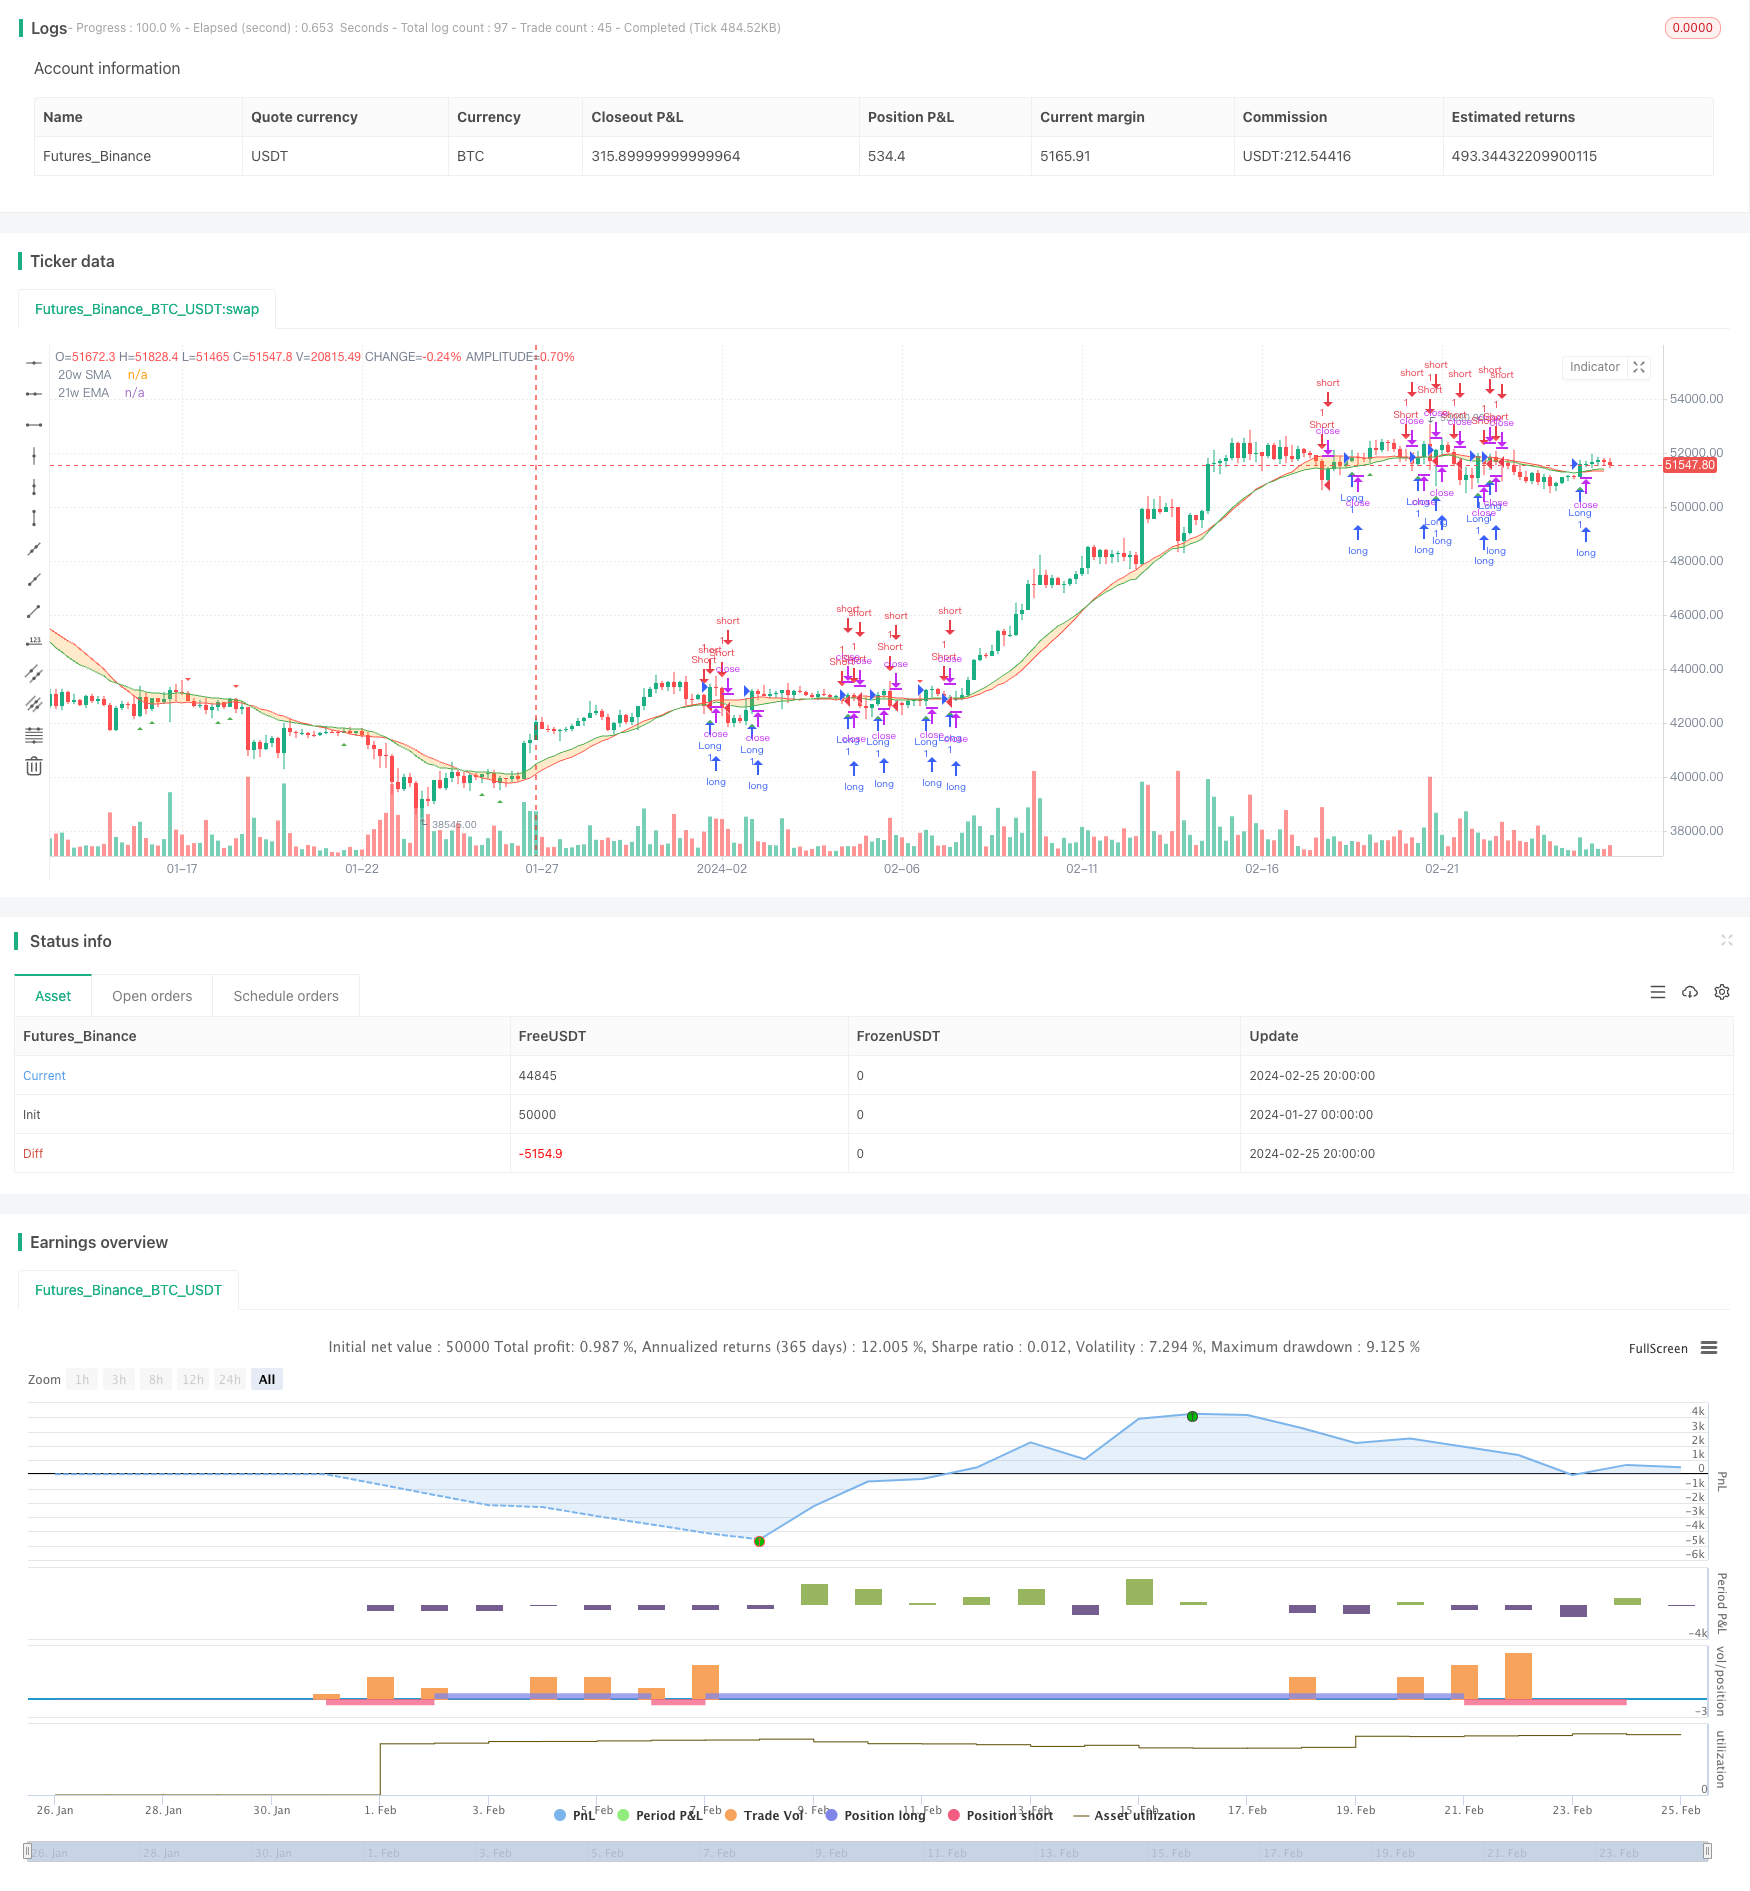
本策略通过计算并绘制 20 周期简单移动平均线(SMA)和 21 周期指数移动平均线(EMA),并在它们之间填充颜色来可视化价格波动区域。当价格上穿 20 周期 SMA 时生成买入信号;当价格下穿 21 周期 EMA 时生成卖出信号。该策略同时具有追踪止损和止盈功能。
双移动平均线突破策略的核心思想是利用快速移动平均线和慢速移动平均线之间的交叉作为买卖信号。20 周期 SMA 相对更为灵敏,能快速响应价格变化;21 周期 EMA 的反应稍微滞后但更为平滑。当短期和长期趋势方向一致时,即两条平均线发生向上或向下交叉时,判断趋势进入较强阶段,这个时候做出的买入或卖出决策胜率较大。
具体来说,当收盘价格上穿 20 周期 SMA 时,表示短期和长期均为上升趋势,因此做多;当收盘价格下穿 21 周期 EMA 时,表示短期和长期均为下降趋势,因此做空。平仓信号则与 entry 信号相反,如价格下破 20 周期 SMA 则平多仓,价格上破 21 周期 EMA 则平空仓。
该策略同时利用fill技术在两条移动平均线之间填充颜色,形成视觉指标,辅助判断市场走势。
双移动平均线突破策略具有以下优势:
- 原理简单,容易理解和实现;
- 通过双线交叉判断市场走势较为准确;
- 可视化指标直观显示价格波动区域;
- 具有追踪止损止盈功能,可以锁定利润、减少风险;
- 可扩展性强,可基于该策略进行各种优化。
该策略也存在一些风险:
- 在震荡行情中容易产生错误信号;
- 止损止盈设置不当可能带来亏损或利润减少;
- 参数设定(如周期长度)不当会影响策略效果;
- 机械化交易容易引发系列亏损。
针对上述风险,可以采取以下措施加以应对:
- 增加过滤条件,在震荡期避免进场;
- 优化止损止盈参数,平衡风险收益;
- 测试参数健壮性,选择适合市场的指标参数;
- 人工干预异常情况,避免连续亏损扩大。
该策略可以从以下几个方面进行优化:
- 增加其他技术指标过滤,例如交易量、波动度等指标,避免假突破;
- 基于机器学习方法动态优化移动平均线参数;
- 结合情绪指标、消息面等提高决策效果;
- 加入自适应止损机制,根据市场变化调整止损幅度。
本策略通过快速和缓速双移动平均线的交叉来判断行情趋势变化,并相应做出买入和卖出决策。该策略具有简单、直观、容易实现等优点,也存在一定的风险。通过参数优化、增加过滤条件、人工干预等方式可以降低风险提高策略效果。该策略扩展空间大,值得深入研究与应用。
||
This strategy calculates and plots the 20-period simple moving average (SMA) and 21-period exponential moving average (EMA), fills the color between them to visualize the price fluctuation zone. It generates buy signals when the price crosses above the 20-period SMA and sell signals when the price crosses below the 21-period EMA. The strategy also has trailing stop loss and take profit functions.
The core idea of the dual moving average crossover strategy is to use the crossovers between fast and slow moving averages as trading signals. The 20-period SMA responds faster to price changes while the 21-period EMA is slightly lagging but smoother. When the short-term and long-term trends are consistent, i.e. the two moving averages crossover up or down, it indicates the trend is strengthening and the trading decisions made will likely be more profitable.
Specifically, when the closing price crosses above the 20-period SMA, it indicates that both short-term and long-term are in uptrends, so go long. When the closing price crosses below the 21-period EMA, it indicates that both short-term and long-term are in downtrends, so go short. The exit signals are opposite of the entry signals. For example, when price drops below the 20-period SMA, close long positions. When price crosses back above the 21-period EMA, close short positions.
The fill technique is also used to fill color between the two moving averages to form a visual indicator to aid in judging market trends.
The dual moving average crossover strategy has the following advantages:
- Simple logic and easy to understand and implement;
- Crossovers of the two moving averages reliably indicate changes in trend direction;
- Visual indicator intuitively displays price fluctuation levels;
- Trailing stop loss and take profit locks in profits and reduces risks;
- High extensibility for various optimizations based on this strategy.
There are also some risks with this strategy:
- Prone to whipsaws and generating false signals during range-bound periods;
- Improper stop loss and take profit settings may lead to losses or reduced profits;
- Inadequate parameter tuning (e.g. period lengths) may adversely affect strategy performance;
- Automated trading may trigger consecutive losses.
The following measures can be adopted to address the above risks:
- Add filters to avoid entering during choppy periods;
- Optimize stop loss and take profit parameters to balance risk-return;
- Test parameter robustness and select appropriate parameters for the market;
- Manually intervene during exceptional circumstances to prevent enlarged losses.
The strategy can be improved in the following aspects:
- Add other technical indicator filters, such as volume and volatility, to avoid false breakouts;
- Dynamically optimize moving average parameters based on machine learning;
- Incorporate sentiment and news analytics to improve decisions;
- Build in adaptive stop loss mechanism to adjust stop loss scale based on market conditions.
This strategy identifies trend changes using crossovers between fast and slow moving averages, and makes corresponding long and short decisions. It has advantages like simplicity, intuitiveness and ease of implementation, but also bears some risks. The risks can be reduced and performance improved via parameter optimization, adding filters, manual oversight etc. The strategy has great extensibility and is worth in-depth research and application.
[/trans]
Source (PineScript)
/*backtest
start: 2024-01-27 00:00:00
end: 2024-02-26 00:00:00
period: 4h
basePeriod: 15m
exchanges: [{"eid":"Futures_Binance","currency":"BTC_USDT"}]
*/

//@version=5
strategy("BMSB Breakout Strategy", shorttitle="BMSB Breakout", overlay=true)

source = close
smaLength = 20
emaLength = 21

sma = ta.sma(source, smaLength)
ema = ta.ema(source, emaLength)

outSma = request.security(syminfo.tickerid, timeframe.period, sma)
outEma = request.security(syminfo.tickerid, timeframe.period, ema)

smaPlot = plot(outSma, color=color.new(color.red, 0), title='20w SMA')
emaPlot = plot(outEma, color=color.new(color.green, 0), title='21w EMA')

fill(smaPlot, emaPlot, color=color.new(color.orange, 75), fillgaps=true)

// Definir condiciones para la estrategia de compra y venta
buyCondition = ta.crossover(close, outSma)
sellCondition = ta.crossunder(close, outEma)

// Entrada larga (compra) y salida corta
strategy.entry("Long", strategy.long, when=buyCondition and not na(sellCondition))
strategy.close("Short", when=buyCondition)

// Entrada corta (venta) y salida larga
strategy.entry("Short", strategy.short, when=sellCondition and not na(buyCondition))
strategy.close("Long", when=sellCondition)

// Puedes ajustar la configuración de la estrategia y los valores predeterminados según tus preferencias

plotshape(series=buyCondition, location=location.belowbar, color=color.green, style=shape.triangleup, title="Buy Signal")
plotshape(series=sellCondition, location=location.abovebar, color=color.red, style=shape.triangledown, title="Sell Signal")
Detail
https://www.fmz.com/strategy/442921
Last Modified
2024-02-27 13:51:51
