Name
基于双EMA价格摆动策略The-Dual-EMA-Price-Swing-Strategy
Author
ChaoZhang
Strategy Description
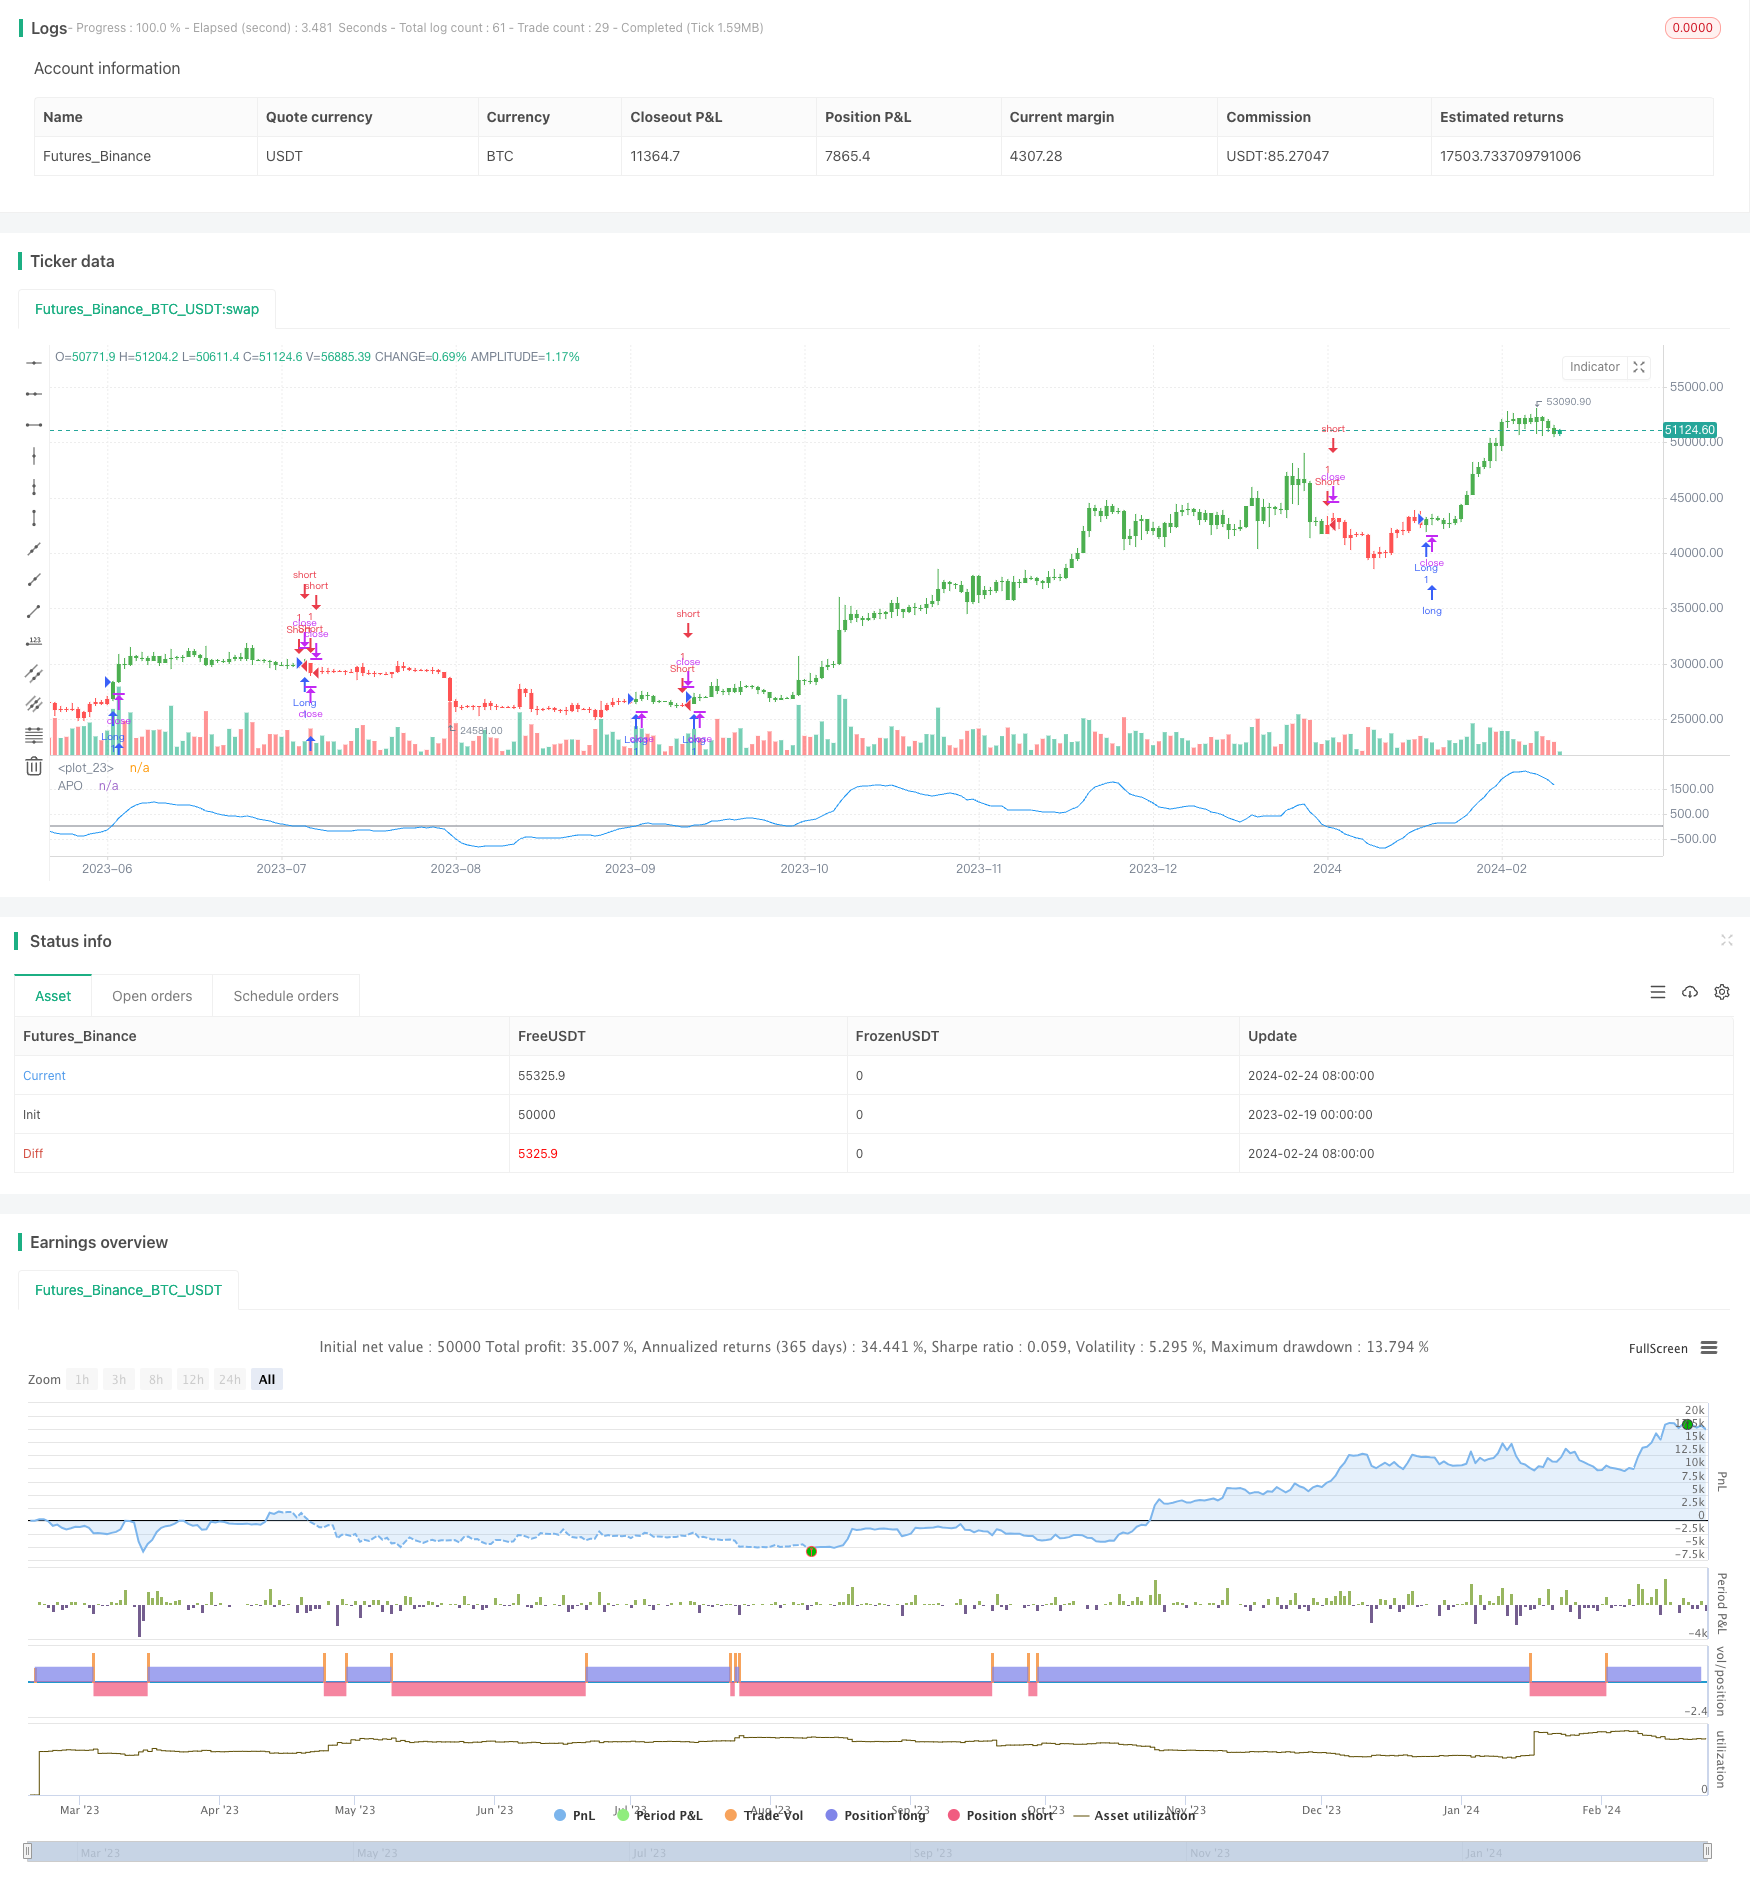
双EMA价格摆动策略通过计算两个不同期限的EMA之间的差值,来判断市场的多空态势和力度。当快线和慢线之间差值上穿0时为看涨信号。当快线和慢线之间差值下穿0时为看跌信号。
该策略简单易用,通过EMA的差值判断市场力度和方向。但是也存在一定的滞后性,无法及时捕捉turning point。
双EMA价格摆动策略的核心指标是APO,即Absolute Price Oscillator,表示两个EMA之间的差值。其计算公式如下:
APO = EMA(短期) - EMA(长期)
具体来说,本策略中APO的计算为:
xShortEMA = ema(收盘价, LengthShortEMA)

xLongEMA = ema(收盘价, LengthLongEMA)

xAPO = xShortEMA - xLongEMA
其中LengthShortEMA和LengthLongEMA分别代表短期和长期EMA的周期长度。
APO几个关键判断规则:
- 当APO上穿0时为看涨信号
- 当APO下穿0时为看跌信号
- APO为正表示目前处于看涨状态
- APO为负表示目前处于看跌状态
根据APO的实时值来判断市场的多空状态和进入时机。
双EMA价格摆动策略具有以下几个主要优势:
- 使用指数移动平均线,能够有效平滑价格数据,减少噪音的影响
- APO指标结合两个EMA,能够同时判断价格趋势和市场力度
- 策略信号简单清晰,容易判断和实现
- 可自定义EMA周期,适应不同品种和交易风格
- 可 reverse 信号,适用于反向和做空交易
双EMA价格摆动策略也存在一些风险,主要体现在:
- EMA本身存在滞后性,无法及时捕捉价格转折点
- 默认参数可能不适合所有品种,需要优化参数
- 信号频繁,容易产生假信号
- 无法确定入场后的止损和止盈位置
- 存在一定的延迟,可能错过最佳入场时机
可以通过合理止损,降低单笔亏损;优化参数,适应不同周期;结合其他指标过滤信号,提高策略稳定性,来应对和降低这些风险。
双EMA价格摆动策略主要可以从以下几个方向进行优化:
-
优化EMA周期参数,分别测试长度为5到60的EMA组合,找到最优参数
-
加入MA,KDJ,MACD等其他指标,设置过滤条件,避免假信号
-
利用布林带,KD等指标确定合理止盈止损位置
-
结合趋势指数等指标,判断价格趋势,避免逆势交易
-
加入交易量指标,确保有成交量支撑的突破信号
-
设定再入场条件,避免频繁交易,减少交易次数
综上所述,双EMA价格摆动策略通过计算两个EMA的差值APO来判断市场多空状态,策略信号简单清晰,实用性强,也存在一定弊端。我们可以通过参数优化、过滤条件新增、止损止盈设置等方法来优化和提高策略稳定性。该策略易于上手使用,也有很大的拓展空间,适合量化交易初学者学习和应用。
||
The Dual EMA Price Swing strategy judges market sentiment and momentum by calculating the difference between two EMAs of different periods. An up-crossing of the difference value above 0 is a bullish signal. A down-crossing below 0 is a bearish signal.
The strategy is simple and easy to use, judging market momentum and direction through EMA difference. However, it also has some laggingness and cannot timely capture turning points.
The core indicator of the Dual EMA Price Swing strategy is APO, namely Absolute Price Oscillator, representing the difference between two EMAs. Its formula is:
APO = EMA(short period) − EMA(long period)
Specifically, the APO in this strategy is calculated as:
xShortEMA = ema(close price, LengthShortEMA)

xLongEMA = ema(close price, LengthLongEMA)

xAPO = xShortEMA − xLongEMA
Where LengthShortEMA and LengthLongEMA represent the cycle lengths of the short-term and long-term EMAs respectively.
Several key judgment rules of APO:
- An up-crossing of APO above 0 is a bullish signal
- A down-crossing of APO below 0 is a bearish signal
- A positive APO indicates a current bull state
- A negative APO indicates a current bear state
Determine market sentiment and entry timing based on the real-time value of APO.
The Dual EMA Price Swing Strategy has the following main advantages:
- Using exponential moving average can effectively smooth price data and reduce noise impact
- The APO indicator combines two EMAs to judge both price trend and market momentum
- The strategy signal is simple and clear, easy to determine and implement
- Customizable EMA cycles adapt to different varieties and trading styles
- Reversible signals apply to reverse and short trading
The Dual EMA Price Swing Strategy also has some risks, mainly in:
- EMA itself has laggingness and cannot capture price turning points in time
- Default parameters may not apply to all varieties, parameters need optimization
- Frequent signals tend to produce false signals
- Unable to determine stop loss and take profit after opening position
- There is certain lag, possibly missing the best entry timing
We can cope with and reduce these risks by applying reasonable stop loss to reduce single loss; optimizing parameters to adapt cycles; combining other indicators to filter signals and improve strategy stability.
The Dual EMA Price Swing Strategy can be optimized in the following aspects:
- Optimize EMA cycle parameters, test combinations of length 5 to 60 to find optimum
- Add other indicators like MA, KDJ, MACD to set filter conditions and avoid false signals
- Use Bollinger Bands, KD to determine reasonable stop loss and take profit
- Combine trend index to judge price trend, avoid trading against trend
- Add trading volume indicator to ensure signals with volume support
- Set re-entry conditions to reduce transactions and trading frequency
In summary, the Dual EMA Price Swing Strategy judges market sentiment by calculating the APO difference between two EMAs. The strategy signal is simple and practical, but also has some drawbacks. We can optimize it through parameter tuning, adding filters, setting stops and more. Easy to use for beginners, also with great potential for expansions. Suitable for quant trading learners to study and apply.
[/trans]
Strategy Arguments
| Argument | Default | Description |
|---|---|---|
| v_input_1 | 10 | LengthShortEMA |
| v_input_2 | 20 | LengthLongEMA |
| v_input_3 | false | Trade reverse |
Source (PineScript)
/*backtest
start: 2023-02-19 00:00:00
end: 2024-02-25 00:00:00
period: 1d
basePeriod: 1h
exchanges: [{"eid":"Futures_Binance","currency":"BTC_USDT"}]
*/

//@version=2
////////////////////////////////////////////////////////////
//  Copyright by HPotter v1.0 30/05/2017
// The Absolute Price Oscillator displays the difference between two exponential
// moving averages of a security's price and is expressed as an absolute value.
// How this indicator works
//    APO crossing above zero is considered bullish, while crossing below zero is bearish.
//    A positive indicator value indicates an upward movement, while negative readings
//      signal a downward trend.
//    Divergences form when a new high or low in price is not confirmed by the Absolute Price
//      Oscillator (APO). A bullish divergence forms when price make a lower low, but the APO
//      forms a higher low. This indicates less downward momentum that could foreshadow a bullish
//      reversal. A bearish divergence forms when price makes a higher high, but the APO forms a
//      lower high. This shows less upward momentum that could foreshadow a bearish reversal.
//
// You can change long to short in the Input Settings
// Please, use it only for learning or paper trading. Do not for real trading.
////////////////////////////////////////////////////////////
strategy(title="Absolute Price Oscillator (APO) Backtest", shorttitle="APO")
LengthShortEMA = input(10, minval=1)
LengthLongEMA = input(20, minval=1)
reverse = input(false, title="Trade reverse")
hline(0, color=gray, linestyle=line)
xPrice = close
xShortEMA = ema(xPrice, LengthShortEMA)
xLongEMA = ema(xPrice, LengthLongEMA)
xAPO = xShortEMA - xLongEMA
pos = iff(xAPO > 0, 1,
       iff(xAPO < 0, -1, nz(pos[1], 0)))
possig = iff(reverse and pos == 1, -1,
          iff(reverse and pos == -1, 1, pos))
if (possig == 1)
    strategy.entry("Long", strategy.long)
if (possig == -1)
    strategy.entry("Short", strategy.short)
barcolor(possig == -1 ? red: possig == 1 ? green : blue )
plot(xAPO, color=blue, title="APO")
Detail
https://www.fmz.com/strategy/442834
Last Modified
2024-02-26 13:52:41
