Name
基于四条EMA均线策略4-EMA-Trend-Strategy
Author
ChaoZhang
Strategy Description
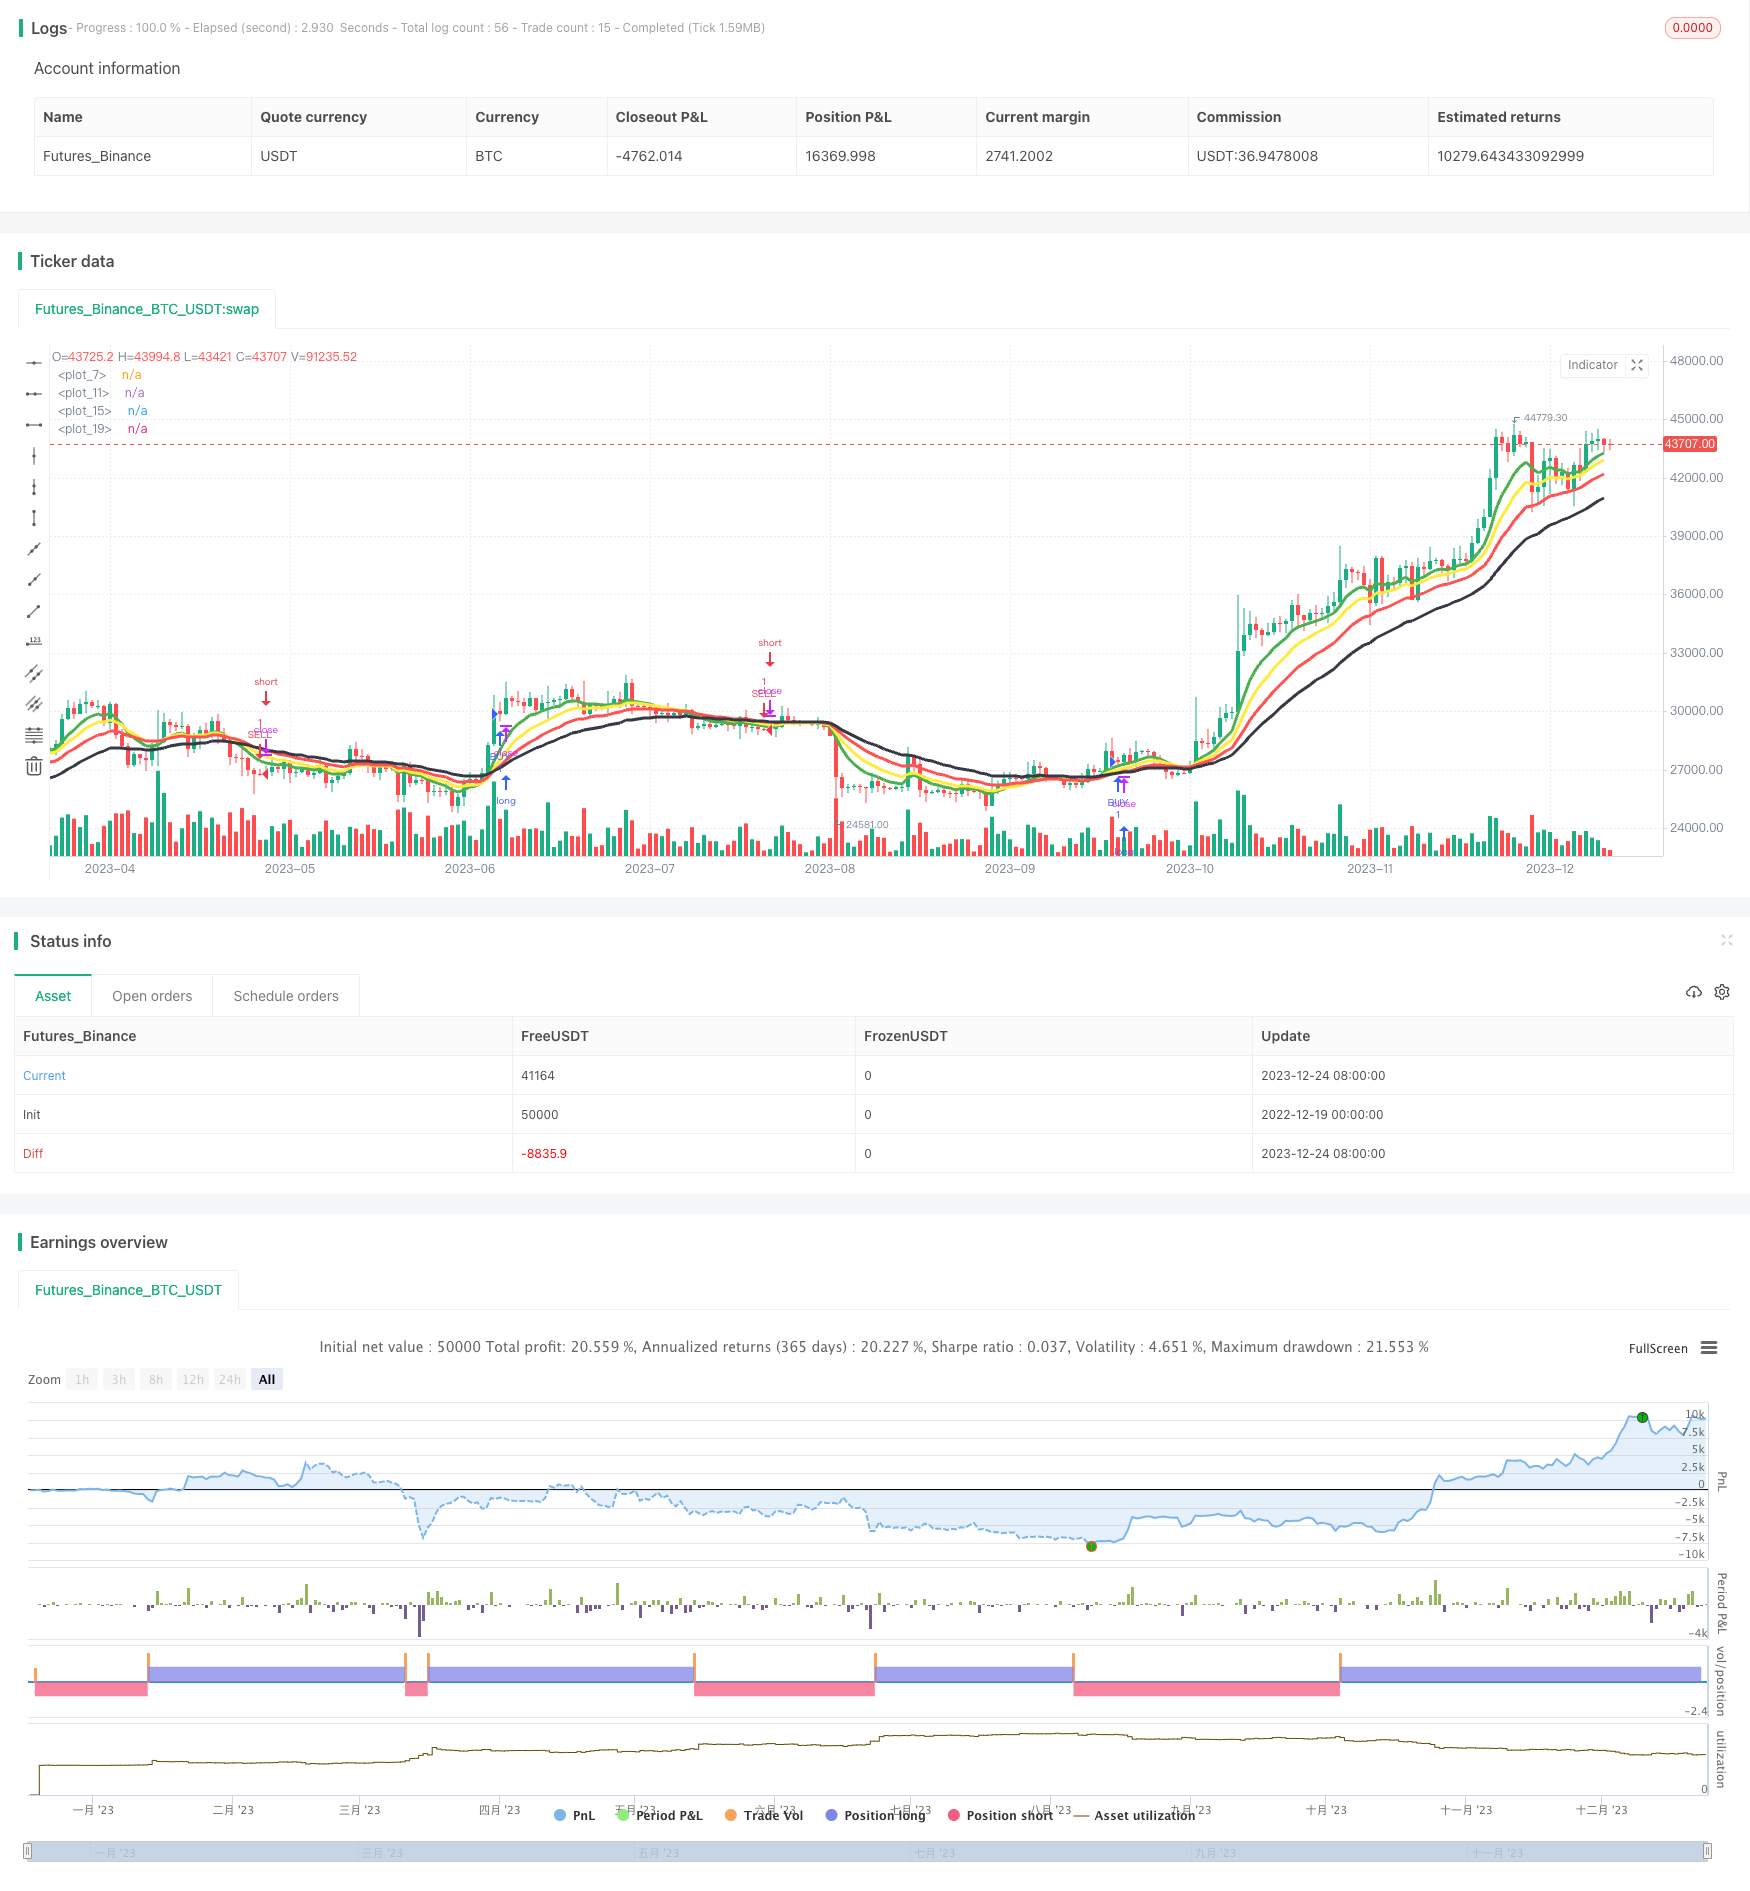
本策略基于四条不同周期的EMA均线比较,实现趋势跟踪交易。当快速EMA线上穿中速EMA线,中速EMA线上穿慢速EMA线,慢速EMA线上穿最慢速EMA线时,做多;当快速EMA线下穿中速EMA线,中速EMA线下穿慢速EMA线,慢速EMA线下穿最慢速EMA线时,做空。该策略同时结合了日期过滤条件,只在指定的日期区间内交易。
该策略的核心逻辑基于四条EMA均线的比较。EMA均线可以有效平滑价格数据,滤除市场噪音,突出主要趋势。快速EMA线能最快反映价格变化,中速EMA稍微滞后,慢速EMA线再稍微滞后,最慢EMA线滞后效应最大。当快速EMA线上穿中速线,中速EMA线上穿慢速线,慢速EMA线上穿最慢速线时,说明目前处于强势上涨趋势,这时策略会开仓做多;反之,当快速EMA线下穿中速线,中速EMA线下穿慢速线,慢速EMA线下穿最慢速线时,说明目前处于强势下跌趋势,这时策略会开仓做空。
该策略还结合了日期条件过滤,只在指定的日期区间内交易,可以避免特定时间段的异常波动对策略的影响。
具体来说,策略中的四条EMA均线周期分别为8日、13日、21日和34日。这四条均线的周期都比较短,主要用来捕捉短期和中期趋势。策略指定的日期区间为2018年6月1日至2019年12月31日。只有价格数据在这个时间段里,且满足四EMA的比较关系时,策略才会发出交易信号。
这种四EMA趋势策略有以下几个优势:
- 使用多组EMA均线识别趋势,精确度较高,可有效跟踪市场趋势;
- 均线周期较短,可以快速响应价格变化,捕捉短期和中期走势;
- 结合日期条件过滤,可以避开异常行情的影响,提高策略稳定性;
- 策略逻辑简单清晰,容易理解和回测;
- 可灵活调整EMA均线的周期参数,适应不同品种和周期的行情特征。
该策略也存在一些风险需要注意:
- EMA均线本身存在滞后性,可能错过短期的反转机会;
- SPECIFIED日期区间如果设定不当,可能导致样本数量太少,回测结果不稳定;
- 策略仅基于均线关系建立逻辑,没有结合其他因素,可能发生假信号;
- 策略没有设置止损条件,存在较大的资金风险。
为了降低上述风险,我们可以从以下几个方面进行优化:
- 结合其他指标如MACD、KD等判断趋势信号,避免假信号的产生;
- 加入适当的止损机制,控制每单和总体的风险;
- 测试更多品种和周期的数据,调整EMA参数,使之更符合不同市场环境。
该策略主要可以从以下几个方面进行优化:
-
参数优化:调整EMA均线的长度参数,适应不同周期和不同品种,使策略对趋势的判断更准确。
-
止损机制:设置合理的止损点,比如ATR止损或趋势止损,控制单笔和总体的风险。
-
过滤条件:加入其他辅助指标,避免在没有明确趋势时发出错误信号。例如结合RSI、MACD等指标作为过滤信号。
-
止盈退出:设定合理的止盈位置或策略,在 tren保证一定盈利后退出市场。这可以锁定利润,避免利润回吐。
-
算法交易:将策略参数化,并接入算法交易系统,实现自动化交易,expand策略的适用范围。
本策略基于四条EMA均线之间的比较关系判断趋势方向,属于简单实用型的趋势跟踪策略。它响应迅速,可有效跟踪短期和中期趋势,回测效果较好。我们可以通过调整参数,加入辅助过滤条件,以及设置止损止盈来降低风险和提高效率。此外,参数化和算法化也是本策略的重要优化方向,可以大幅提升策略的适用面。总的来说,四EMA均线策略是一个非常实用的量化交易策略,具有较强的普适性,值得量化交易者重点学习和优化。
||
This strategy is based on the comparison of four EMA lines with different periods to implement trend-following trading. It goes long when the fast EMA line crosses above the medium EMA line, the medium EMA line crosses above the slow EMA line, and the slow EMA line crosses above the slowest EMA line. It goes short when the opposite crossing relationships happen. The strategy also incorporates date filter conditions, only trading within the specified date range.
The core logic of this strategy is based on the comparison of four EMA lines. The EMA lines can effectively smooth the price data and highlight the major trends. The fast EMA line reflects price change fastest, while the medium EMA has some lag, the slow EMA has more lag, and the slowest EMA has the most lag. When the fast EMA crosses above the medium EMA, the medium EMA crosses above the slow EMA, and the slow EMA crosses above the slowest EMA, it signals an uptrend, and the strategy will go long. When the opposite crossing sequence happens, it signals a downtrend and the strategy will go short.
The strategy also uses a date filter condition, only trading within the specified date range between 2018-06-01 and 2019-12-31. This avoids abnormal volatility outside this period affecting the strategy.
Specifically, the periods of the four EMA lines are 8, 13, 21, and 34 days respectively. They are relatively short-term to capture short-term and medium-term trends. The strategy will only generate trade signals when price data satisfy the EMA crossing relationships within the specified date range.
The advantages of this 4-EMA trend strategy are:
- Using multiple EMA lines to identify trends with higher accuracy and effectively follow market trends.
- The short EMA periods can quickly respond to price changes and capture short-term and medium-term trends.
- The date filter avoids the impact of anomalous market moves and improves strategy stability.
- The strategy logic is simple and clear, easy to understand and backtest.
- The EMA parameters can be flexibly adjusted to adapt to different products and market conditions.
There are also some risks of this strategy:
- The inherent lag of EMA lines may miss short-term reversal opportunities.
- If the date range filter is set improperly, the sample size could be too small and backtest results unstable.
- The strategy relies solely on EMA relationship without other factors, which may generate false signals.
- There is no stop loss mechanism, leading to high capital risk.
To reduce the above risks, some optimization directions are:
- Combine other indicators like MACD, KD to confirm signal validity and avoid false signals.
- Add proper stop loss mechanisms to control per trade and total risk.
- Test more products and periods to adjust EMA parameters for better adaptation.
The main optimization directions are:
-
Parameter Optimization: Adjust EMA periods to fit different cycles and products for better trend judgment.
-
Risk Control: Add reasonable stop loss like ATR or trend-based stop loss to control per trade and total risk.
-
Signal Filtering: Add other auxiliary indicators to avoid signals without a clear trend, e.g. RSI and MACD filters.
-
Profit Taking: Set proper profit taking rules to lock in profits and avoid retracements.
-
Automated Trading: Parameterize the strategy and integrate with auto-trading systems to expand applicability.
This is a simple and practical trend-following strategy based on 4-EMA line comparisons. It responds quickly and tracks short-term & medium-term trends effectively with good backtest results. We can optimize it by adjusting parameters, adding filters and stop losses to reduce risk and increase efficiency. Parameterization and automation are also important directions enabling wider applicability. In conclusion, the 4-EMA strategy is a robust and versatile quant trading strategy worthy of further research and optimization.
[/trans]
Strategy Arguments
| Argument | Default | Description |
|---|---|---|
| v_input_1 | 8 | length1 |
| v_input_2 | 13 | length2 |
| v_input_3 | 21 | length3 |
| v_input_4 | 34 | length4 |
| v_input_5 | 2018 | yearfrom |
| v_input_6 | 2019 | yearuntil |
| v_input_7 | 6 | monthfrom |
| v_input_8 | 12 | monthuntil |
| v_input_9 | true | dayfrom |
| v_input_10 | 31 | dayuntil |
Source (PineScript)
/*backtest
start: 2022-12-19 00:00:00
end: 2023-12-25 00:00:00
period: 1d
basePeriod: 1h
exchanges: [{"eid":"Futures_Binance","currency":"BTC_USDT"}]
*/

//@version=3
strategy("4 EMA TREND Strategy ", overlay=true)


length1 = input(8, minval=1)
outFAST = ema(close,length1)
plot(outFAST, color=green ,linewidth=3)

length2 = input(13, minval=1)
outM = ema(close, length2)
plot(outM, color=yellow,linewidth=3)

length3 = input(21, minval=1)
outSLOW = ema(close, length3)
plot(outSLOW, color=red,linewidth=3)

length4 = input(34, minval=1)
outSLOWEST = ema(close, length4)
plot(outSLOWEST, color=black,linewidth=3)

price = close


yearfrom = input(2018)
yearuntil =input(2019)
monthfrom =input(6)
monthuntil =input(12)
dayfrom=input(1)
dayuntil=input(31)


if (  (outFAST>outM) and (outM > outSLOW) and(outSLOW>outSLOWEST))
    strategy.entry("BUY", strategy.long, stop=close, oca_name="TREND", comment="BUY")

else
    strategy.cancel(id="BUY")


if   (  (outFAST<outM) and (outM<outSLOW) and (outSLOW <outSLOWEST))

    strategy.entry("SELL", strategy.short,stop=close, oca_name="TREND", comment="SELL")
else
    strategy.cancel(id="SELL")
Detail
https://www.fmz.com/strategy/436606
Last Modified
2023-12-26 11:10:39
