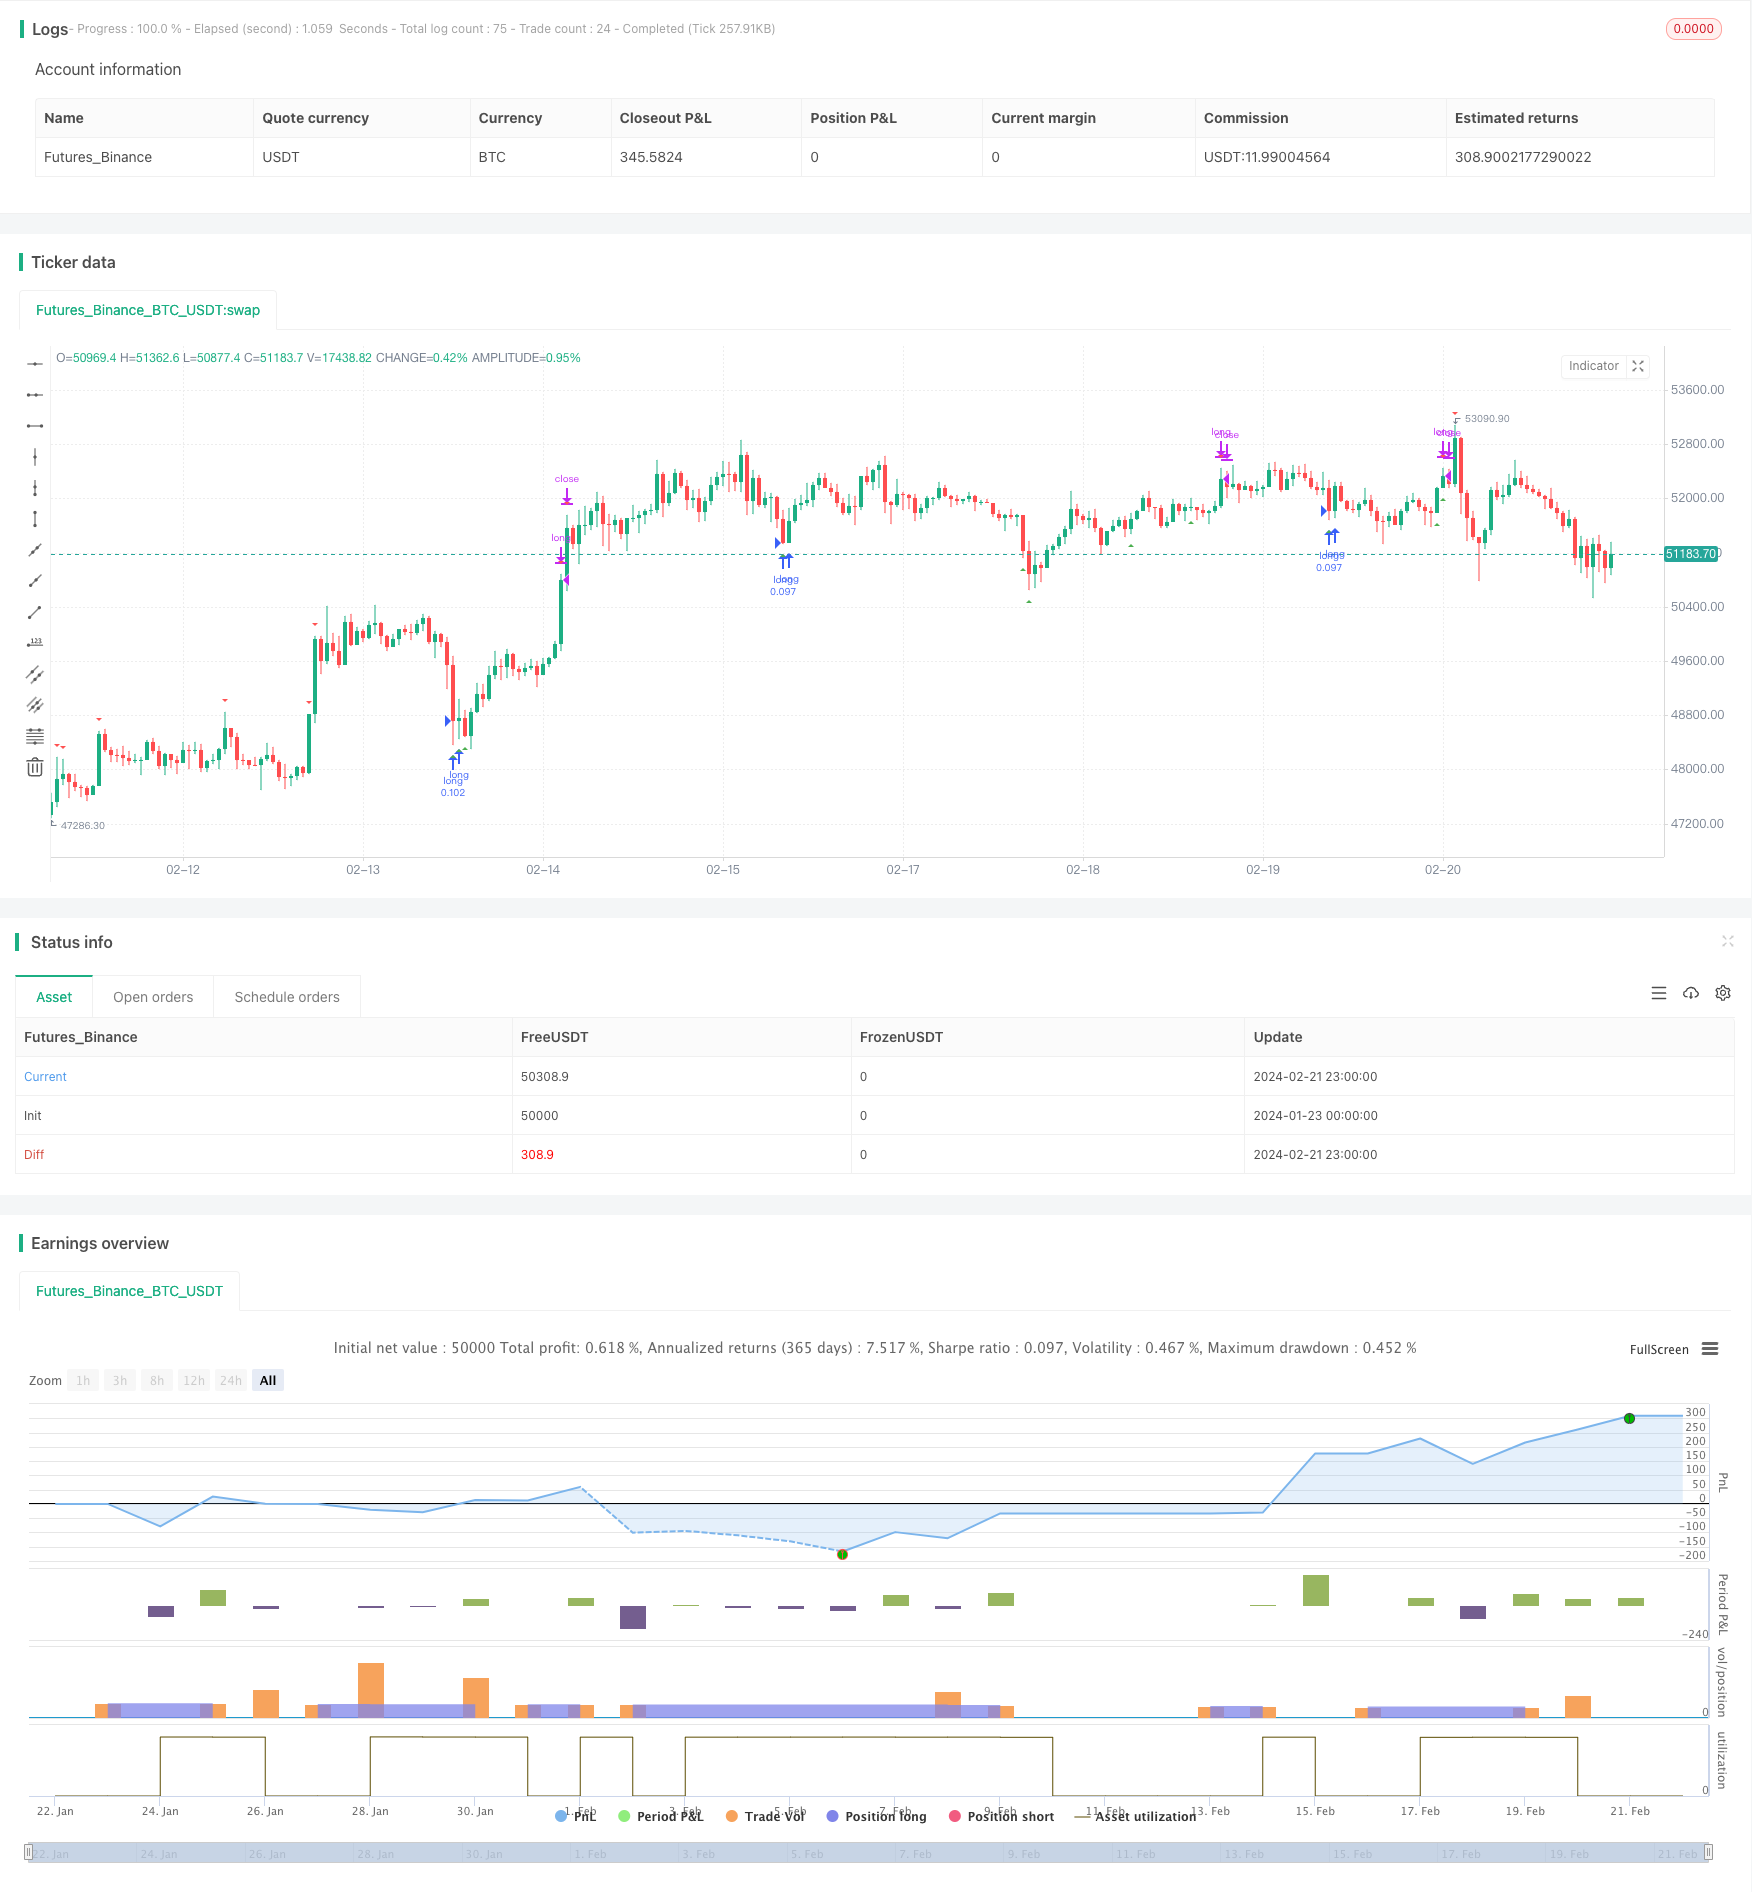
Name
基于四重交叉策略Quadruple-Crossing-Strategy
Author
ChaoZhang
Strategy Description
四重交叉策略是一种中长线交易策略。它综合使用多种技术指标来识别股价的趋势变化,在关键点产生交易信号。主要的技术指标包括均线、成交量、相对强弱指数(RSI)和移动平均聚散指标(MACD)。这种多指标组合能够提高信号的可靠性,降低错误交易的概率。
四重交叉策略的交易决策基于下述四组指标的组合信号:
- 价格与200日指数移动平均线(EMA200)的交叉
- 价格本日收盘价与前一日收盘价的关系
- 成交量的放大特征
- RSI的超买超卖信号
- MACD的黄金交叉与死亡交叉
当这四组指标发出同一方向的信号时,即产生交易决策。另外,还设置了两个独立的信号来补充:价格与20日EMA的距离比率和布林带边界触及。总体而言,该策略追求降低错误信号的概率,取得较为可靠的交易机会。
四重交叉策略综合运用多种指标,这是其最大的优势。单一指标很难全面判断市场,组合指标可以提供更多维度的参考,减少错误。具体来说,该策略的主要优势有:
- 使用EMA200判断主线,能识别中长线趋势
- 成交量放大特征过滤假突破
- RSI避免交易超买超卖区域
- MACD判断短期内部趋势和转折
- 双重独立信号提高可靠性
总的来说,四重交叉策略非常适合中长线持仓交易,能够在主线大趋势中获取较稳定的报酬。
四重交叉策略也存在一些风险,主要集中在以下几个方面:
- 指标发出错误信号的概率仍存在
- 没有止损止盈设置,无法控制单笔损失
- 回撤可能较大,需要有足够的心理承受能力
- 交易频率可能过于频繁或稀疏
- 参数设置不当会影响实际效果
此外,四重交叉策略对参数和条件进行了预设,这也制约了其适应性。如果市场环境发生重大变化,该策略的效果会打折扣。
根据上述风险分析,四重交叉策略可以从以下几个方面进行优化:
- 增加止损止盈功能,控制单笔损失
- 调整参数组合,优化交易频率
- 引入算法判断,提高策略的适应性
- 增加更多条件限制,进一步控制错误交易
这些优化能够在保持策略优点的同时,降低交易风险,提高报酬率。
综上所述,四重交叉策略利用多指标判断的优势控制风险,旨在获取高概率和高可靠性的中长线交易机会。它非常适合有足够资金和心理承受能力的投资者持有。通过引入止损止盈和动态优化等手段,该策略可以得到进一步增强。它代表了多指标综合运用交易思路的典型范例。
||
The Quadruple Crossing Strategy is a medium-to-long term trading strategy. It combines various technical indicators to identify trend changes in stock prices and generates trading signals at critical points. The main technical indicators include moving averages, trading volumes, Relative Strength Index (RSI) and Moving Average Convergence Divergence (MACD). This multi-indicator combination can improve signal reliability and reduce the probability of erroneous trades.
The Quadruple Crossing Strategy makes trading decisions based on combined signals from the following four sets of indicators:
- Price crossing its 200-day Exponential Moving Average (EMA200)
- Relationship between the closing price today and the previous day
- Amplification feature of trading volumes
- Oversold and overbought signals from RSI
- Golden crosses and death crosses of MACD
Trading decisions are triggered when these four indicator sets give signals in the same direction. In addition, two independent signals are configured to complement: ratio of price deviation from its 20-day EMA and touching boundaries of Bollinger Bands. In general, this strategy seeks to reduce the probability of wrong signals and capture relatively reliable trading opportunities.
The biggest advantage of the Quadruple Crossing Strategy lies in the combinatorial use of multiple indicators. A single indicator can hardly judge the market comprehensively. Combined indicators provide references in more dimensions, reducing errors. Specifically, the main advantages of this strategy include:
- Using EMA200 to identify the main trendline and spot mid-to-long term trends
- Price amplification feature filters false breakouts
- RSI avoids trading in overbought/oversold zones
- MACD judges short-term internal trends and reversals
- The double independent signals improve reliability
In general, the Quadruple Crossing Strategy is very suitable for medium-to-long term position trading, capable of getting relatively steady returns along major trends.
The Quadruple Crossing Strategy also carries some risks, mainly in the following aspects:
- The probability of wrong signals from the indicators still exists
- Lack of stop loss/take profit fails to control single loss
- Larger drawdowns require sufficient psychological bearing capability
- Trading frequency may be too high or too sparse
- Improper parameter settings affect actual performance
In addition, preset parameters and conditions also limit the adaptiveness of the Quadruple Crossing Strategy. Its performance may degrade significantly if market environments see major changes.
Based on the above risk analysis, the Quadruple Crossing Strategy can be optimized in the following aspects:
- Add stop loss/take profit functions to control single losses
- Adjust parameter combinations to optimize trading frequency
- Introduce algorithmic judgments to improve adaptability
- Add more condition restrictions to further control erroneous trades
These optimizations can reduce trading risks while maintaining the merits of the original strategy, improving the rate of return.
In summary, by leveraging the advantage of multi-indicator judgments, the Quadruple Crossing Strategy seeks to capture high probability and high reliability medium-to-long term trading opportunities while controlling risks. It suits investors with sufficient funds and psychological bearing capability. By introducing elements like stop loss/take profit and dynamic optimizations, this strategy can be further enhanced. It represents a typical example of combinatorial application of multi-indicator trading ideas.
[/trans]
Source (PineScript)
/*backtest
start: 2024-01-23 00:00:00
end: 2024-02-22 00:00:00
period: 1h
basePeriod: 15m
exchanges: [{"eid":"Futures_Binance","currency":"BTC_USDT"}]
*/

// This Pine Script™ code is subject to the terms of the Mozilla Public License 2.0 at https://mozilla.org/MPL/2.0/
// © anonXmoous

//@version=5
strategy("Quadruple Cross Strategy", overlay=true, initial_capital=100000, currency="TRY", default_qty_type=strategy.percent_of_equity, default_qty_value=10, pyramiding=0, commission_type=strategy.commission.percent, commission_value=0.1)

// Verileri tanımla
price = close
ema200 = ta.ema(price, 200)
ema20 = ta.ema(price, 20)
vol= volume
rsi = ta.rsi(price, 14)
[macdLine, signalLine, histLine] = ta.macd(price, 12, 26, 9)
n = 20 // SMA periyodu
k = 2.5 // Standart sapma katsayısı
// Bollinger bandı parametrelerini tanımla
sma = ta.sma(price, n) // 20 günlük SMA
std = ta.stdev(price, n) // 20 günlük standart sapma
upperBB = sma + k * std // Bollinger bandının üst sınırı
lowerBB = sma - k * std // Bollinger bandının alt sınırı

// Alım sinyali koşullarını belirle
buyCondition1 = price > ema200 and (price - ema200) / ema200 <= 0.05 or price == ema200
buyCondition2 = price > price[1]
buyCondition3 = vol > vol[1] and vol[1] > vol[2]
buyCondition4 = rsi > 35 and rsi > rsi[1]
buyCondition5 = macdLine > signalLine and histLine > 0
buyCondition6 = price < ema20 and (price - ema20) / ema20 <= -0.14 // bağımsız al değiken 1
buyCondition7 = price < lowerBB // bağımsız al değiken 2- Bollinger bandının alt sınırına dokunduysa, alım sinyali

// Satım sinyali koşullarını belirle
sellCondition1 = price < ema200 and (price - ema200) / ema200 >= -0.03 or price == ema200
sellCondition2 = price < price[1]
sellCondition3 = vol > vol[1] and vol[1] > vol[2]
sellCondition4 = rsi < 65 and rsi < rsi[1]
sellCondition5 = macdLine < signalLine and histLine < 0
sellCondition6 = price > ema20 and (price - ema20) / ema20 >= 0.19 // bağımsız sat değiken 1
sellCondition7 = price > upperBB // bağımsız sat değiken 2- Bollinger bandının üst sınırına dokunduysa, satım sinyali

// Alım ve satım sinyallerini oluştur
buySignal = (buyCondition1 and buyCondition2 and buyCondition3 and buyCondition4 and buyCondition5) or buyCondition6 or buyCondition7
sellSignal = (sellCondition1 and sellCondition2 and sellCondition3 and sellCondition4 and sellCondition5) or sellCondition6 or sellCondition7

// Alım ve satım sinyallerini stratejiye ekle
if (buySignal)
    strategy.entry("long", strategy.long, comment = "Buy")
if (sellSignal)
    strategy.close("long", comment = "Sell")
// Alım ve satım sinyallerini grafik üzerinde göster
plotshape(buySignal, style=shape.triangleup, location=location.belowbar, color=color.new(color.green, 0), size=size.small)
plotshape(sellSignal, style=shape.triangledown, location=location.abovebar, color=color.new(color.red, 0), size=size.small)
Detail
https://www.fmz.com/strategy/442640
Last Modified
2024-02-23 14:20:05
