Name
基于均线交叉的趋势跟随策略EMA-Cross-Trend-Following-Strategy
Author
ChaoZhang
Strategy Description
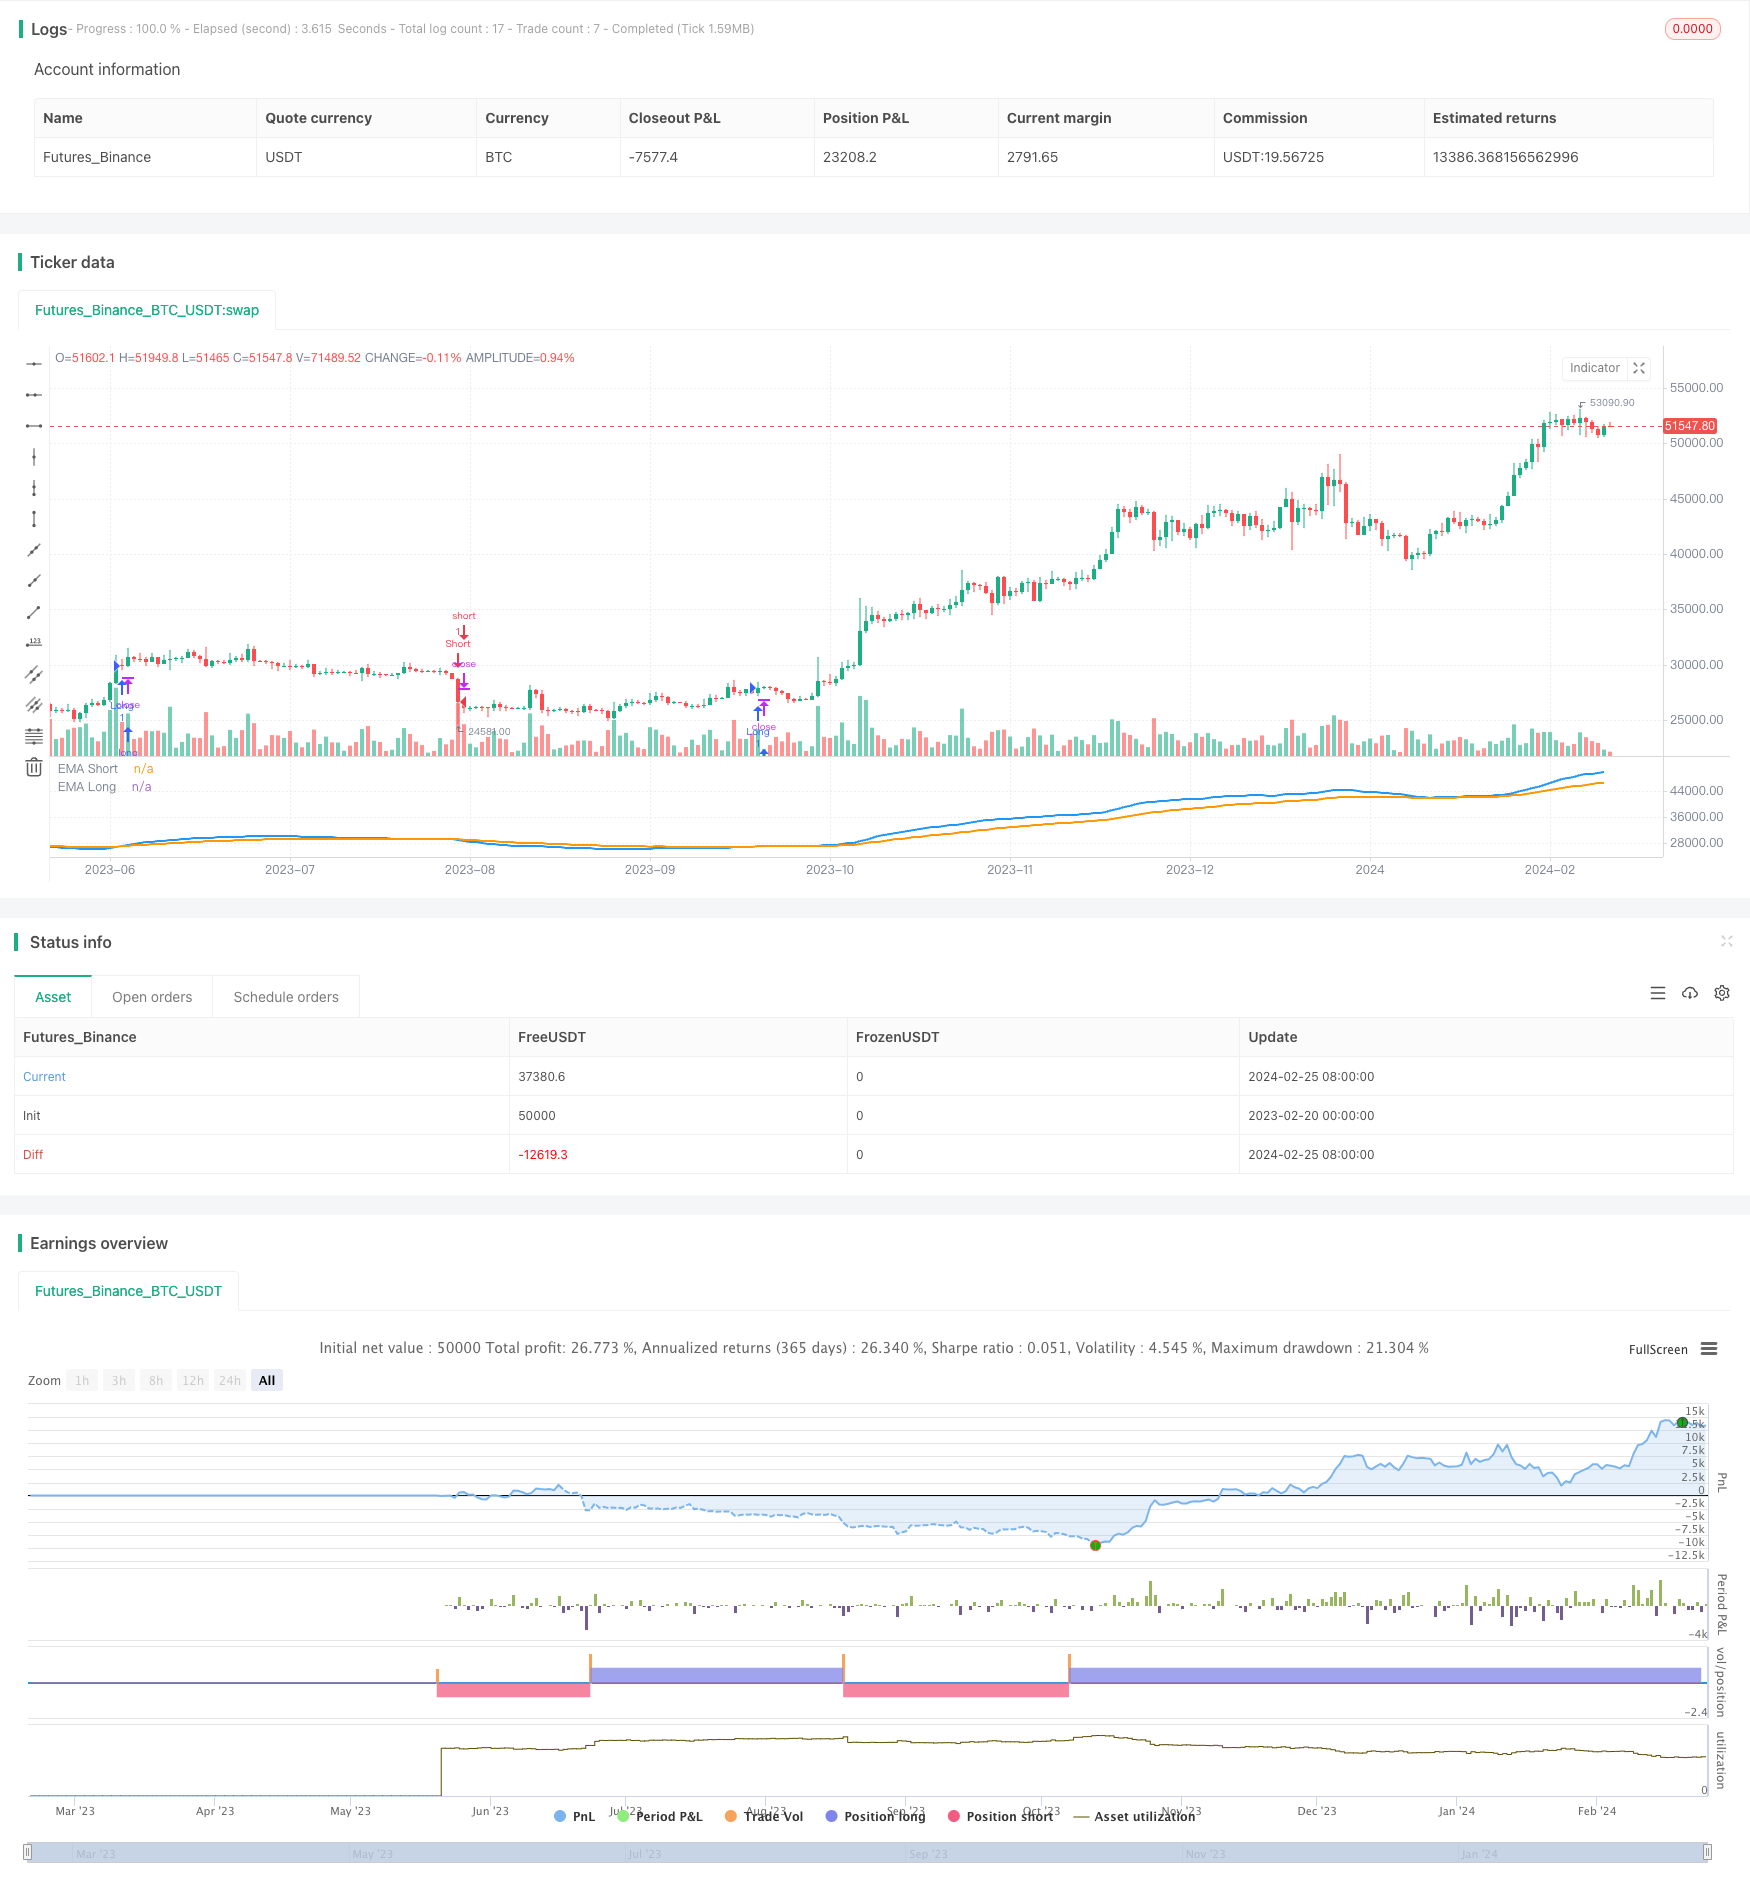
本策略是一个基于EMA均线交叉来生成交易信号的趋势跟随策略。利用快慢均线的交叉来判断价格趋势的变化,在趋势开始的时候进入市场,在趋势结束的时候退出市场,从而获利。
该策略使用快速EMA和慢速EMA两个均线。快速EMA参数设置为20,反应价格变化比较灵敏;慢速EMA参数设置为50,对价格变化响应比较平稳。
当快速EMA从下方向上穿过慢速EMA的时候,表示价格开始上涨,属于买点信号;当快速EMA从上方向下穿过慢速EMA的时候,表示价格开始下跌,属于卖点信号。
根据这两个信号,我们可以做出相应的交易决策:买点信号出现时做多头入场,卖点信号出现时做空头入场;相反的信号出现时对应的多/空头平仓。
- 利用均线交叉判断价格趋势变化,是一种较为可靠的技术指标
- 快慢均线配合使用,可以有效过滤掉部分噪音,跟踪趋势
- 策略逻辑简单清晰,容易理解和实现
- 可通过调整均线参数来优化策略
- 均线具有滞后性,可能错过价格变化的最佳时间点
- whipsaw效应可能导致过于频繁交易,增加交易成本和滑点损失
- 退市的時候,如果是由于非技术性原因引起,可能无法及時抛出头寸
优化方法:
- 优化均线参数,找到最佳 parameter
- 增加过滤条件,避免 whipsaw 带来的损失
- 设置止损策略,控制单笔损失
该策略可以从以下几个方面进行优化:
-
优化均线参数,找到最佳参数组合。可以通过遍历不同的参数,回测不同的组合,找到收益最优的参数。
-
增加其他技术指标作为过滤条件,避免错 trades。例如可以加入MACD,KDJ等指标,当它们的信号与均线信号一致时才入场。
-
增加止损策略,例如设置固定止损或追踪止损,控制单笔损失。
-
可以考虑结合其他策略,例如趋势跟踪策略,在趋势中乘胜追击;或者mean reversion策略,在价格过度扩张的时候介入反转。
本策略是一个非常典型的趋势跟随策略。通过快慢均线交叉来判断价格趋势的变化,简单有效地捕捉价格趋势。同时也存在一些问题,如延迟入场、whipsaw带来的损失等。这些问题都有对应的解决方案。总的来说,这是一个良好的策略框架,通过参数优化、增加过滤条件、止损策略等手段,可以进一步完善,在实盘中获得良好收益。
||
This strategy is a trend following strategy based on EMA crossovers to generate trading signals. It utilizes crossovers between fast and slow EMAs to determine changes in price trend and get into the market at the start of a trend and exit at the end, in order to profit.
The strategy employs a faster EMA with period 20, which reacts sensitively to price changes, and a slower EMA with period 50, which responds more smoothly.
When the faster EMA crosses above the slower EMA, it signals an upward price trend, indicating a buying opportunity. When the faster EMA crosses below the slower EMA, it signals a downward trend, indicating a selling opportunity.
Based on these signals, we can make corresponding trading decisions: go long when buy signal appears and go short when sell signal appears. When opposite signals show up, we close the corresponding long/short positions accordingly.
- Using EMA crossovers to determine trend changes is a relatively reliable technical indicator
- Combination of faster and slower EMAs helps filter out some noise and track the trend
- Simple and clear strategy logic, easy to understand and implement
- Parameters can be tuned for optimization
- EMAs have lagging effect, may miss best timing of price changes
- Whipsaw effects can cause over-trading, increasing costs and slippage
- Forced exit due to non-technical reasons may prevent timely liquidation
Solutions:
- Optimize EMA parameters to find best fit
- Add filtering conditions to avoid whipsaw losses
- Set stop loss to control single trade loss
The strategy can be improved in the following aspects:
-
Optimize EMA parameters by testing different combinations to find most profitable parameters.
-
Add filtering conditions using other indicators like MACD, KDJ to avoid false signals. Only take trades when additional signals align.
-
Incorporate stop loss mechanisms like fixed or trailing stop to control single trade loss.
-
Consider combining with other strategies, like trend following to ride the momentum, or mean reversion to take reversal positions when price over-extends.
This is a very typical trend following strategy. It captures price trends effectively through simple fast and slow EMA crossovers. There are also some issues like lagging entry, whipsaw losses. But these problems all have solutions. Overall it provides a good strategy framework that can be further enhanced through parameter tuning, filtering, stop loss etc for good practical performance.
[/trans]
Strategy Arguments
| Argument | Default | Description |
|---|---|---|
| v_input_int_1 | 20 | Short EMA Length |
| v_input_int_2 | 50 | Long EMA Length |
Source (PineScript)
/*backtest
start: 2023-02-20 00:00:00
end: 2024-02-26 00:00:00
period: 1d
basePeriod: 1h
exchanges: [{"eid":"Futures_Binance","currency":"BTC_USDT"}]
*/

//@version=5
strategy("Habitrade EMA Cross Strategy"), overlay=true

//Input for EMA lengths
emaShortLength = input.int(20, title="Short EMA Length")
emaLongLength = input.int(50, title="Long EMA Length")

//Calculate EMAs based on inputs
emaShort = ta.ema(close, emaShortLength)
emaLong = ta.ema(close, emaLongLength)

//Plot the EMAs
plot(emaShort, color=color.blue, linewidth=2, title="EMA Short")
plot(emaLong, color=color.orange, linewidth=2, title="EMA Long")

//Generate long and short signals
longCondition = ta.crossover(emaShort, emaLong)
shortCondition = ta.crossunder(emaShort, emaLong)

//Enter long positions
if (longCondition)
    strategy.entry("Long", strategy.long)

//Enter short positions
if (shortCondition)
    strategy.entry("Short", strategy.short)

//Close long positions
if (shortCondition)
    strategy.close("Long")

//Clos short positions
if (longCondition)
    strategy.close("Short")
Detail
https://www.fmz.com/strategy/442958
Last Modified
2024-02-27 16:25:51
