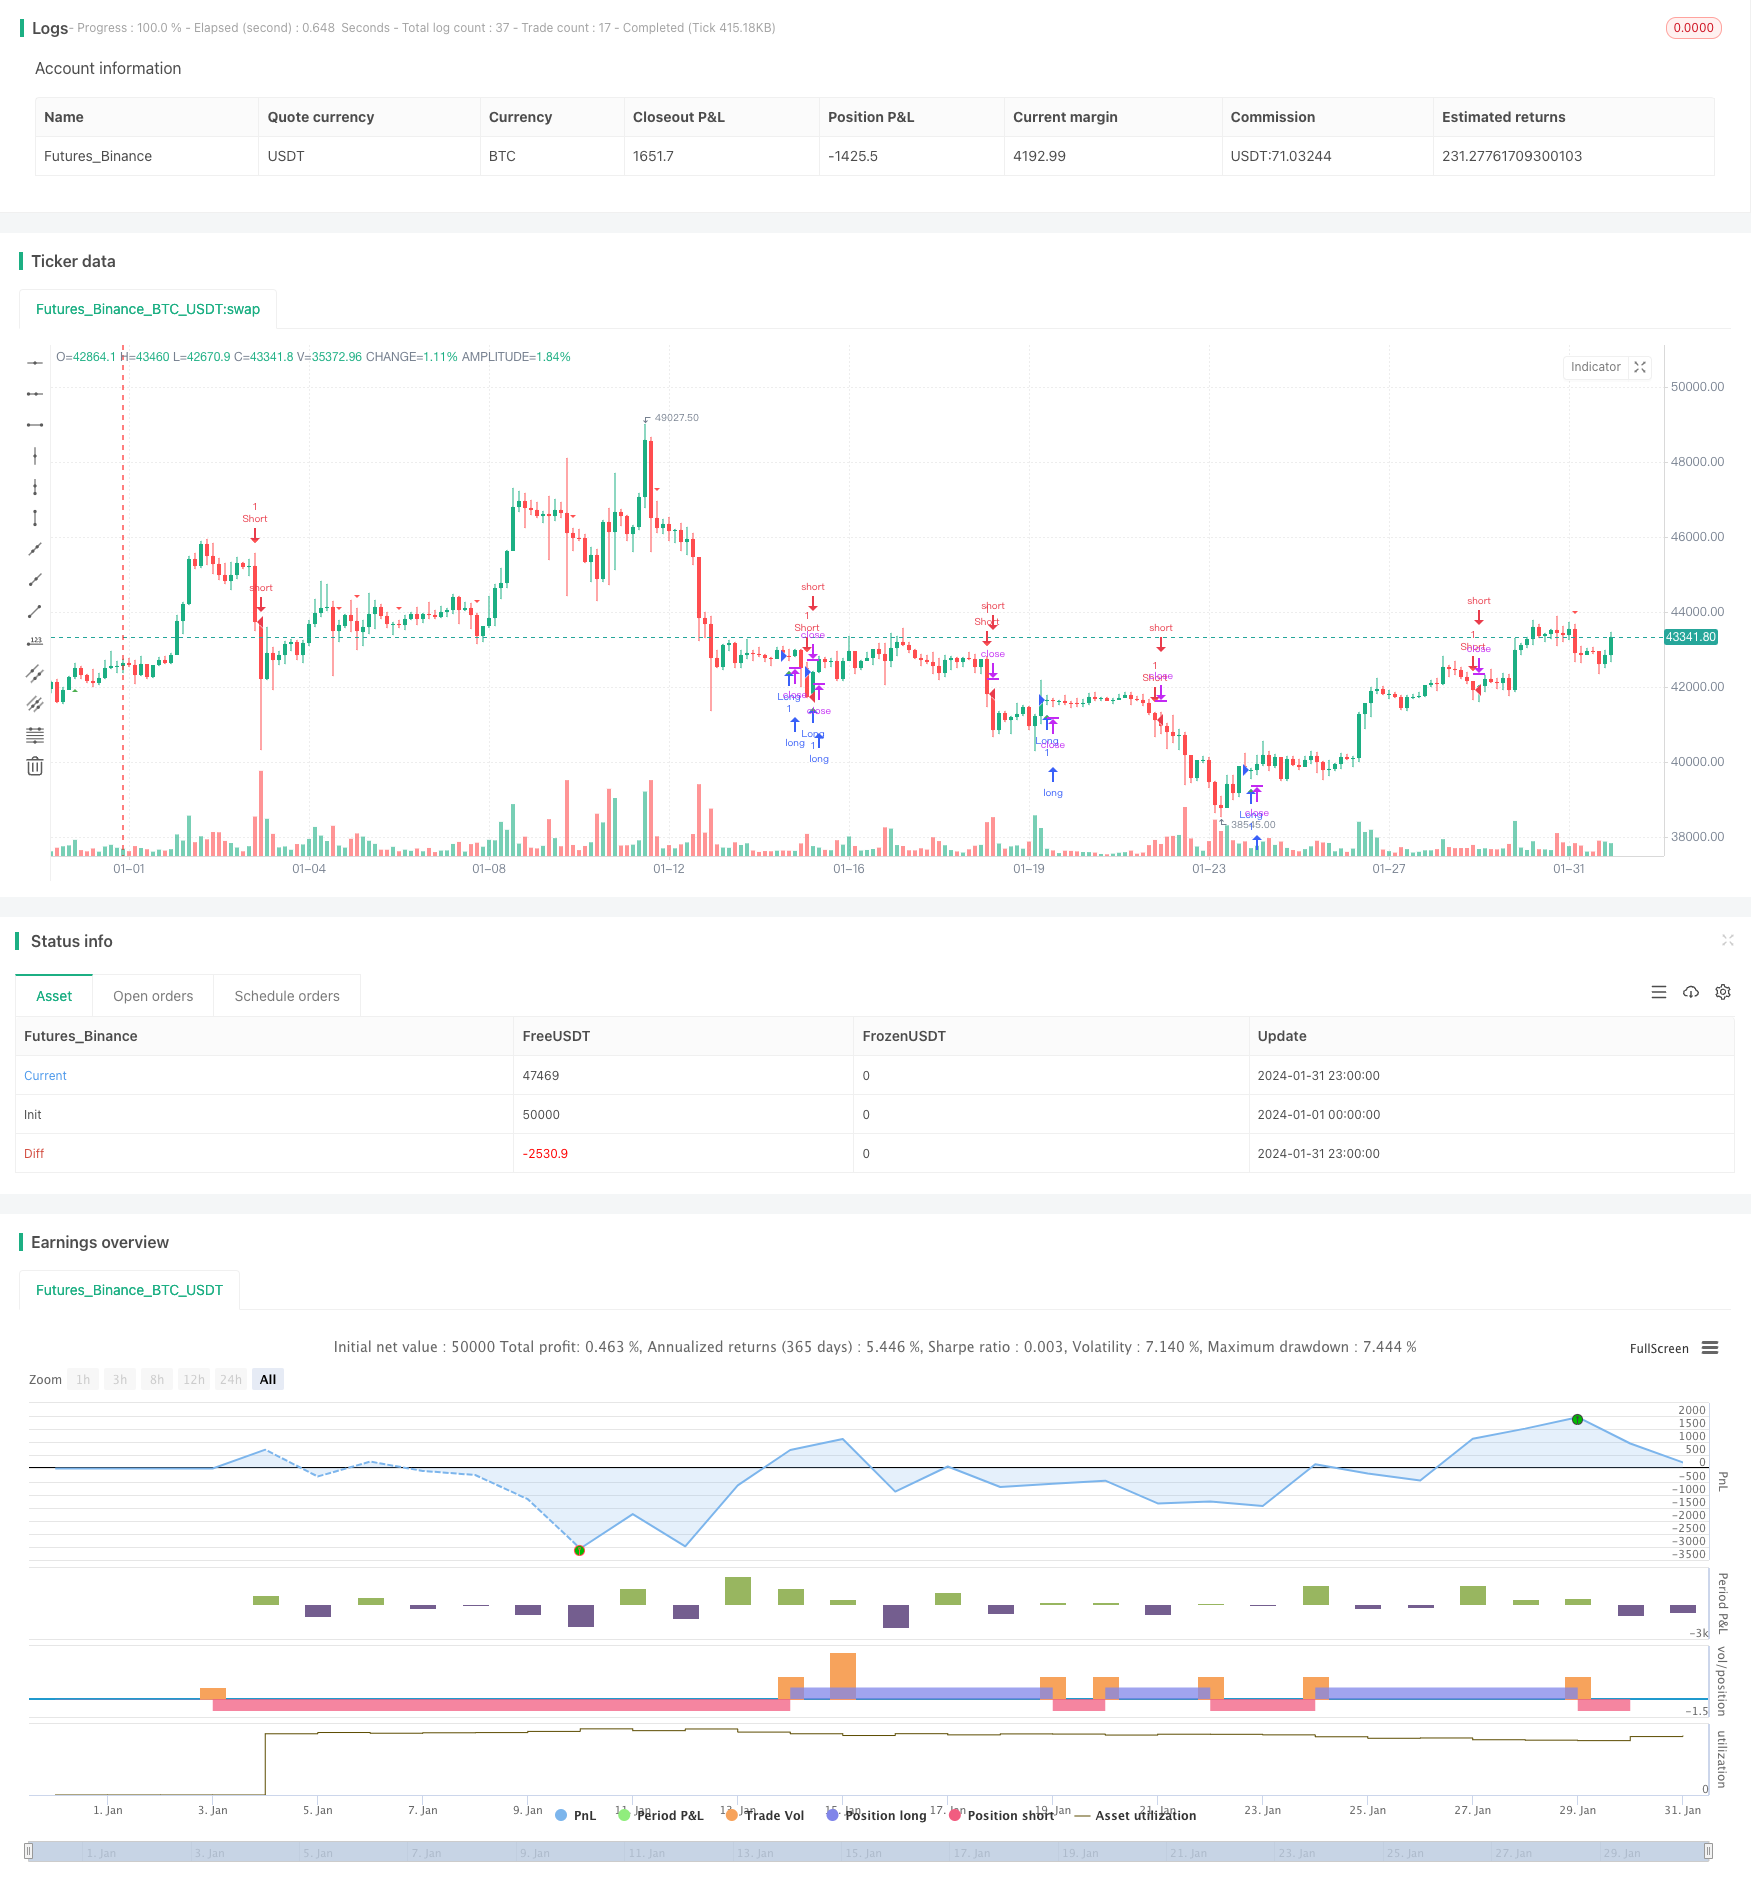
Name
基于均线交叉趋势策略The-Moving-Average-Crossover-Trend-Strategy
Author
ChaoZhang
Strategy Description
均线交叉趋势策略是一种基于移动平均线交叉信号的趋势跟踪策略。该策略利用快速移动平均线和慢速移动平均线的金叉死叉来判断市场趋势,在趋势开始阶段建立仓位,在趋势结束信号出现时平仓。
该策略使用MACD指标的差值线和信号线的金叉死叉来判断趋势的开始和结束。具体来说,它使用12周期的快速EMA和26周期的慢速EMA来构建MACD差值线。当差值线上穿信号线时产生买入信号,表明牛市趋势开始;当差值线下穿信号线时产生卖出信号,表明熊市趋势开始。
在入场时,该策略只在15分钟内K线产生买入信号时开仓做多,利用趋势开始阶段的机会进入市场。在止损平仓上,它在4小时K线MACD的差值线出现下穿信号线的死叉时,表明趋势反转,这时平掉全部头寸止损。
该策略最大的优势在于能够及时抓住趋势开始的机会,同时也能通过死叉信号及时止损,从而获得不错的风险收益比。具体优势如下:
- 使用MACD指标判断趋势较为可靠,胜率较高
- 15分钟和4小时多时间框架结合,既保证了操作频率,也控制了风险
- 及时止损,能够有效控制账户最大回撤
该策略也存在一些风险,主要集中在以下几个方面:
- MACD指标可能产生假信号,从而导致不必要的入场或止损
- 止损点设置可能过于笼统,无法充分考虑市场波动的特殊情况
- Parameters选择不当可能影响策略效果
为了降低这些风险,可以从以下几个方面进行优化:
- 结合其他指标过滤假信号
- 动态调整止损点
- 优化参数设置
该策略主要可以从以下几个方面进行进一步优化:
- 考虑结合其他指标如RSI、布林带等来过滤假信号,提高策略准确率
- 测试更多的快慢周期参数组合,寻找最优参数
- 利用机器学习方法训练最优参数
- 在止损点设置上进行优化,考虑动态跟踪止损或者部分止损
- 扩展至更多时间周期,进行多时间框架组合
均线交叉趋势策略整体来说是一种简单实用的趋势跟踪策略。它通过MACD的快慢均线交叉来判断趋势开始和结束,并配合短线和长线的组合利用趋势获利。该策略优势在于及时进入,有效止损,风险收益比较均衡。下一步可以通过参数优化、信号过滤等方法进一步提升策略的稳定性和收益率。
||
The Moving Average Crossover Trend strategy is a trend-following strategy based on moving average crossover signals. It uses the golden cross and death cross of fast and slow moving averages to determine market trends, establishes positions at the beginning of trends, and closes positions when trend reversal signals appear.
The strategy uses the crossovers of MACD histogram and signal line to identify the start and end of trends. Specifically, it constructs the MACD histogram based on 12-period fast EMA and 26-period slow EMA. When the histogram crosses above the signal line, a buy signal is generated, indicating the start of an uptrend. When the histogram crosses below the signal line, a sell signal is triggered, marking the start of a downtrend.
For entries, the strategy only goes long when a buy signal is generated on the 15-min chart to capitalize on the early stage of trend starts. For exits, it closes all positions when the MACD histogram crosses below the signal line on the 4-hour chart, signaling a trend reversal.
The biggest advantage of this strategy is its ability to timely catch trend starts and exit on reversal signals, achieving good risk-reward ratios. The main advantages are:
- Using MACD for trend identification is reliable with high winning rate
- Combining 15-min and 4-hour timeframes balances frequency and risk control
- Timely stop loss effectively limits maximum drawdown
There are also some risks mainly in the following aspects:
- MACD may generate false signals, causing unnecessary entries or stops
- The stop loss point may be too crude to accommodate market fluctuations
- Improper parameter selection may undermine strategy efficacy
To mitigate the risks, optimizations can be made in:
- Adding filter with other indicators to avoid false signals
- Adaptive adjustments of stop loss points
- Parameter tuning
The main aspects to further optimize the strategy include:
- Incorporate other indicators like RSI, Bollinger Bands to filter signals
- Test more fast and slow period combinations for optimal parameters
- Utilize machine learning to train optimum parameters
- Optimize stop loss rules with trailing or partial stops
- Expand to more timeframes for multi-timeframe combinations
Overall, the Moving Average Crossover Trend Strategy is a simple and practical trend following system. It capitalizes on trends by identifying starts and ends using MACD crossovers, and combining short-term and long-term positions. The advantages lie in its timely entries, effective stops, and balanced risk-reward. Next steps would be improving robustness and profitability via parameterized optimization, signal filtering etc.
[/trans]
Strategy Arguments
| Argument | Default | Description |
|---|---|---|
| v_input_1 | 12 | Fast Length |
| v_input_2 | 26 | Slow Length |
| v_input_3_close | 0 | Source: close |
| v_input_int_1 | 9 | Signal Smoothing |
| v_input_string_1 | 0 | Oscillator MA Type: EMA |
| v_input_string_2 | 0 | Signal Line MA Type: EMA |
Source (PineScript)
/*backtest
start: 2024-01-01 00:00:00
end: 2024-01-31 23:59:59
period: 3h
basePeriod: 15m
exchanges: [{"eid":"Futures_Binance","currency":"BTC_USDT"}]
*/

//@version=5
strategy(title="Moving Average Convergence Divergence", shorttitle="MACD", overlay=true)

// Getting inputs
fast_length = input(title="Fast Length", defval=12)
slow_length = input(title="Slow Length", defval=26)
src = input(title="Source", defval=close)
signal_length = input.int(title="Signal Smoothing", minval=1, maxval=50, defval=9)
sma_source = input.string(title="Oscillator MA Type", defval="EMA", options=["SMA", "EMA"])
sma_signal = input.string(title="Signal Line MA Type", defval="EMA", options=["SMA", "EMA"])

// Calculating MACD
fast_ma = sma_source == "SMA" ? ta.sma(src, fast_length) : ta.ema(src, fast_length)
slow_ma = sma_source == "SMA" ? ta.sma(src, slow_length) : ta.ema(src, slow_length)
macd = fast_ma - slow_ma
signal_line = sma_signal == "SMA" ? ta.sma(macd, signal_length) : ta.ema(macd, signal_length)

// Entry conditions
longCondition = macd < 0 and ta.crossover(macd, signal_line)
shortCondition = ta.crossover(signal_line, macd)

// Plot signals
plotshape(series=longCondition, style=shape.triangleup, location=location.belowbar, color=color.green, size=size.small, title="Buy Signal")
plotshape(series=shortCondition, style=shape.triangledown, location=location.abovebar, color=color.red, size=size.small, title="Sell Signal")

// Strategy
if (longCondition)
    strategy.entry("Long", strategy.long)
if (shortCondition)
    strategy.entry("Short", strategy.short)
Detail
https://www.fmz.com/strategy/443041
Last Modified
2024-02-28 17:55:28
