Name
基于均线交易趋势策略The-Moving-Average-Crossover-Trading-Strategy
Author
ChaoZhang
Strategy Description
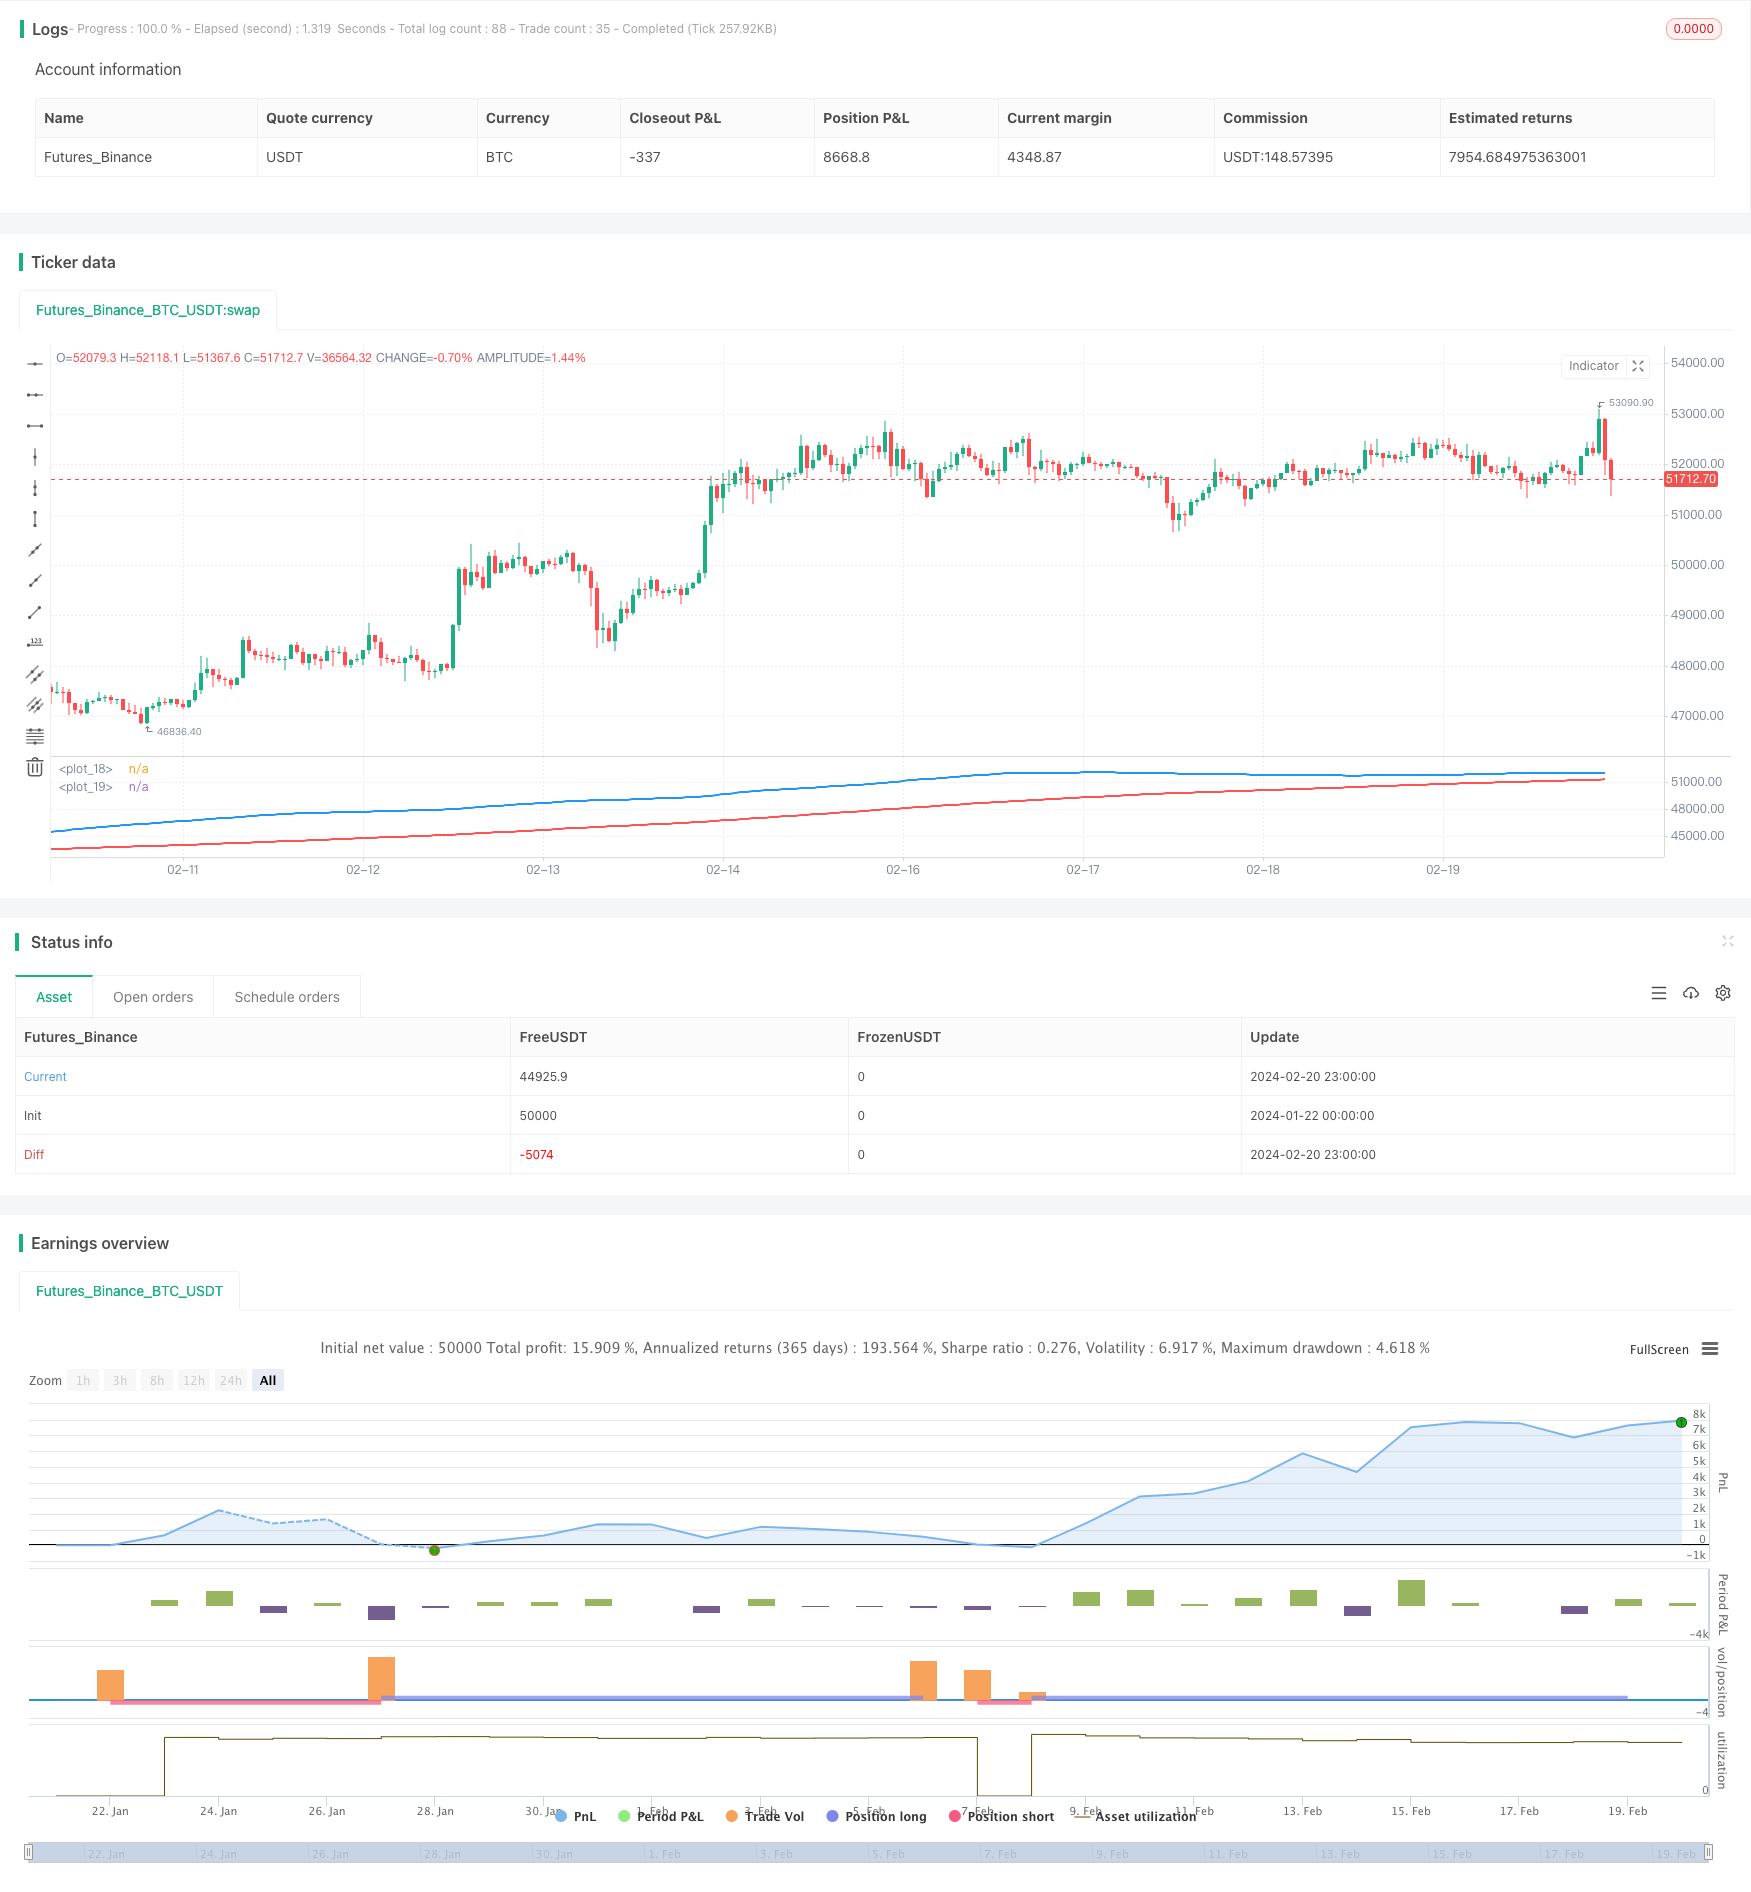
均线交易策略通过计算快速移动平均线(50日线)和慢速移动平均线(200日线)来识别股票价格的上涨和下跌趋势,以捕捉潜在的交易机会。当快速移动平均线上穿慢速移动平均线时,表示股价上涨趋势形成,策略将建立多头仓位;当快速移动平均线下穿慢速移动平均线时,表示股价下跌趋势形成,策略将建立空头仓位。
该策略的核心逻辑基于移动平均线的黄金交叉和死亡交叉来判断价格趋势。具体来说,如果50日移动平均线上穿200日移动平均线,称为“黄金交叉”,表示涨势来临;如果50日移动平均线下穿200日移动平均线,称为“死亡交叉”,表示跌势来临。策略会在黄金交叉时做多,在死亡交叉时做空,通过及时捕捉价格转折点来获利。
代码中,首先计算快速移动平均线(50日线)和慢速移动平均线(200日线),然后判断两条平均线的关系,如果快速移动平均线大于慢速移动平均线(黄金交叉),表示股价处于上涨趋势,这时策略将建立多头仓位;反之,如果快速移动平均线小于慢速移动平均线(死亡交叉),表示股价下跌趋势形成,策略将建立空头仓位。
该策略具有以下优势:
- 规则简单清晰,容易理解和实现
- 移动平均线指标成熟且可靠,应用广泛
- 可有效过滤市场噪音,识别价格趋势
- 具有较高的胜率
- 可自定义移动平均线参数,适应不同市场环境
总的来说,该策略利用移动平均线指标的优势,设置合理的参数,形成了一套稳定的趋势跟踪策略,在牛市中跟踪上涨趋势获利,在熊市中捕捉下跌做空获利,是一种相对简单实用的量化策略。
该策略也存在一些风险,主要集中在以下几个方面:
-
whipsaw效应。当价格在平均线附近震荡时,可能出现多次错误信号。可以通过优化移动平均线参数减少whipsaw。
-
错过转折点。移动平均线存在滞后性,可能错过价格快速反转的关键转折点。可以结合其他指标如MACD等辅助判断。
-
不适合剧烈行情。在价格剧烈波动的行情中,移动平均线交叉信号可能效果不佳。这时可以考虑暂停策略,或结合波动率指标避让这类极端行情。
-
参数可优化空间有限。移动平均线参数优化空间比较小,需要人工经验结合优化。
该策略可从以下几个方面进行进一步优化:
-
结合其他指标判断,形成指标组合,提高策略效果。例如加入MACD,波动率指标等。
-
优化移动平均线参数,降低误差。可以测试不同周期参数的移动平均线。
-
加入止损逻辑,控制风险。例如设定百分比止损或动态跟踪止损。
-
结合机器学习模型动态优化参数。可以建立模型自动优化参数以适应行情变化。
-
分层入场,平均开仓成本。可以分批建仓而不是一次性全仓入场。
本策略整体来说是一个稳定、实用、容易实现的量化策略。它利用成熟的移动平均线指标判断价格趋势,在趋势发生转折时打开仓位捕捉利润。策略优势在于简单、稳定、胜率较高,适合作为量化交易的基础策略。当然也存在一些改进空间,投资者可以根据自身需要对该策略进行适当优化,使策略效果更好。
||
The moving average crossover trading strategy identifies bullish and bearish trends in stock prices by calculating fast moving average (50-day line) and slow moving average (200-day line) to capture potential trading opportunities. When the fast moving average crosses above the slow moving average, it indicates that an upward trend in stock prices is forming and the strategy will establish a long position. When the fast moving average crosses below the slow moving average, it indicates a downward trend in stock prices is forming and the strategy will establish a short position.
The core logic of this strategy is based on the golden cross and death cross of moving averages to determine price trends. Specifically, if the 50-day moving average crosses above the 200-day moving average, it is called a "golden cross" indicating an uptrend coming. If the 50-day moving average drops below the 200-day moving average, it is called a "death cross" indicating a downtrend coming. The strategy will go long on golden crosses and go short on death crosses to capture price turning points for profits.
In the code, the fast moving average (50-day line) and slow moving average (200-day line) are calculated first, then the relationship between the two average lines is judged. If the fast moving average is greater than the slow moving average (golden cross), it means that stock prices are in an upward trend. At this point, the strategy will establish a long position. On the contrary, if the fast moving average is less than the slow moving average (death cross), it means a downward trend is forming in stock prices. The strategy will establish a short position.
The advantages of this strategy include:
- Simple and clear rules that are easy to understand and implement
- Mature and reliable moving average indicators with wide application
- Can effectively filter market noise and identify price trends
- Relatively high win rate
- Customizable moving average parameters to adapt to different market environments
In summary, by leveraging the advantages of moving average indicators and setting reasonable parameters, this strategy forms a stable trend tracking system, profiting from upward trends in bull markets and catching shorting opportunities in downward trends in bear markets. It is a relatively simple and practical quantitative strategy.
The strategy also has some risks, mainly in the following aspects:
-
Whipsaw effect. There may be multiple false signals when prices oscillate around the moving averages. This can be reduced by optimizing the moving average parameters.
-
Missing turning points. Moving averages have lagging effects and may miss key reversal points when prices reverse rapidly. Other indicators like MACD can be combined to assist judgment.
-
Not suitable for volatile markets. The crossovers of moving averages may not work well in extremely volatile markets. Consider temporarily pausing the strategy or incorporate volatility metrics to avoid such extreme market conditions.
-
Limited parameter optimization space. There is relatively small room for optimizing moving average parameters which relies more on human experience combined with optimization.
The strategy can be further optimized from the following aspects:
-
Combine with other indicators to form indicator combos to improve strategy performance, e.g. adding MACD, volatility metrics, etc.
-
Optimize moving average parameters to reduce errors. Different period parameters for moving averages can be tested.
-
Add stop loss logic to control risks, e.g. set percentage stop loss or dynamic trailing stop loss.
-
Leverage machine learning models to dynamically optimize parameters adapting to market changes.
-
Scale in positions to average entry costs instead of one-off full position entries.
Overall, this strategy is a stable, practical and easy-to-implement quantitative strategy. It uses mature moving average indicators to determine price trends and open positions when trend reversals occur to capture profits. The advantages lie in its simplicity, stability and relatively high win rate, making it suitable as a fundamental quantitative trading strategy. Of course there are still rooms for improvement. Investors can optimize this strategy accordingly based on their own needs for better performance.
[/trans]
Source (PineScript)
/*backtest
start: 2024-01-22 00:00:00
end: 2024-02-21 00:00:00
period: 1h
basePeriod: 15m
exchanges: [{"eid":"Futures_Binance","currency":"BTC_USDT"}]
*/

// This Pine Script™ code is subject to the terms of the Mozilla Public License 2.0 at https://mozilla.org/MPL/2.0/
// © pablobm0933

//@version=5
strategy("Estrategia de Trading")

// Definir medias móviles para identificar tendencias
fast_ma = ta.sma(close, 50) // Media móvil rápida
slow_ma = ta.sma(close, 200) // Media móvil lenta

// Condiciones para identificar tendencia alcista
tendencia_alcista = fast_ma > slow_ma

// Condiciones para identificar tendencia bajista
tendencia_bajista = fast_ma < slow_ma

// Dibujar las medias móviles en el gráfico
plot(fast_ma, color=color.blue, linewidth=2)
plot(slow_ma, color=color.red, linewidth=2)

// Detectar señales de entrada y salida
if (tendencia_alcista)
    strategy.entry("Compra", strategy.long)
    strategy.exit("Venta", "Compra", loss=close*0.02) // Salida de la posición con una pérdida del 2%

if (tendencia_bajista)
    strategy.entry("Venta", strategy.short)
    strategy.exit("Compra", "Venta", loss=close*0.02) // Salida de la posición con una pérdida del 2%
Detail
https://www.fmz.com/strategy/442542
Last Modified
2024-02-22 16:36:26
