Name
基于均线叠加RSI策略CRSI-Moving-Average-Strategy
Author
ChaoZhang
Strategy Description
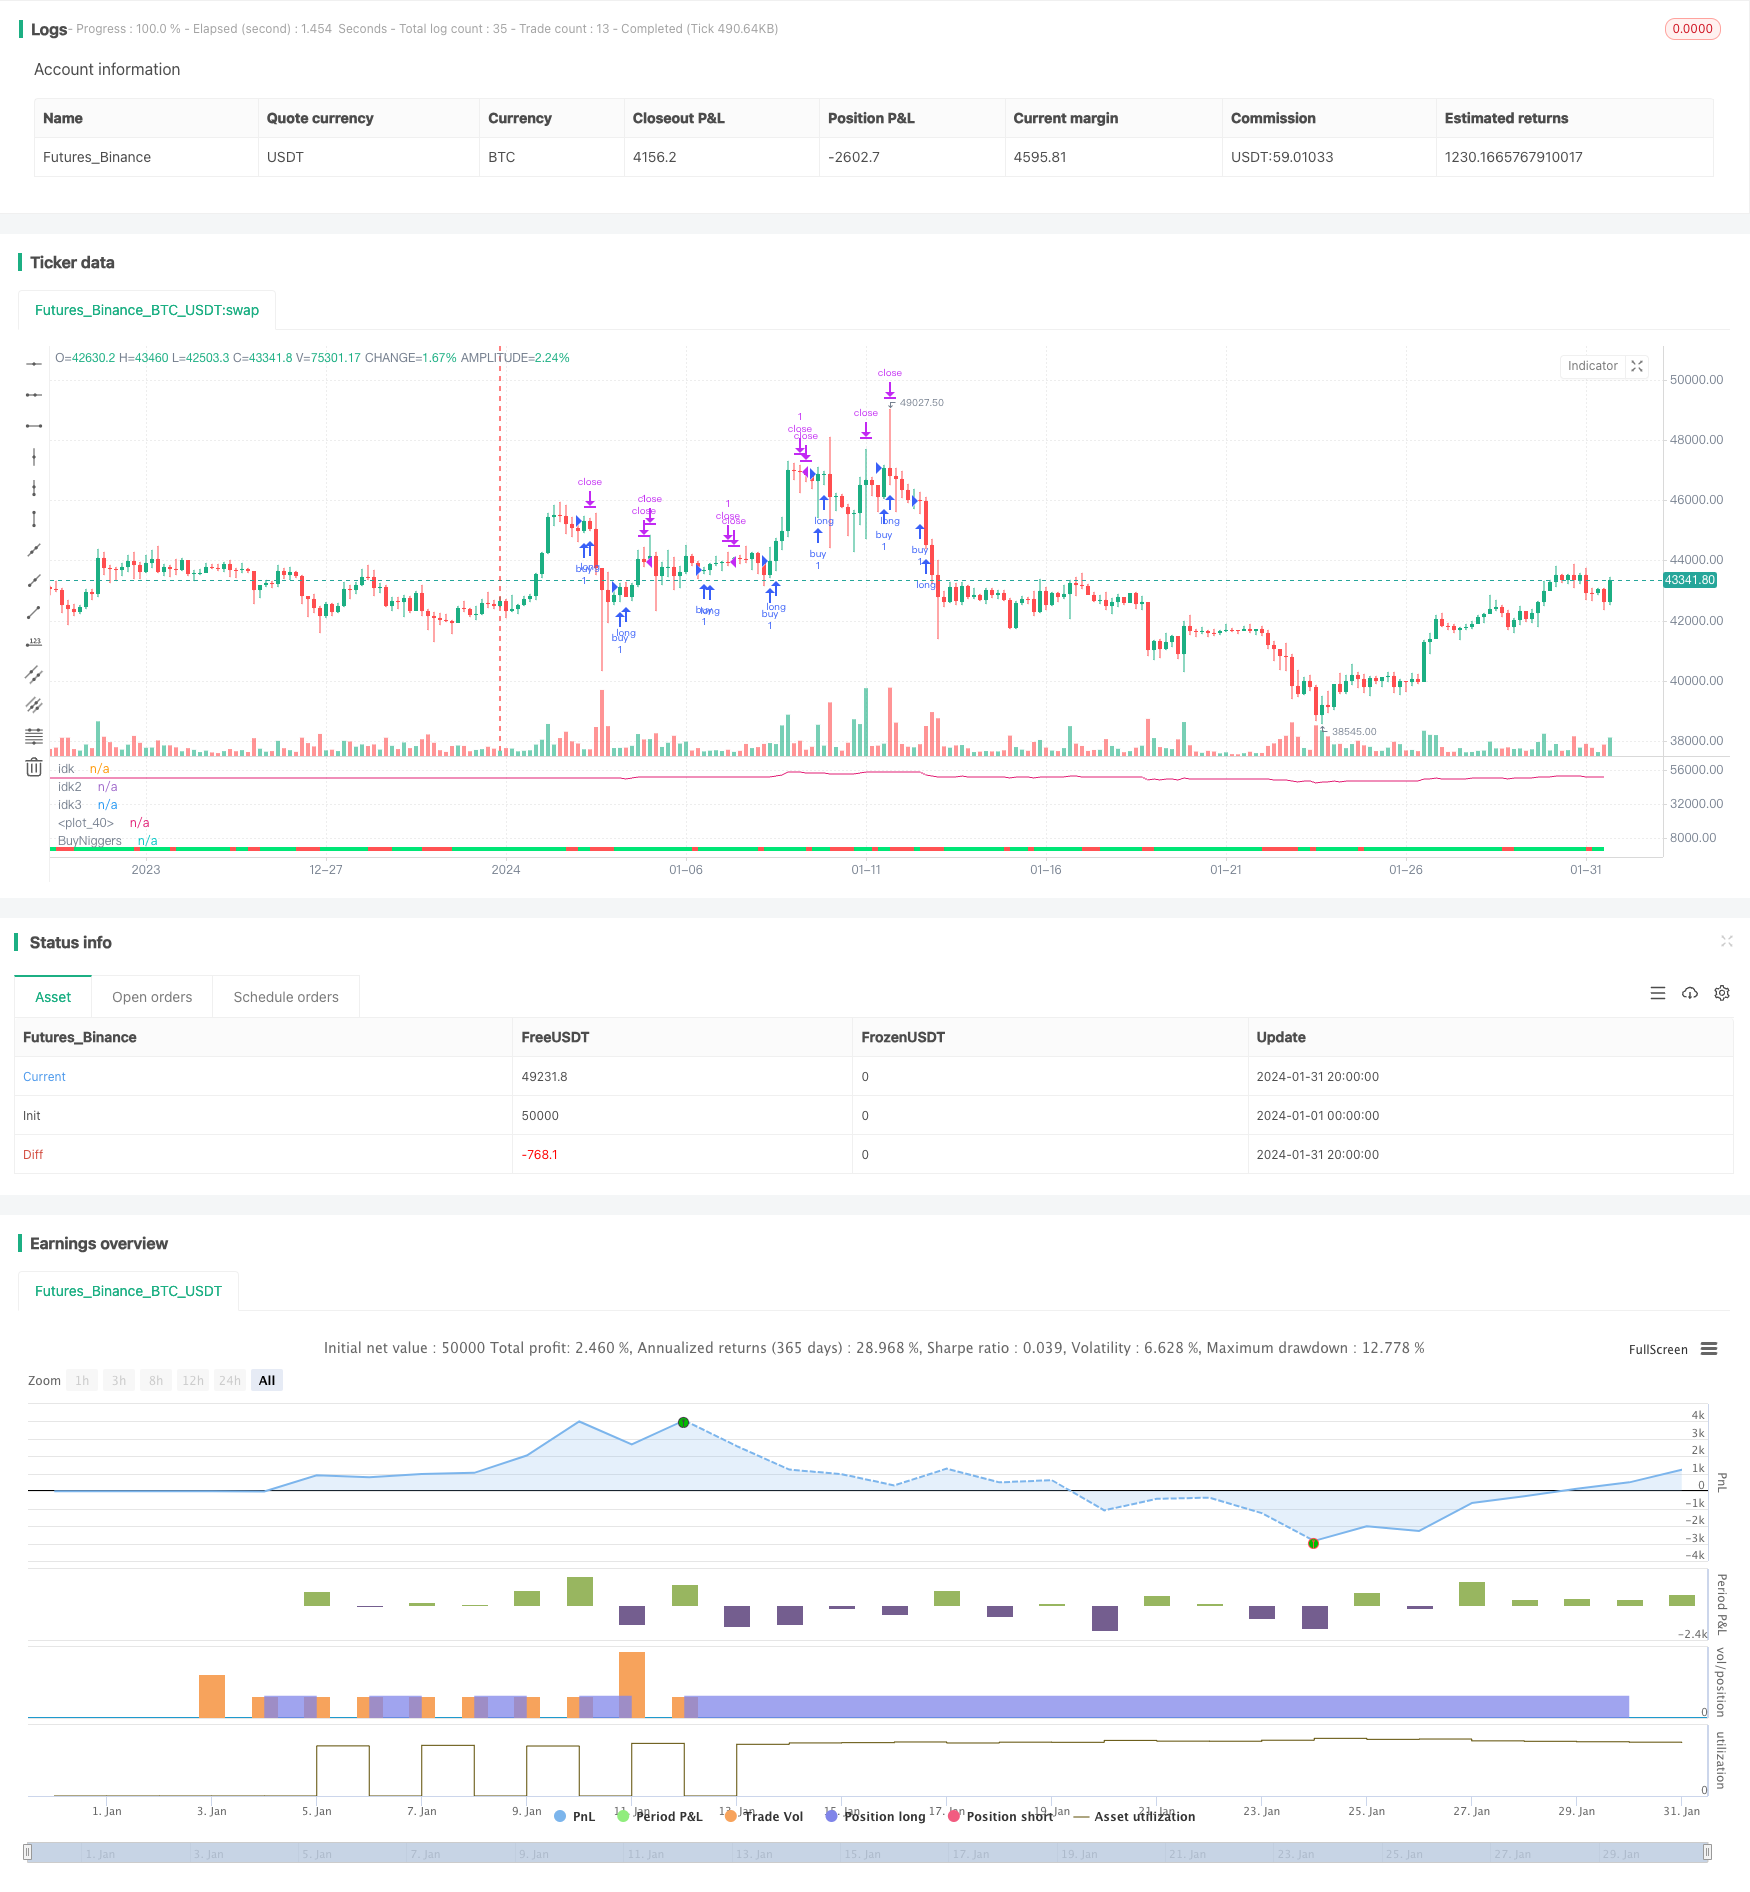
该策略通过计算RSI、阳线阴线指标和价格变化百分比排名的均值,构建自定义的综合指标CRSI,并计算其简单移动平均线MA,来判断价格趋势和产生交易信号。
该策略首先计算价格的3日RSI,以判断价格是否过热或过冷;同时计算价格的阳线阴线指标,判断价格运动态势;此外还计算价格的百分比排名ROC,判断价格相对变化速度。然后取这三个指标的平均值,构建自定义综合指标CRSI。CRSI能反映价格的综合态势。最后计算CRSI的2日简单移动平均线MA。当MA上穿40这一水平线时,做多;当MA下穿70这一水平线时,平仓。
该策略通过组合多个指标,构建自定义的CRSI指标,使得交易信号更可靠。RSI能判断价格是否过热过冷,阳线阴线指标能判断价格动量,ROC能判断价格变化速度。把它们结合在一起,形成CRSI指标,使得交易信号更全面和可靠。此外,MA的使用也能进一步过滤假信号。
该策略虽然使用多个指标进行组合,但仍有可能在特定市场环境下产生错误信号。例如在震荡行情中,RSI、ROC等指标可能产生频繁的买卖信号,而实际上价格并没有明显趋势;或者在突发事件发生后,多个指标可能会有滞后,延迟生成交易信号的风险。这些情况都可能导致策略交易亏损。可以通过优化参数或增加其他过滤条件来降低这些风险。
可以考虑以下几个方面来优化该策略:1)优化RSI、阳线阴线指标、ROC的参数,使得CRSI指标更稳定可靠;2)增加其他辅助指标进行组合,如KDJ、MACD等,使信号更全面;3)优化MA的参数,降低延迟风险;4)增加止损条件,以控制单笔亏损;5)结合更长周期指标判断趋势态势,避免在震荡市场中频繁交易。
该策略通过计算RSI、阳线阴线和ROC的均线,构建CRSI自定义指标,再计算CRSI的MA,在MA与指定价格水平发生 Golden Cross和Death Cross时进行买卖操作。这种多指标组合可以使交易信号更稳定可靠。但该策略仍需进一步优化参数,增加辅助指标和过滤条件,以减少错误信号和市场环境的影响,提高稳定盈利能力。
||
This strategy constructs a custom composite indicator CRSI by taking the average of RSI, bull/bear power and price rate of change percentage rank, and trades based on the moving average of CRSI crossing fixed levels.
The strategy first calculates the 3-day RSI of price to gauge whether price is overbought or oversold. Meanwhile, it calculates the bull/bear power of price to judge the momentum. It also calculates the percentage rank of price rate of change (ROC) to check the relative speed of price change. Then it takes the mean of these three indicators to construct a custom composite indicator CRSI, which reflects the overall condition of price. Finally it calculates the 2-day simple moving average (MA) of CRSI. When MA crosses above the level of 40, it goes long. When MA crosses below the level of 70, it exits long positions.
This strategy combines multiple indicators to construct the custom CRSI indicator, making trading signals more reliable. RSI can tell whether price is overheated or oversold. Bull/bear power can judge the momentum. ROC checks how fast price is changing. Combining them together into CRSI makes trading signals more comprehensive and reliable. Additionally, the use of MA also helps filter out false signals.
Although this strategy uses multiple indicators for a combo, it still risks generating false signals in certain market conditions. For instance, in range-bound markets, RSI, ROC and other indicators may produce frequent buy and sell signals while actually price has no clear trend. Or some indicators may lag and delay generating trading signals after a sudden event happens. These situations can cause losses. The risks could be reduced by optimizing parameters or adding other filtering conditions.
Here are some aspects that could optimize this strategy: 1) Optimize the parameters of RSI, bull/bear power and ROC to make CRSI more steady and reliable; 2) Add other auxiliary indicators like KDJ, MACD into the combo for more comprehensive signals; 3) Optimize the MA parameters to lower the delay risk; 4) Add stop loss conditions to control single loss; 5) Incorporate longer-term indicators to judge trend status, avoiding overtrading in range-bound markets.
This strategy constructs a custom indicator CRSI based on the mean of RSI, bull/bear power and ROC, and trades on the MA of CRSI crossing fixed levels. Such a multi-indicator combo can make trading signals more stable and reliable. But this strategy still calls for further optimization on parameters, auxiliary indicators and filtering conditions to reduce false signals and the impacts of market regimes, so as to improve steady profitability.
[/trans]
Source (PineScript)
/*backtest
start: 2024-01-01 00:00:00
end: 2024-01-31 23:59:59
period: 4h
basePeriod: 15m
exchanges: [{"eid":"Futures_Binance","currency":"BTC_USDT"}]
*/

//@version=3
src = close, lenrsi = 3, lenupdown = 2, lenroc = 100, malengt = 2, low = 40, high = 70, a = 1, vlow = 20
updown(s) =>
    isEqual = s == s[1]
    isGrowing = s > s[1]
    ud = 0.0
    ud := isEqual ? 0 : isGrowing ? (nz(ud[1]) <= 0 ? 1 : nz(ud[1])+1) : (nz(ud[1]) >= 0 ? -1 : nz(ud[1])-1)
    ud
rsi = rsi(src, lenrsi)
updownrsi = rsi(updown(src), lenupdown)
percentrank = percentrank(roc(src, 1), lenroc)
crsi = avg(rsi, updownrsi, percentrank)
MA = sma(crsi, malengt)

band1 = 70
band0 = 40
band2 = 20

ColorMA = MA>=band0 ? lime : red

p1 = plot(MA, title="BuyNiggers", style=line, linewidth=4, color=ColorMA)

p2 = plot(low, title="idk", style=line, linewidth=2, color=blue)
p3 = plot(high, title="idk2", style=line, linewidth=2, color=orange)
p4 = plot(vlow, title="idk3", style=line, linewidth=1, color=red)

//@version=2
strategy("CMARSI")


if crossover(MA, band0)
    strategy.entry("buy", strategy.long, 1, when=strategy.position_size <= 0)

if crossunder(MA, band1)
    strategy.exit("close", "buy",  1, profit=1, stop=1)


plot(strategy.equity)
Detail
https://www.fmz.com/strategy/440880
Last Modified
2024-02-02 18:12:17
