Name
基于复合突破策略The-Compound-Breakout-Strategy
Author
ChaoZhang
Strategy Description
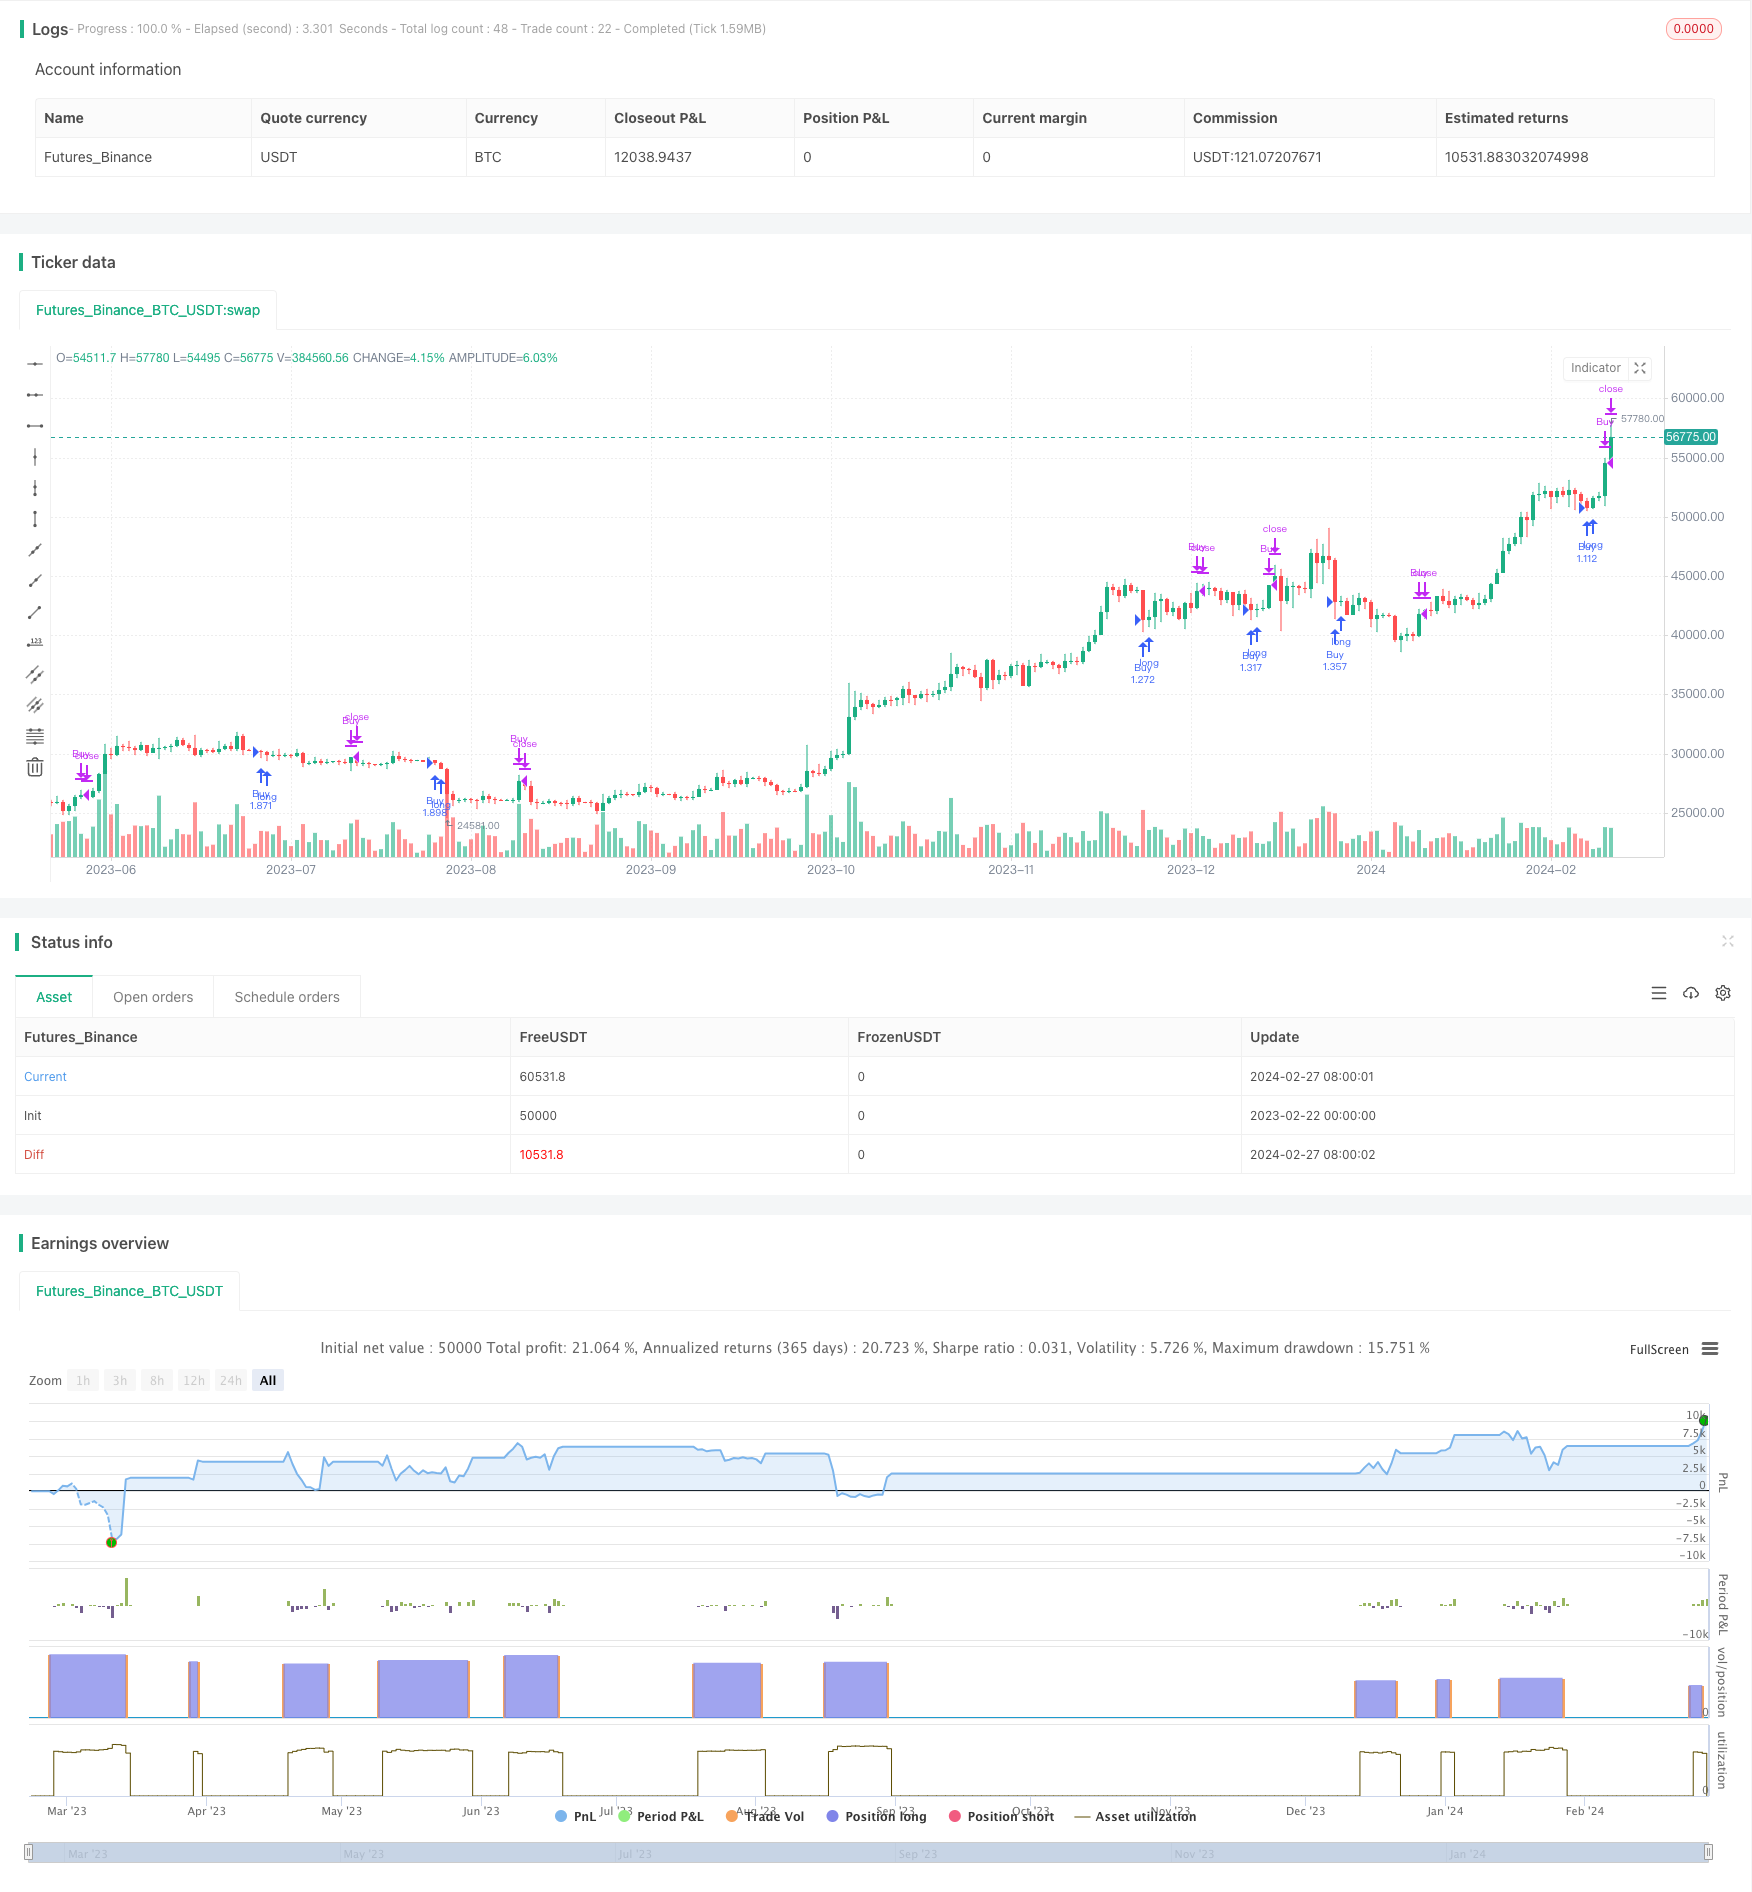
该策略通过计算最近N根K线的最高价和最低价,结合移动平均线指标,设定双重突破条件,实现低买高卖的交易策略。
该策略主要基于以下几点原理:
- 计算最近7根K线的最低价minLow,用于确定突破买入条件
- 计算最近7根K线的最高价maxHigh,用于确定突破卖出条件
- 计算长度为200的简单移动平均线mma,结合mma指标判断趋势方向
- 买入条件:收盘价close突破minLow,且高于mma
- 卖出条件:收盘价close突破maxHigh或高于maxHigh
通过计算最近N根K线的极值,判断市场是否处于超卖或超买状态。结合移动平均线确定趋势方向,设定双重条件,实现低买高卖的突破交易策略。
该策略具有以下优势:
- 双重条件设定使策略交易信号更加可靠
- 利用K线极值判断超卖超买状态,可以抓住反转机会
- 结合移动平均线判断趋势方向,避免逆势操作
- 实现了低买高卖的理念,符合大部分交易者的交易心理
- 策略逻辑简单清晰,容易理解和实现
通过双重条件确认,使策略信号质量较高,同时参数优化空间大,适合不同市场环境。
该策略也存在一些风险:
- 双重条件限制信号频率,可能错过部分交易机会
- K线极值计算周期设置不当,可能无法准确判断超卖超买状态
- 移动平均线参数设置不当,可能判断错误趋势方向
- 需同时优化多个参数,参数优化难度较大
这些风险可以通过调整计算周期、优化参数组合等方法降低。此外,也可以考虑结合其他指标进行优化。
该策略主要可以从以下几个方向进行优化:
- 优化K线极值计算周期,找到最合适判断超买超卖的周期参数
- 测试不同长度移动平均线的效果
- 增加其他指标结合,如BOLL通道、KD指标等
- 增加止损策略,控制单笔止损
- 优化入场离场条件,提高信号质量
通过参数优化、指标优化、风控优化等手段,可以大幅提升策略profit因子。
该策略总体来说是一个非常实用的突破策略。计算K线极值判断超买超卖状态,移动平均线判断趋势方向,双重条件设定过滤误信号,实现高质量的低买高卖策略。通过优化计算周期、增加其他指标等手段可以进一步提升策略效果。该策略既适合新手学习,也适合专业交易员优化运用。
||
This strategy calculates the highest and lowest prices of recent N bars to set double breakout conditions combined with moving average line to implement low-buying and high-selling trading strategy.
The strategy is mainly based on the following principles:
- Calculate the minimum low price minLow of recent 7 bars to determine the breakout buy condition
- Calculate the maximum high price maxHigh of recent 7 bars to determine the breakout sell condition
- Calculate the 200-period simple moving average line mma to determine the trend direction combined with mma
- Buy condition: close price breaks through minLow and is higher than mma
- Sell condition: close price breaks through maxHigh or is higher than maxHigh
By calculating the extremes of recent N bars, it judges whether the market is extremely oversold or overbought. Combined with the moving average line to determine the trend direction, it sets double conditions to achieve the breakout trading strategy of low-buying and high-selling.
The strategy has the following advantages:
- The double condition setting makes the trading signals of the strategy more reliable
- Using the extremes of K lines to judge the oversold and overbought status can seize the chance of reversal
- Combining the moving average line to determine the trend direction avoids reverse operations
- It implements the idea of low-buying and high-selling, which is consistent with the trading psychology of most traders
- The logic of the strategy is simple and clear, easy to understand and implement
Through double confirmation, the signal quality of the strategy is relatively high, and the space for parameter optimization is large, which is suitable for different market environments.
The strategy also has some risks:
- The double condition limit the frequency of signals, possibly missing some trading opportunities
- Improper settings of computing cycle for K line extremes may fail to accurately determine the oversold and overbought status
- Improper parameter settings of the moving average line may incorrectly determine the trend direction
- It needs to optimize multiple parameters simultaneously, making parameter optimization more difficult
These risks can be reduced by adjusting computing cycles, optimizing parameter combinations and other methods. In addition, considering combining with other indicators for optimization.
The strategy can be mainly optimized in the following directions:
- Optimize the computing cycle of K line extremes to find the most appropriate cycle parameters to determine overbought and oversold
- Test the effects of moving average lines of different lengths
- Increase other combined indicators such as BOLL channels, KD indicators, etc.
- Increase stop loss strategies to control single stop loss
- Optimize entry and exit conditions to improve signal quality
Through parameter optimization, indicator optimization, risk control optimization and other means, the profit factor of the strategy can be greatly improved.
In general, this is a very practical breakout strategy. Calculating extremes of K lines to determine oversold and overbought status, using moving average line to determine trend direction, setting double filtering conditions to filter false signals, it implements high-quality low-buying and high-selling strategies. By optimizing computing cycles, adding other indicators and other means, the strategy effect can be further enhanced. The strategy is suitable for both beginners to learn and professional traders to optimize and use.
[/trans]
Strategy Arguments
| Argument | Default | Description |
|---|---|---|
| v_input_1 | 7 | Quantity of day low |
| v_input_2 | 7 | Quantity of day high |
| v_input_3 | 200 | Length of SMA |
| v_input_4 | 2009 | Backtest Start Year |
| v_input_5 | true | Backtest Start Month |
| v_input_6 | 2 | Backtest Start Day |
| v_input_7 | 2020 | Backtest Stop Year |
| v_input_8 | 12 | Backtest Stop Month |
| v_input_9 | 30 | Backtest Stop Day |
Source (PineScript)
/*backtest
start: 2023-02-22 00:00:00
end: 2024-02-28 00:00:00
period: 1d
basePeriod: 1h
exchanges: [{"eid":"Futures_Binance","currency":"BTC_USDT"}]
*/

//@version=4
strategy("Larry Connors por RON", overlay=true, default_qty_type=strategy.percent_of_equity, default_qty_value=100)

value1 = input(7, title="Quantity of day low")
value2 = input(7, title="Quantity of day high")
entry = lowest(close[1], value1)
exit = highest(close[1], value2)

lengthMMA = input(200, title="Length of SMA", minval=1)
mma = sma(close, lengthMMA)

// Calcular el mínimo de los precios bajos de las últimas 'value1' velas
minLow = lowest(low, value1)

// Calcular el máximo de los precios altos de las últimas 'value2' velas
maxHigh = highest(high, value2)

// Test Period
testStartYear = input(2009, "Backtest Start Year")
testStartMonth = input(1, "Backtest Start Month")
testStartDay = input(2, "Backtest Start Day")
testPeriodStart = timestamp(testStartYear, testStartMonth, testStartDay, 0, 0)

testStopYear = input(2020, "Backtest Stop Year")
testStopMonth = input(12, "Backtest Stop Month")
testStopDay = input(30, "Backtest Stop Day")
testPeriodStop = timestamp(testStopYear, testStopMonth, testStopDay, 0, 0)

testPeriod() => true

if testPeriod()
    // Condiciones de entrada
    conditionMet = (close > mma) and (close < entry) and (low == minLow)
    strategy.entry("Buy", strategy.long, when=conditionMet)

    if conditionMet
        label.new(bar_index, entry, text="↑", style=label.style_arrowup, color=color.green, size=size.small, yloc=yloc.belowbar)

    // Condiciones de salida
    conditionExit = close > exit or close > maxHigh
    strategy.close("Buy", when=conditionExit)
Detail
https://www.fmz.com/strategy/443125
Last Modified
2024-02-29 14:07:54
