Name
基于多个时间三重超趋势策略Super-Trend-Triple-Strategy
Author
ChaoZhang
Strategy Description
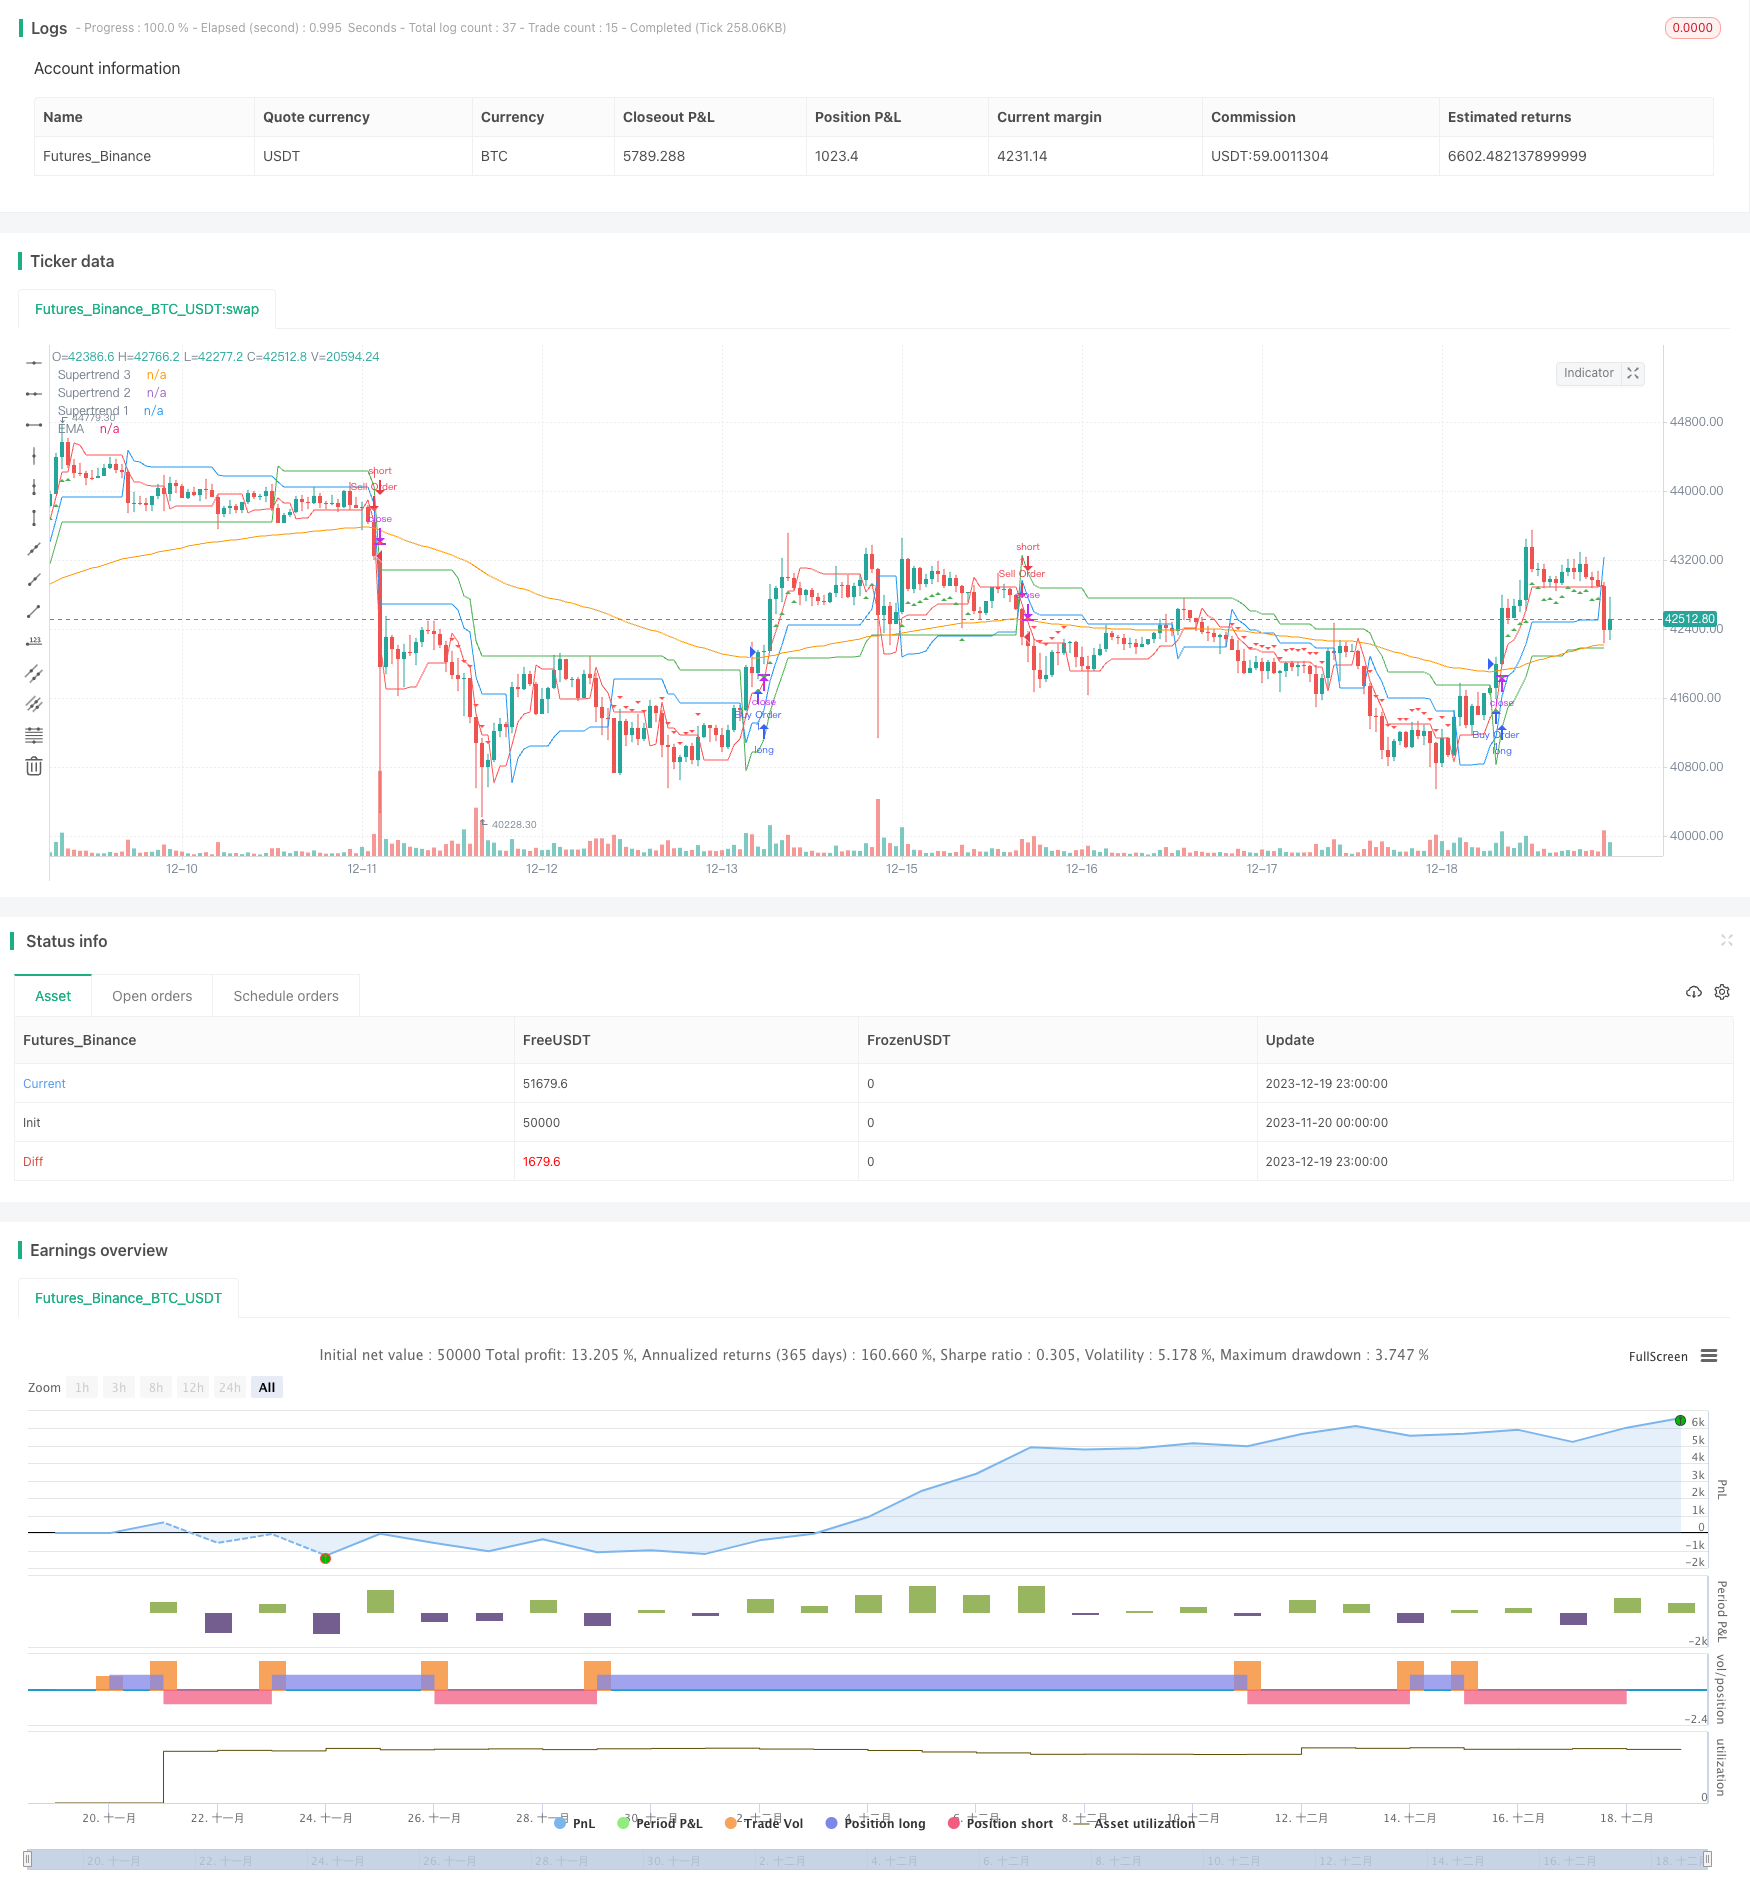
三重超趋势策略是一个基于多个时间周期的超趋势指标以及移动平均线的趋势跟随策略。它可以有效地识别趋势方向,在趋势形成时及时入场,在趋势反转时及时退出,从而获利。与单一超趋势策略相比,三重超趋势策略可以更准确地描绘市场趋势,避免假突破带来的损失。
该策略同时采用三个不同参数设置的超趋势指标:超趋势1、超趋势2和超趋势3。它们的周期长度从长到短,分别为输入参数supertrend1_period、supertrend2_period和supertrend3_period。三个超趋势指标配合移动平均线EMA发挥作用,具体逻辑是:
多头入场信号:当收盘价高于三个超趋势线和移动平均线时,做多;
空头入场信号:当收盘价低于三个超趋势线和移动平均线时,做空。
这样,不同周期的超趋势指标可以起到互相验证的作用,避免曲解市场趋势。加入移动平均线EMA后,可以过滤掉部分假突破。
-
使用三重超趋势系统,可以更准确判断趋势,避免假突破的误导。
-
不同参数设置的超趋势指标相互验证,使策略更可靠。
-
增加移动平均线过滤器,可以进一步避免小周期的噪声。
-
策略participates合理,既可以跟踪趋势获利,也可以及时退出以控制风险。
-
超趋势指标存在滞后性,可能导致入场时机稍晚。可以适当调整参数,或加入其他先行指标。
-
移动平均线作为过滤器也存在滞后问题。可以测试其他平滑指标如EMA、动量指标等替代。
-
趋势反转时,可能导致损失加大。可以设置止损点,或加入附加指标判断潜在反转。
-
参数设置不当也会影响策略效果。需要充分的回测优化找到最佳参数组合。
-
测试加入其他趋势判断指标,如MACD、DMI等,验证趋势判断的准确性。
-
尝试自动优化参数,使超趋势的周期和乘数能自适应不同市场环境。
-
设置动态止损和止盈条件,让策略能根据实时波动自动调整盈亏比。
-
优化移动平均线参数或引入其他指标过滤假突破信号。
-
测试在更长时间周期(日线、周线等)运行策略,判断其在大趋势下的捕捉效果。
三重超趋势策略同时使用三组参数不同的超趋势指标,相互验证判断趋势方向,结合移动平均线进行过滤,可以有效识别趋势,及时入场,避免假突破,是一种可靠的趋势跟随策略。该策略可以通过参数优化、止损机制改进、加入其他指标等多种方式进行升级,在捕捉中长线趋势的同时控制风险,具有广阔的优化空间。
||
The Super Trend Triple strategy is a trend following strategy based on multiple time frame Super Trend indicators and moving average. It can effectively identify trend direction, enter timely when a trend is forming, and exit timely when a trend is reversing, thus profiting. Compared with single Super Trend strategies, the Super Trend Triple strategy can depict market trends more accurately and avoid losses caused by false breakouts.
The strategy adopts three Super Trend indicators with different parameter settings at the same time: Super Trend 1, Super Trend 2 and Super Trend 3. Their periods range from long to short, which are input parameters supertrend1_period, supertrend2_period and supertrend3_period respectively. The three Super Trend indicators work with the moving average line EMA. The specific logic is:
Long entry signal: when close price is higher than all three Super Trend lines and the moving average line, go long.
Short entry signal: when close price is lower than all three Super Trend lines and the moving average line, go short.
Thus, Super Trend indicators with different periods can verify each other to avoid misinterpreting market trends. The addition of the moving average line EMA can filter out some false breakouts.
-
Using a triple Super Trend system can judge trends more accurately and avoid being misled by false breakouts.
-
Super Trend indicators with different parameter settings verify each other, making the strategy more reliable.
-
Adding a moving average line filter can further avoid noise from small cycles.
-
The strategy participates reasonably, can both follow trends to profit and exit in time to control risks.
-
Super Trend indicators have lagging effect, which may lead to slightly late entry timing. Parameters can be adjusted accordingly or other leading indicators can be added.
-
Moving average lines as filters also have lagging issues. Other smoothing indicators such as EMA and momentum indicators can be tested to replace.
-
Potential larger losses during trend reversal. Stop loss can be set or additional indicators can be added to judge potential reversal.
-
Improper parameter settings may also affect strategy performance. Sufficient backtesting and optimization is needed to find the optimal parameter combination.
-
Test adding other trend judging indicators such as MACD, DMI etc to verify the accuracy of trend judgment.
-
Try auto optimizing parameters to make the periods and multipliers of Super Trends self-adaptive to different market environments.
-
Set dynamic stop loss and take profit criteria so that the strategy can automatically adjust risk-reward ratio according to real-time fluctuations.
-
Optimize parameters of moving average line or introduce other indicators to filter false breakout signals.
-
Test running strategies over longer time frames (daily, weekly etc) to judge its effectiveness in capturing major trends.
The Super Trend Triple strategy adopts three Super Trend indicators with different parameters simultaneously to verify the trend direction, and combines moving average lines for filtration. It can effectively identify trends, enter timely, avoid false breakouts and is hence a reliable trend following strategy. The strategy can be upgraded in various ways including parameter optimization, stop loss mechanism improvements and integrating other indicators. By controlling risks while capturing mid-to-long term trends with optimization space, it has broad room for optimization.
[/trans]
Strategy Arguments
| Argument | Default | Description |
|---|---|---|
| v_input_int_1 | 3 | Supertrend 1 Period |
| v_input_int_2 | 12 | Supertrend 1 Multiplier |
| v_input_int_3 | 2 | Supertrend 2 Period |
| v_input_int_4 | 11 | Supertrend 2 Multiplier |
| v_input_int_5 | true | Supertrend 3 Period |
| v_input_int_6 | 10 | Supertrend 3 Multiplier |
| v_input_int_7 | 100 | EMA Length |
Source (PineScript)
/*backtest
start: 2023-11-20 00:00:00
end: 2023-12-20 00:00:00
period: 1h
basePeriod: 15m
exchanges: [{"eid":"Futures_Binance","currency":"BTC_USDT"}]
*/

//@version=5
strategy("Triple Supertrend Strategy", shorttitle = "TSS", overlay = true, pyramiding = 1) // Added pyramiding = 1

// Define input settings for Supertrend indicators
supertrend1_period = input.int(3, title = "Supertrend 1 Period")
supertrend1_multiplier = input.int(12, title = "Supertrend 1 Multiplier")
supertrend2_period = input.int(2, title = "Supertrend 2 Period")
supertrend2_multiplier = input.int(11, title = "Supertrend 2 Multiplier")
supertrend3_period = input.int(1, title = "Supertrend 3 Period")
supertrend3_multiplier = input.int(10, title = "Supertrend 3 Multiplier")

// EMA settings with user-defined length
ema_length = input.int(100, title = "EMA Length")

// Calculate Supertrend values for all three indicators
[supertrend1_value, _] = ta.supertrend(supertrend1_period, supertrend1_multiplier)
[supertrend2_value, _] = ta.supertrend(supertrend2_period, supertrend2_multiplier)
[supertrend3_value, _] = ta.supertrend(supertrend3_period, supertrend3_multiplier)

// Calculate EMA
ema = ta.ema(close, ema_length)

// Define long entry condition
longCondition = close > ema and close > supertrend1_value and close > supertrend2_value and close > supertrend3_value

// Define short entry condition
shortCondition = close < ema and close < supertrend1_value and close < supertrend2_value and close < supertrend3_value

// Strategy orders
if (longCondition)
    strategy.entry("Buy Order", strategy.long)
if (shortCondition)
    strategy.entry("Sell Order", strategy.short)

// Plot Supertrends and EMA for reference
plot(supertrend1_value, title="Supertrend 1", color=color.green)
plot(supertrend2_value, title="Supertrend 2", color=color.blue)
plot(supertrend3_value, title="Supertrend 3", color=color.red)
plot(ema, title="EMA", color=color.orange)

// Plot strategy entry signals
plotshape(series=longCondition, title="Long Entry Signal", location=location.belowbar, color=color.green, style=shape.triangleup, size=size.small)
plotshape(series=shortCondition,title="Short Entry Signal", location=location.abovebar,color=color.red ,style=shape.triangledown,size=size.small)
Detail
https://www.fmz.com/strategy/436143
Last Modified
2023-12-21 16:02:57
