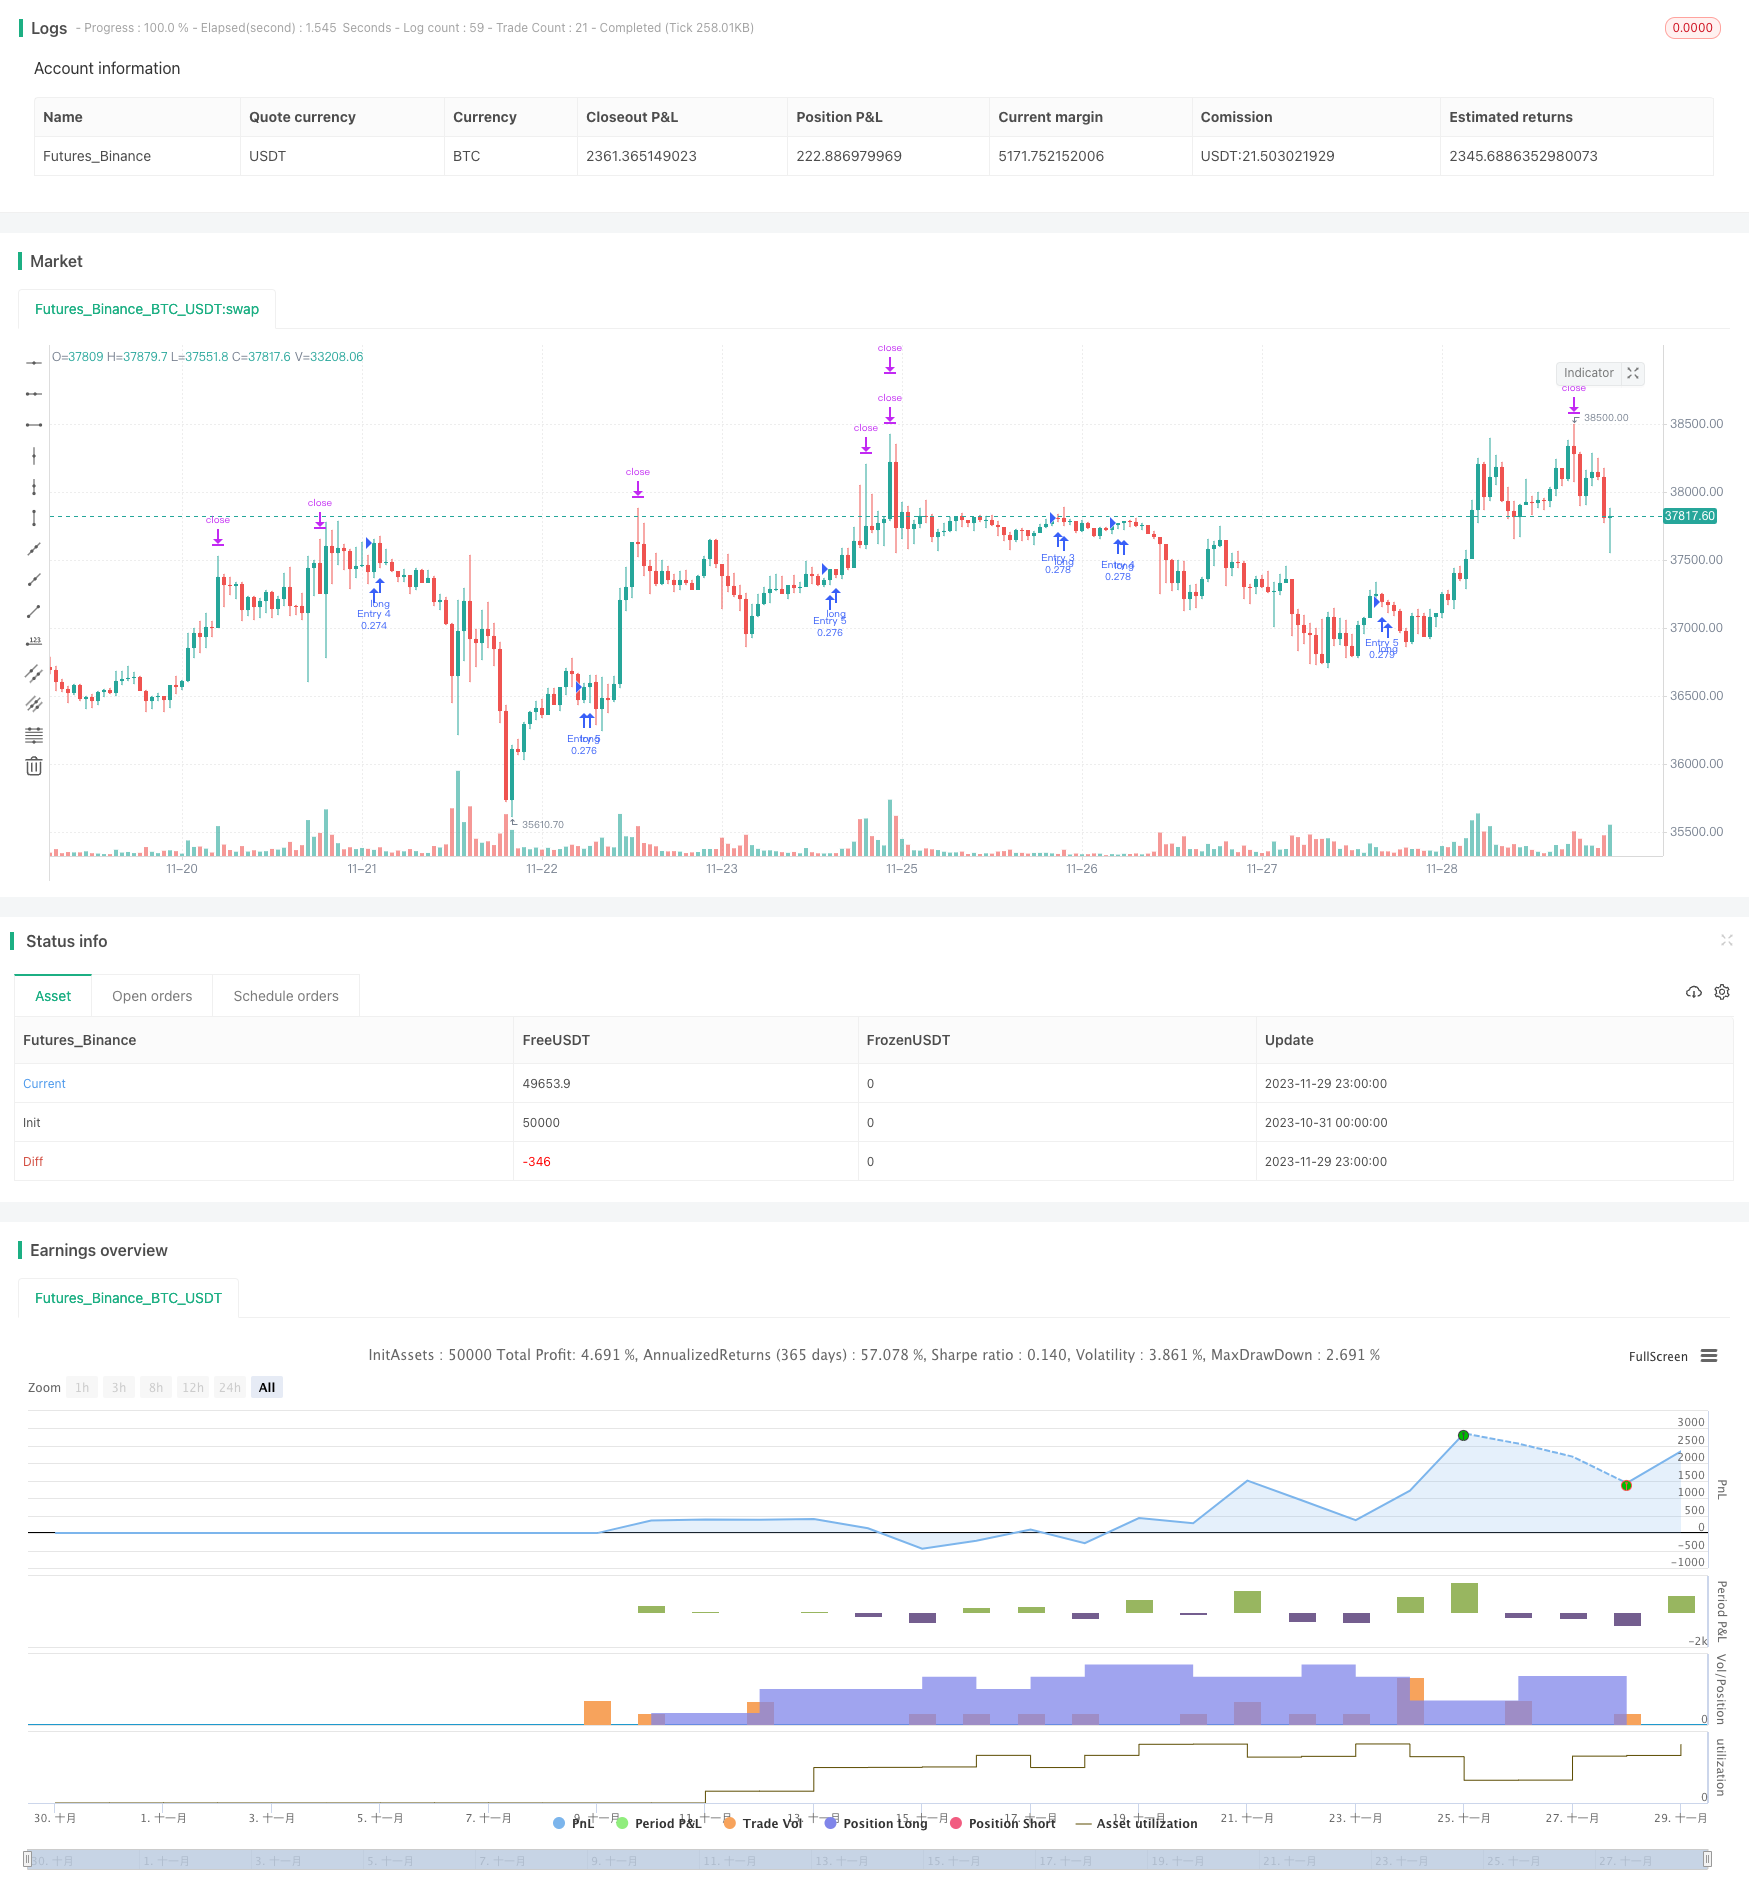
Name
基于多时间框架的量化波段交易策略Bitcoin-Quantitative-Band-Trading-Strategy-Based-on-Multiple-Timeframes
Author
ChaoZhang
Strategy Description
本策略通过结合不同时间框架下的量化指标,实现对比特币价格波段的识别,从而进行追踪交易。策略采用5分钟时间框架,长期持有波段获利。
- 基于日线时间框架计算的RSI指标,采用成交量进行加权计算,过滤假突破。
- 对日线RSI指标进行EMA平滑处理,构建量化波段指标。
- 5分钟时间框架采用线性回归指标和HMA指标构建交易信号。
- 策略通过量化波段指标和交易信号的组合,实现不同时间框架之间的耦合,识别价格中长线波段。
- 采用成交量加权的RSI指标,能有效识别真实波段,过滤假突破。
- HMA指标对价格变化更加敏感,能及时捕捉转折。
- 多时间框架结合,识别中长线波段更准确。
- 5分钟时间框架进行交易,更高操作频率。
- 波段追踪策略,无需精确选点,持有时间更长。
- 量化指标可能发出错误信号,建议结合基本面分析。
- 波段可能中途反转,应设置止损退出机制。
- 交易信号延迟,可能错过最佳入场点位。
- 盈利波段需要较长持有期,需承担一定资金压力。
- 测试不同参数的RSI指标效果。
- 尝试引入其他辅助波段指标。
- 优化HMA指标的长度参数。
- 添加止损和止盈策略。
- 调整波段交易的持有周期。
本策略通过多时间框架耦合和波段追踪方式,实现了对比特币中长线趋势的有效捕捉。相较于短线交易,中长线波段交易回撤较小,获利空间更大。下一步,通过参数调整和风险管理策略的添加,可望进一步提高策略收益率和稳定性。
||
This strategy identifies the price bands of Bitcoin by combining quantitative indicators across different timeframes, and conducts trend tracking trades. It adopts the 5-minute timeframe and aims for long-term holding of bands for profit.
- The RSI indicator calculated based on the daily timeframe weighs based on trading volume to filter false breakouts.
- The daily RSI indicator is smoothed by an EMA to build a quantitative band indicator.
- The 5-minute timeframe uses a combination of Linear Regression and HMA indicators to generate trading signals.
- By combining the quantitative band indicator and trading signals across timeframes, the strategy identifies mid-to-long-term price bands.
- The volume-weighted RSI indicator can effectively identify true bands and filter false breakouts.
- The HMA indicator is more sensitive to price changes and can capture turns timely.
- Combining multiple timeframes leads to more accurate identification of mid-to-long-term bands.
- Trading on the 5-minute timeframe allows higher operation frequency.
- As a band tracking strategy, it does not require accurate picking of points and can hold for longer periods.
- Quantitative indicators may generate false signals, fundamental analysis is recommended.
- Bands may see midway reversals, stop-loss mechanisms should be in place.
- Signal delays may lead to missing best entry points.
- Profitable bands need longer holding periods, requiring capital pressure tolerance.
- Test effectiveness of RSI indicators with different parameters.
- Try introducing other auxiliary band indicators.
- Optimize HMA indicator length parameters.
- Add stop loss and take profit strategies.
- Adjust holding cycle for band trades.
This strategy effectively captures Bitcoin's mid-to-long-term trends by coupling timeframes and band tracking. Compared to short-term trading, mid-to-long-term band trading sees smaller drawdowns and greater profit potential. Next steps involve further enhancing profitability and stability through parameter tuning and risk management additions.
[/trans]
Strategy Arguments
| Argument | Default | Description |
|---|---|---|
| v_input_1 | 250 | Fast filter length |
| v_input_2 | 500 | Slow filter length |
| v_input_3 | true | From Month |
| v_input_4 | 10 | From Day |
| v_input_5 | 2020 | From Year |
| v_input_6 | true | Thru Month |
| v_input_7 | true | Thru Day |
| v_input_8 | 2112 | Thru Year |
| v_input_9 | true | Show Date Range |
| v_input_10 | 1D | HTF |
| v_input_11 | 0 | Timeframe: 1 |
| v_input_12 | 50 | Period |
| v_input_13 | true | Shift |
| v_input_14 | 25 | len |
| v_input_15 | true | filter |
| v_input_16 | 3 | ProfitTarget_Percent |
| v_input_17 | 10 | LossTarget_Percent |
Source (PineScript)
/*backtest
start: 2023-10-31 00:00:00
end: 2023-11-30 00:00:00
period: 1h
basePeriod: 15m
exchanges: [{"eid":"Futures_Binance","currency":"BTC_USDT"}]
*/

//@version=4

strategy(title='Pyramiding BTC 5 min', overlay=true, pyramiding=5, initial_capital=10000, default_qty_type=strategy.percent_of_equity, default_qty_value=20, commission_type=strategy.commission.percent, commission_value=0.075)
//the pyramide based on this script  https://www.tradingview.com/script/7NNJ0sXB-Pyramiding-Entries-On-Early-Trends-by-Coinrule/
//
fastLength = input(250, title="Fast filter length ", minval=1)
slowLength = input(500,title="Slow filter length",  minval=1)
source=close
v1=ema(source,fastLength)
v2=ema(source,slowLength)
//
//Backtest dates
fromMonth = input(defval=1, title="From Month")
fromDay = input(defval=10, title="From Day")
fromYear = input(defval=2020, title="From Year")
thruMonth = input(defval=1, title="Thru Month")
thruDay = input(defval=1, title="Thru Day")
thruYear = input(defval=2112, title="Thru Year")

showDate = input(defval=true, title="Show Date Range")

start = timestamp(fromYear, fromMonth, fromDay, 00, 00)  // backtest start window
finish = timestamp(thruYear, thruMonth, thruDay, 23, 59)  // backtest finish window
window() =>  // create function "within window of time"
    time >= start and time <= finish ? true : false


leng=1
p1=close[1]

len55 = 10
//taken from https://www.tradingview.com/script/Ql1FjjfX-security-free-MTF-example-JD/
HTF = input("1D", type=input.resolution)
ti = change( time(HTF) ) != 0
T_c = fixnan( ti ? close : na )

vrsi = rsi(cum(change(T_c) * volume), leng)
pp=wma(vrsi,len55)

d=(vrsi[1]-pp[1])
len100 = 10
x=ema(d,len100)
//
zx=x/-1
col=zx > 0? color.lime : color.orange

//

tf10 = input("1", title = "Timeframe", type = input.resolution, options = ["1", "5", "15", "30", "60","120", "240","360","720", "D", "W"])

length = input(50, title = "Period", type = input.integer)
shift = input(1, title = "Shift", type = input.integer)

hma(_src, _length)=>
    wma((2 * wma(_src, _length / 2)) - wma(_src, _length), round(sqrt(_length)))

hma3(_src, _length)=>
    p = length/2
    wma(wma(close,p/3)*3 - wma(close,p/2) - wma(close,p),p)

b =security(syminfo.tickerid, tf10, hma3(close[1], length)[shift])
//plot(a,color=color.gray)
//plot(b,color=color.yellow)
close_price = close[0]
len = input(25)

linear_reg = linreg(close_price, len, 0)


filter=input(true)

buy=crossover(linear_reg, b)

longsignal = (v1 > v2 or filter == false ) and buy and window()

//set take profit

ProfitTarget_Percent = input(3)
Profit_Ticks = close * (ProfitTarget_Percent / 100) / syminfo.mintick

//set take profit

LossTarget_Percent = input(10)
Loss_Ticks = close * (LossTarget_Percent / 100) / syminfo.mintick


//Order Placing

strategy.entry("Entry 1", strategy.long, when=strategy.opentrades == 0 and longsignal)

strategy.entry("Entry 2", strategy.long, when=strategy.opentrades == 1 and longsignal)

strategy.entry("Entry 3", strategy.long, when=strategy.opentrades == 2 and longsignal)

strategy.entry("Entry 4", strategy.long, when=strategy.opentrades == 3 and longsignal)

strategy.entry("Entry 5", strategy.long, when=strategy.opentrades == 4 and longsignal)


if strategy.position_size > 0
    strategy.exit(id="Exit 1", from_entry="Entry 1", profit=Profit_Ticks, loss=Loss_Ticks)
    strategy.exit(id="Exit 2", from_entry="Entry 2", profit=Profit_Ticks, loss=Loss_Ticks)
    strategy.exit(id="Exit 3", from_entry="Entry 3", profit=Profit_Ticks, loss=Loss_Ticks)
    strategy.exit(id="Exit 4", from_entry="Entry 4", profit=Profit_Ticks, loss=Loss_Ticks)
    strategy.exit(id="Exit 5", from_entry="Entry 5", profit=Profit_Ticks, loss=Loss_Ticks)
Detail
https://www.fmz.com/strategy/433905
Last Modified
2023-12-01 13:50:02
