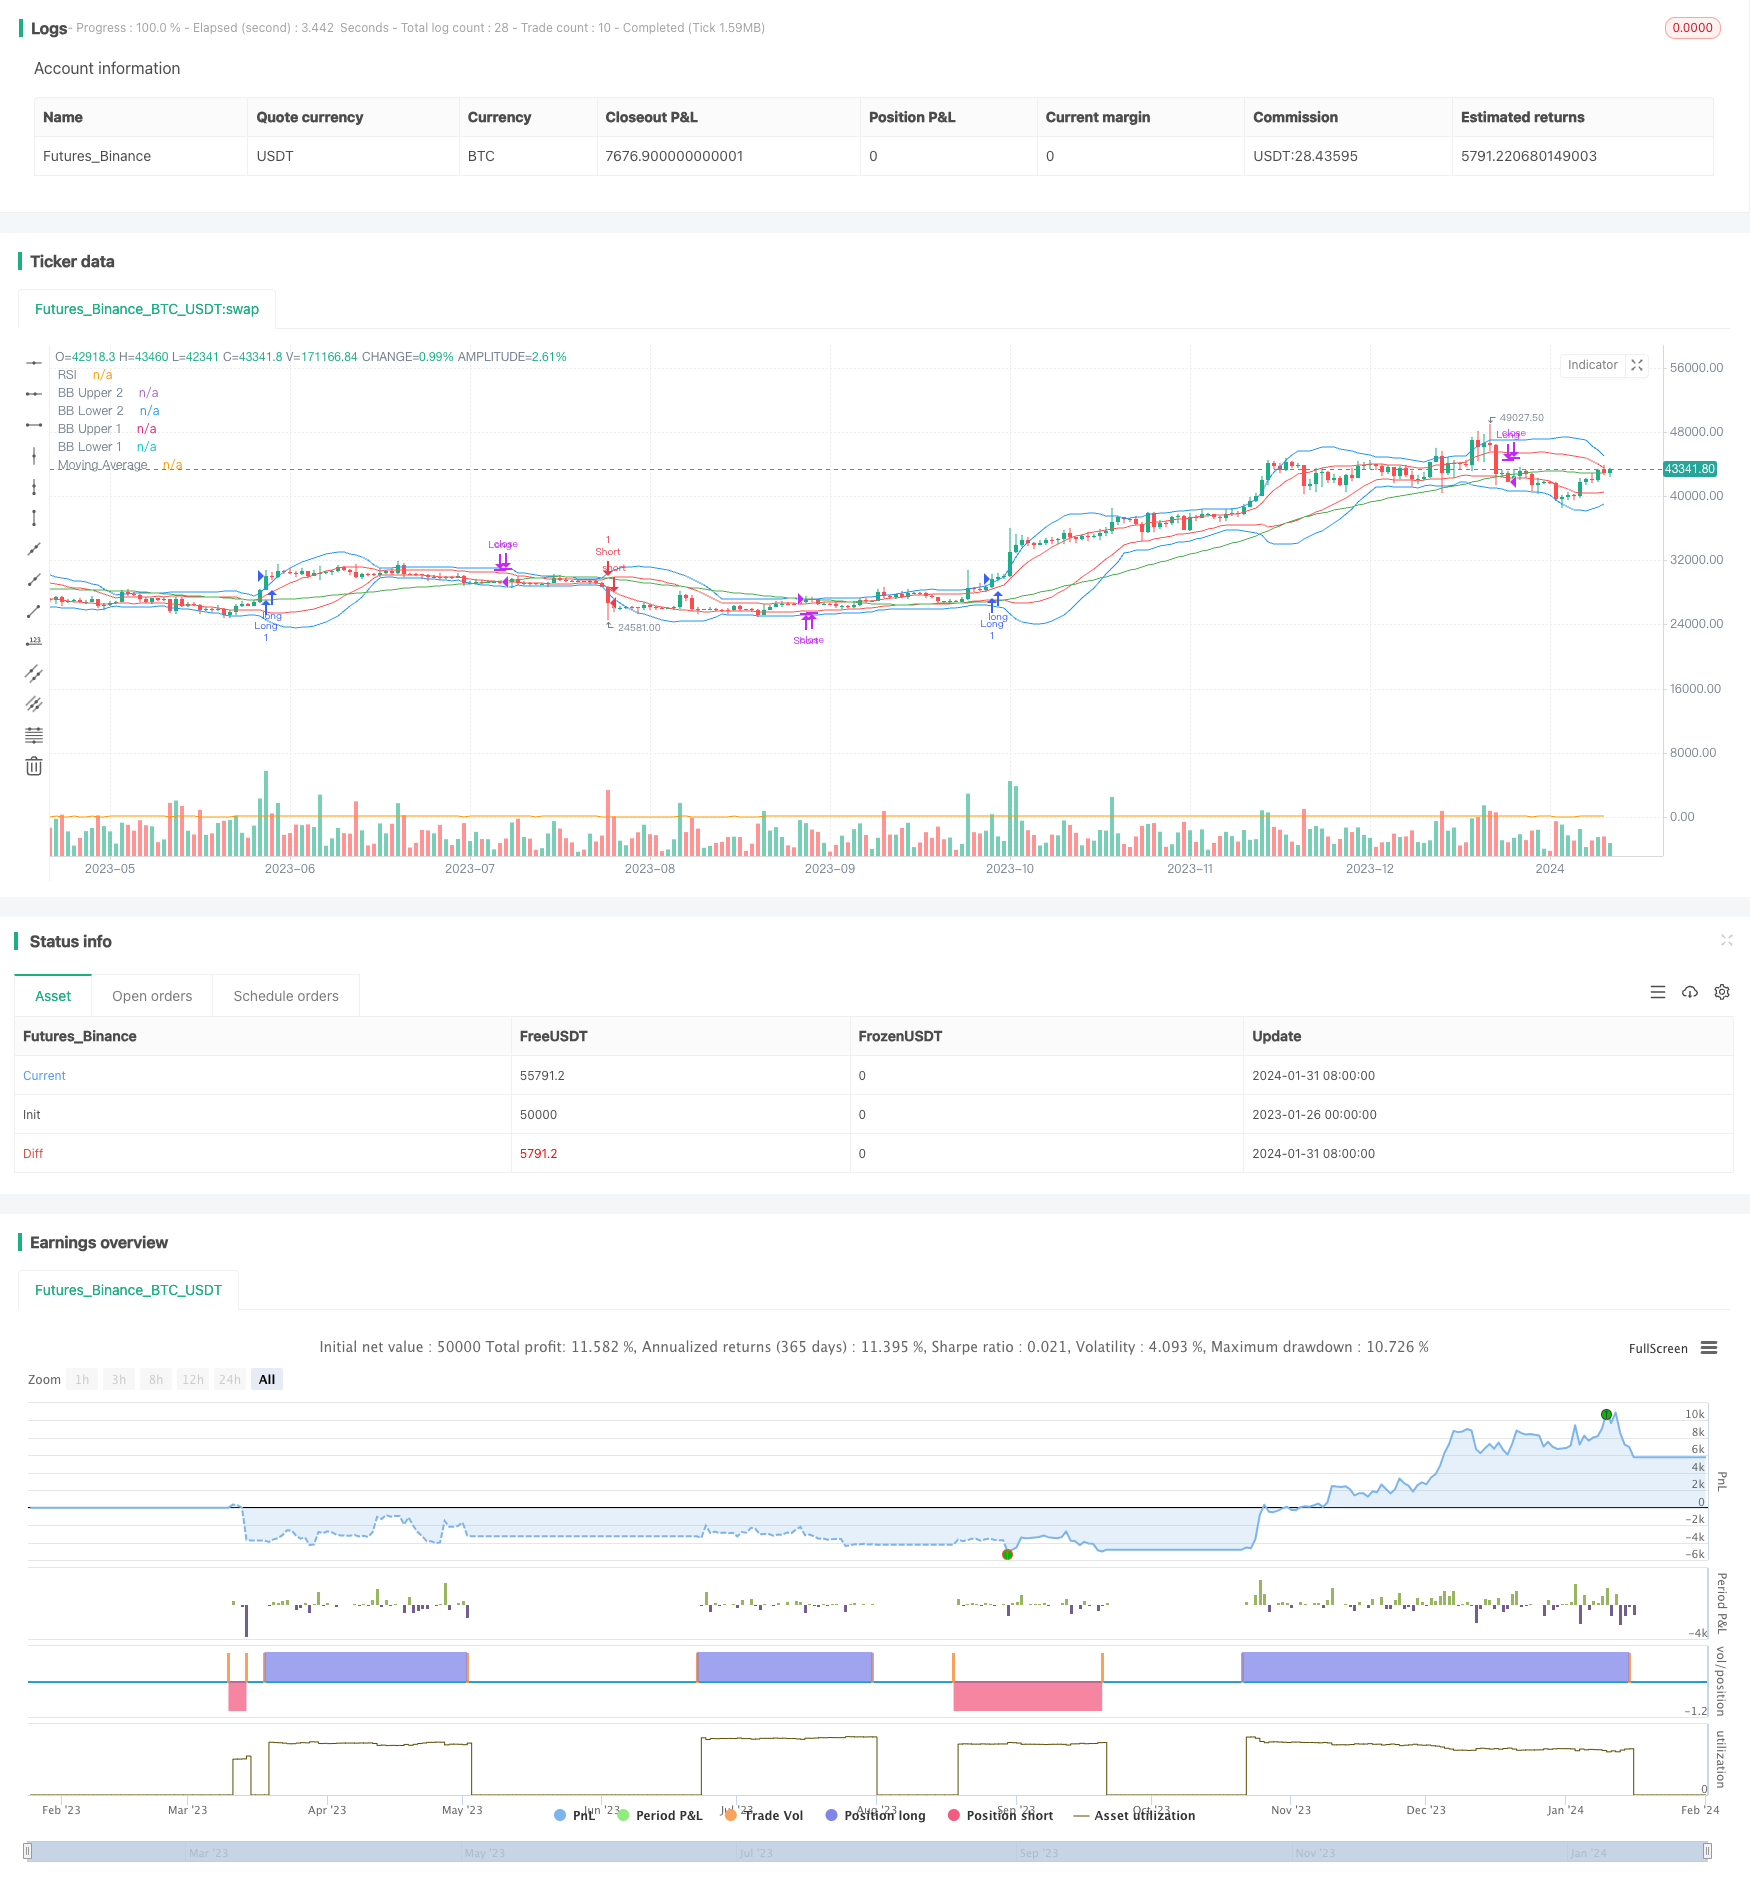
Name
基于布林带RSI和移动平均线的趋势跟踪策略Trend-Following-Strategy-Based-on-Bollinger-Bands-RSI-and-Moving-Average
Author
ChaoZhang
Strategy Description
该策略集成了布林带指标、相对强弱指标(RSI)和移动平均线(MA),目的是识别市场的潜在入场和出场点。它可以生成买入和卖出的信号 alerts,这些 alerts 可以通过手动交易或者自动交易系统来执行。
该策略使用两个参数不同的布林带来生成价格通道。布林带的默认参数是长度为20周期,标准差为2。布林带的上轨和下轨分别作为动态的阻力和支撑位。
RSI 指标用于判断价格动量强弱。读取 RSI 的数值来判断是否超买或超卖。
策略中还集成了50周期的移动平均线,用来判断总体趋势方向。当价格高于移动平均线时,表示正在上涨趋势;当价格低于移动平均线时,表示正在下跌趋势。
买入信号的条件:RSI高于超买线且布林带没有收缩。
卖出信号的条件:RSI低于超卖线且布林带没有收缩。
平仓信号的条件:长仓则价格收盘低于移动平均线。短仓则价格收盘高于移动平均线。
-
结合布林带、RSI 和移动平均线三个指标,综合判断趋势方向,避免产生假信号。
-
布林带判断局部高低点并确认突破,RSI过滤假突破,移动平均线判断总体走势。三者相互验证,精确找出趋势转换点。
-
策略参数经过优化,布林带使用两个标准差参数,更准确描绘价格通道。
-
布林带收缩时,容易产生错误信号。此时RSI也接近中性区,应避免交易。
-
震荡趋势中,RSI和移动平均线可能产生错误信号。应预先识别是否处于震荡市场。
-
无法有效处理价格跳空缺口的情况。应结合其他指标判断真实突破。
-
优化布林带和RSI的参数,使其更符合不同品种和时间周期的特点。
-
增加附加止损位设置。当价格突破止损线时自动止损。
-
增加趋势过滤器,如ADX,用来判断是否进入趋势行情。减少震荡市无效交易。
-
结合自动交易系统,利用生成的交易信号自动执行交易,无需人工干预。
该策略整合布林带、RSI和移动平均线三个指标的优势,通过参数优化提高了信号的准确性。可自动生成交易 Alerts 执行策略交易。风险主要在于震荡行情中的错误信号产生。通过趋势判断指标进行过滤可以减少无效交易。整体来说,该策略利用参数优化和多指标集成提高了交易信号质量,值得实盘验证和投入使用。
||
This strategy integrates Bollinger Bands, Relative Strength Index (RSI) and Moving Average (MA) to identify potential entry and exit points in the market. It can generate buy and sell signals (alerts) that can be executed manually or via automated trading systems.
The strategy uses two Bollinger Bands with different parameters to create price channels. The default parameters are length of 20 periods and standard deviation of 2. The upper and lower bands serve as dynamic resistance and support levels.
The RSI indicator gauges price momentum strength. Its values are used to determine if overbought or oversold conditions exist.
A 50-period moving average is incorporated to identify the overall trend direction. When price is above the MA, it suggests an uptrend. When price is below the MA, it suggests a downtrend.
Entry conditions for long trades are when RSI goes above overbought level and Bollinger Bands are not contracting. For short trades, it is when RSI goes below oversold level and Bollinger Bands are not contracting.
Exit conditions for long trades are when RSI drops below overbought level or when price closes below 50-period MA. For short trades it is when RSI rises above oversold level or when price closes above 50-period MA.
-
Combining Bollinger Bands, RSI and MA avoids generating false signals by cross validating signals.
-
Bollinger Bands identify local highs/lows and confirm breakouts. RSI filters false breakouts. MA determines overall trend. Signals are verified.
-
Optimized parameters of Bollinger Bands using two standard deviations more accurately depict price channels.
-
Bollinger Bands may generate false signals when contracting. RSI is also neutral and trading should be avoided.
-
RSI and MA may generate incorrect signals during ranging markets. Ranging conditions should be identified beforehand.
-
Price gaps cannot be effectively handled. Other indicators should confirm true breakouts.
-
Optimize parameters of Bollinger Bands and RSI for different products and timeframes.
-
Add stop loss orders that trigger automatically when price breaches stop level.
-
Add trend filter like ADX to avoid inefficient trades during ranging markets.
-
Integrate with automated trading system to execute signals automatically without manual intervention.
This strategy combines the strengths of Bollinger Bands, RSI and MA with optimized parameters to improve signal accuracy. It can automatically generate trade alerts for execution. Main risks come from false signals during ranging markets. Adding a trend filter can reduce inefficient trades. Overall, by using parameter optimization and integrating multiple indicators, this strategy improves signal quality and is worth validating in live markets for usage.
[/trans]
Strategy Arguments
| Argument | Default | Description |
|---|---|---|
| v_input_1 | 20 | BB Length |
| v_input_2 | 2 | BB Standard Deviation |
| v_input_3 | true | BB Deviation 1 |
| v_input_4 | 14 | RSI Length |
| v_input_5 | 70 | Overbought RSI Level |
| v_input_6 | 30 | Oversold RSI Level |
| v_input_7 | 50 | MA Length |
| v_input_8 | true | Stop Loss Percentage |
| v_input_9_close | 0 | Source: close |
Source (PineScript)
/*backtest
start: 2023-01-26 00:00:00
end: 2024-02-01 00:00:00
period: 1d
basePeriod: 1h
exchanges: [{"eid":"Futures_Binance","currency":"BTC_USDT"}]
*/

//@version=5
strategy("Bollinger Bands, RSI, and MA Strategy", overlay=true)

// Define input variables
b_len = input(20, title="BB Length")
bb_mult = input(2.0, title="BB Standard Deviation")
bb_deviation1 = input(1.0, title="BB Deviation 1")
rsi_len = input(14, title="RSI Length")
overbought = input(70, title="Overbought RSI Level")
oversold = input(30, title="Oversold RSI Level")
ma_len = input(50, title="MA Length")
stop_loss_percent = input(1.0, title="Stop Loss Percentage")
source = input(close, title="Source")

// Calculate Bollinger Bands
bb_upper = ta.sma(source, b_len) + bb_mult * ta.stdev(source, b_len)
bb_lower = ta.sma(source, b_len) - bb_mult * ta.stdev(source, b_len)
bb_upper1 = ta.sma(source, b_len) + bb_deviation1 * ta.stdev(source, b_len)
bb_lower1 = ta.sma(source, b_len) - bb_deviation1 * ta.stdev(source, b_len)

// Calculate RSI
rsi = ta.rsi(source, rsi_len)

// Calculate Moving Average
ma = ta.sma(source, ma_len)

// Determine if Bollinger Bands are contracting
bb_contracting = ta.stdev(source, b_len) < ta.stdev(source, b_len)[1]

// Entry conditions
enterLong = rsi > overbought and not bb_contracting
enterShort = rsi < oversold and not bb_contracting

// Exit conditions
exitLong = close < ma
exitShort = close > ma

// Exit trades and generate alerts
if strategy.position_size > 0 and exitLong
    strategy.close("Long") // Exit the long trade
    alert("Long Exit", alert.freq_once_per_bar_close)
if strategy.position_size < 0 and exitShort
    strategy.close("Short") // Exit the short trade
    alert("Short Exit", alert.freq_once_per_bar_close)

// Strategy orders
if enterLong
    strategy.entry("Long", strategy.long)
if enterShort
    strategy.entry("Short", strategy.short)
if exitLong
    strategy.close("Long")
if exitShort
    strategy.close("Short")

// Plotting Bollinger Bands
plot(bb_upper, color=color.blue, title="BB Upper 2")
plot(bb_lower, color=color.blue, title="BB Lower 2")
plot(bb_upper1, color=color.red, title="BB Upper 1")
plot(bb_lower1, color=color.red, title="BB Lower 1")

// Plotting RSI
plot(rsi, color=color.orange, title="RSI")

// Plotting Moving Average
plot(ma, color=color.green, title="Moving Average")
Detail
https://www.fmz.com/strategy/440809
Last Modified
2024-02-02 11:35:17
