Name
基于斐波那契回撤的量化交易策略Fibonacci-Retracement-Quantitative-Trading-Strategy
Author
ChaoZhang
Strategy Description
[trans]
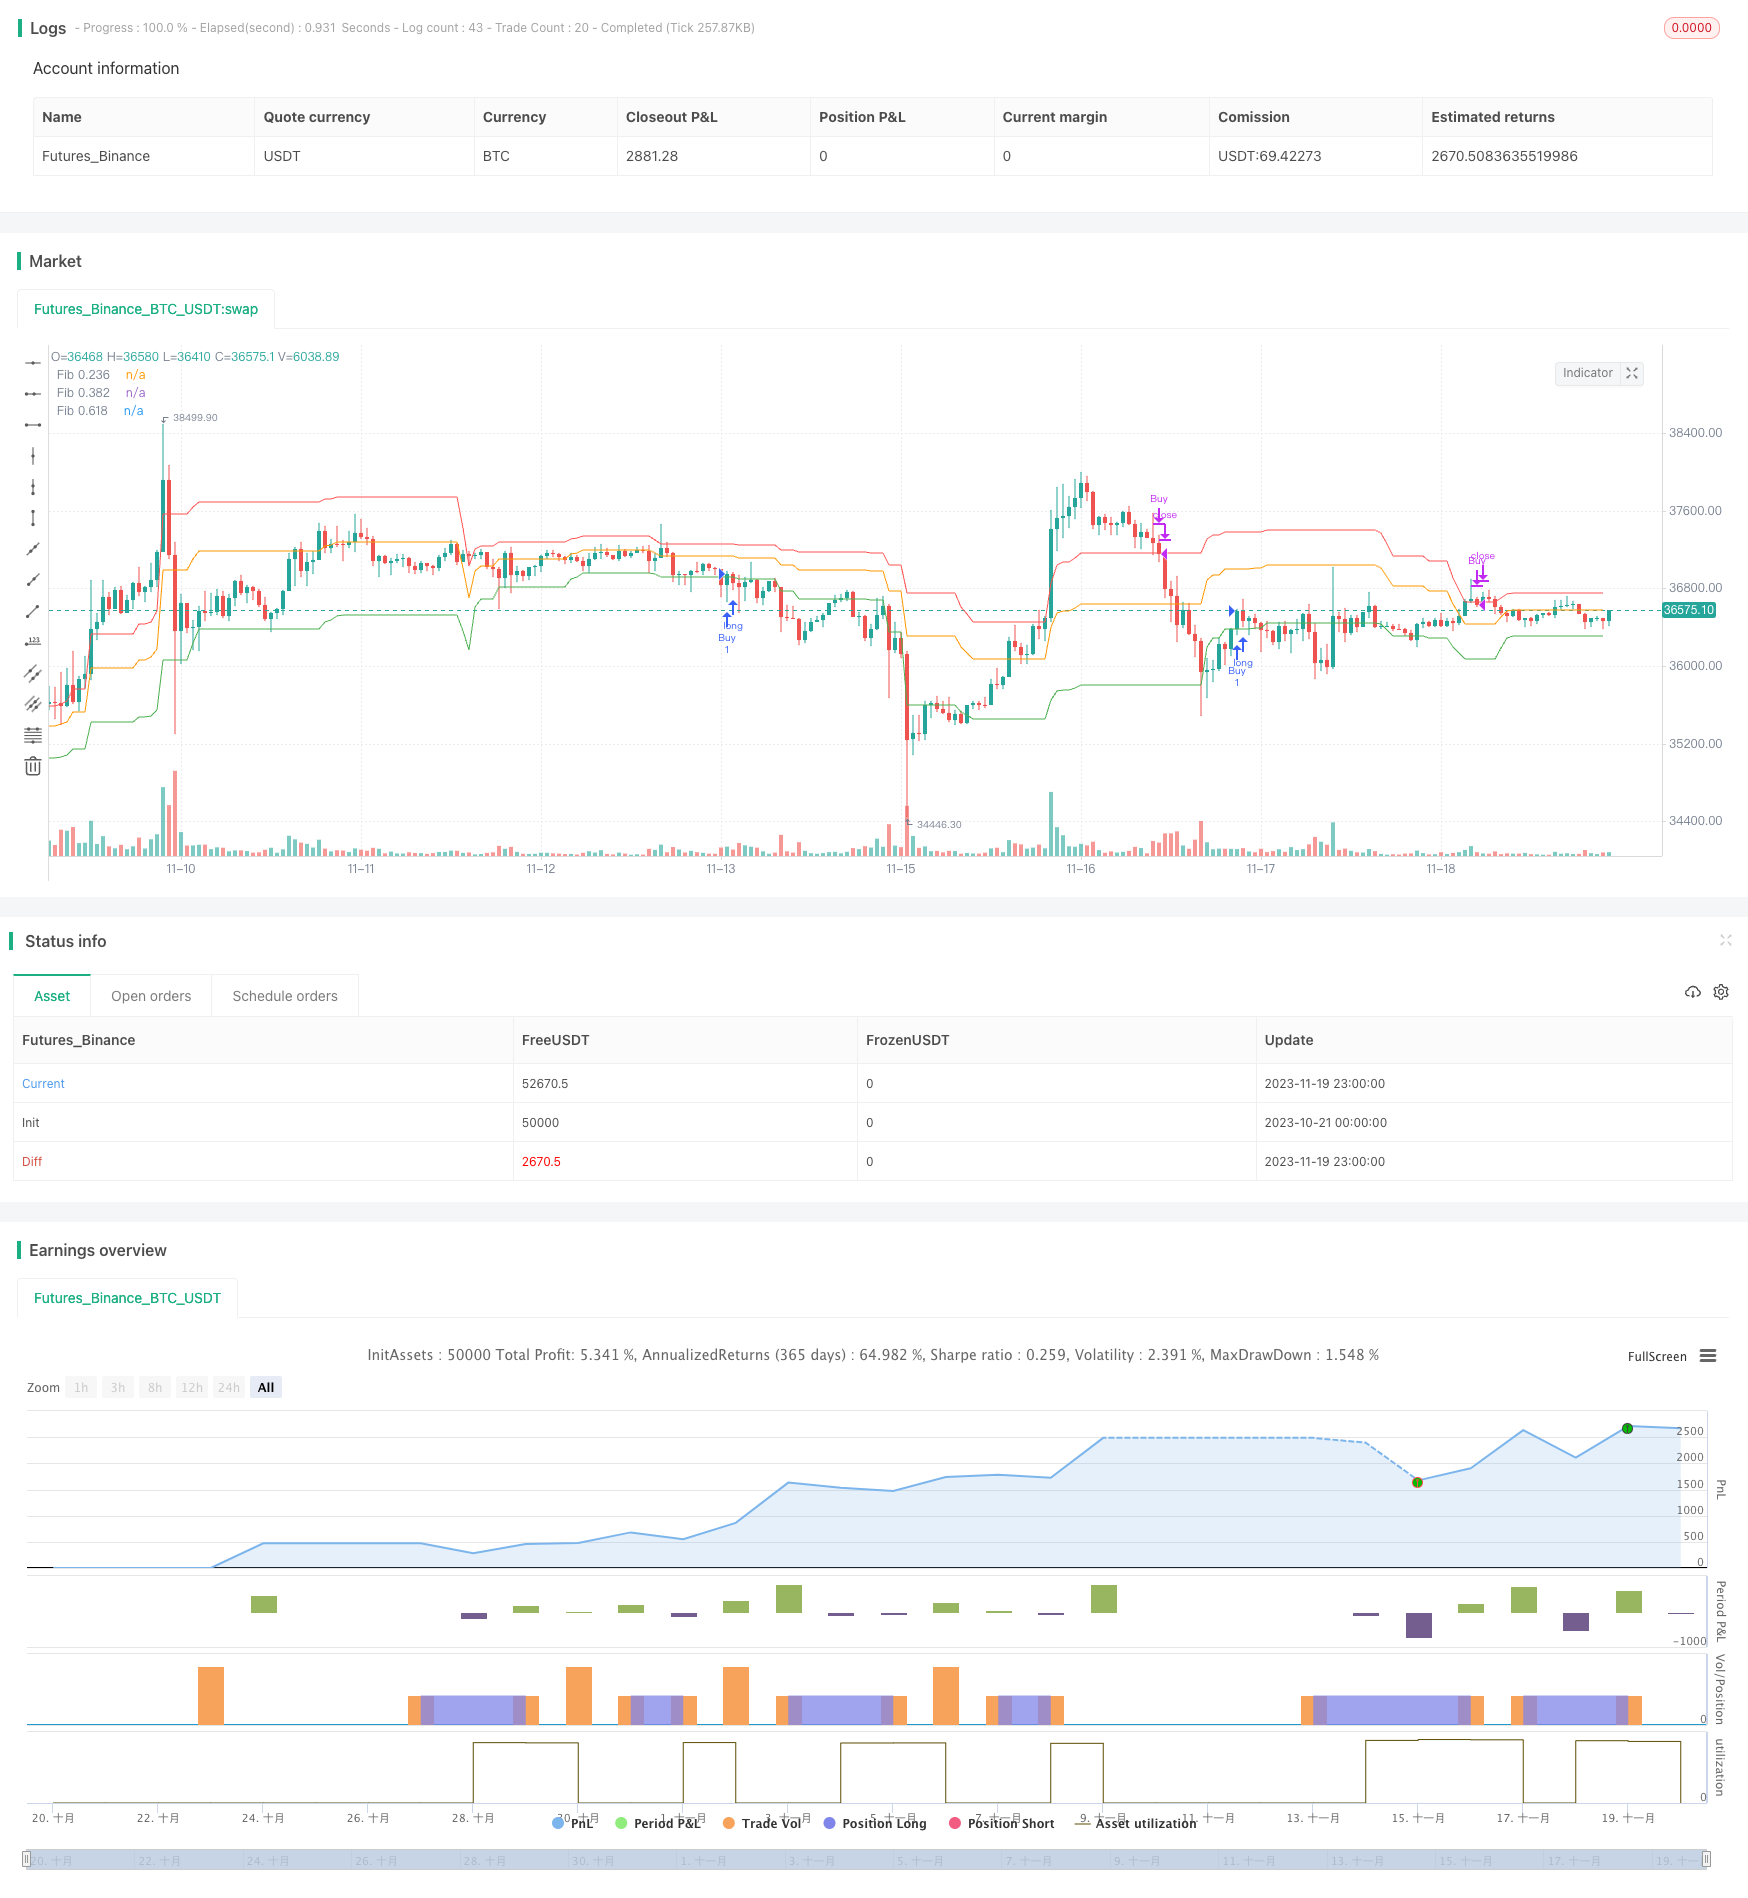
本策略基于斐波那契回撤原理设计。当价格上涨或下跌并接近关键的斐波那契回撤位置时,进行买入或卖出操作。该策略利用斐波那契理论判断价格反转的关键点,在趋势反转前适当入场,目标获得超越大盘的超额收益。
策略首先计算最近50天的最高价和最低价,得到价格涨跌幅。然后根据斐波那契三个关键水平0.236、0.382、0.618,计算出对应的价格回撤位置。当价格上涨并接近0.618水平(黄金分割点)时,做多;当价格下跌并接近0.236水平时,平仓。
该策略基于斐波那契回撤理论。斐波那契序列中任意一个数约等于前两个数的比例,并且这个比例接近0.618。斐波那契回撤理论认为,价格涨跌后接近0.382或0.618水平时,很有可能发生反转。本策略即利用这一规律判断操作时机。
这是一个较为典型的穿越交易策略。其最大优势是能提前判断价格反转的关键点,在趋势发生转折之前适当入场。另外,斐波那契理论在技术分析中广泛运用,这使得本策略具有一定的学术依据。
该策略的主要风险在于价格突破斐波那契回撤位置后继续运行,从而导致亏损扩大的风险。此外,任何基于经验判断的交易策略,都无法完全避免失误的判断导致的亏损。
为控制风险,可以设置止损位置,在亏损扩大至一定程度时止损退出。另外也可以根据市场情况,适当调整斐波那契回撤的位置,使交易信号更加可靠。
该策略可从以下几个方面进行优化:
-
动态调整斐波那契回撤位,不同市场阶段可以设定不同参数,使交易更加灵活;
-
结合其他指标进行过滤,如增加成交量的判断、运用均线等,使信号更加可靠;
-
优化止损策略,通过追踪止损、区间止损等方式更好控制风险;
-
测试更长的数据周期,验证策略稳定性;调整持仓时间以求最大化收益。
本策略基于斐波那契理论判断价格反转点,属于典型的穿越式交易策略。具有一定的技术分析依据,能提前抓住价格转折机会。但也存在一定概率亏损的风险。通过动态调整参数、设置止损、增加过滤条件等方式可以不断优化,使策略更加稳定 profitable。
||
This strategy is designed based on the Fibonacci retracement principle. It enters long or short positions when prices rise or fall and approach key Fibonacci retracement levels. The strategy utilizes Fibonacci theory to identify critical reversal points in prices and appropriately enters positions ahead of trend reversals, aiming for excess returns over the broader market.
The strategy first calculates the highest and lowest prices over the past 50 days to determine price movement range. It then uses three key Fibonacci ratios - 0.236, 0.382 and 0.618 to calculate corresponding retracement levels. It goes long when prices rise and approach the 0.618 level (golden ratio), and closes long positions when prices fall to 0.236 level.
The strategy leverages the Fibonacci retracement theory, which observes that in a Fibonacci sequence, any number is approximately equal to the ratio of the preceding two numbers, and this ratio is close to 0.618. The theory suggests that prices tend to reverse when retracing to 0.382 or 0.618 levels after a rise or fall. This strategy hence utilizes this pattern to determine entry and exit signals.
This is a typical breakout trading strategy. Its biggest edge is the ability to identify key reversal points beforehand and appropriately enter positions before trend reversals. Additionally, Fibonacci theory is widely applied in technical analysis, giving this strategy academic merits.
The main risk is prices continuing to trend after penetrating Fibonacci retracement levels, thus amplifying losses. Moreover, empirical trading strategies cannot completely avoid losses due to misjudged signals.
To mitigate risks, stop losses can be set to exit positions if losses exceed certain threshold. Fibonacci levels can also be dynamically adjusted based on changing market conditions to generate more reliable signals.
The strategy can be optimized in the following ways:
-
Dynamically adjust Fibonacci levels based on varying market stages, allowing for more flexibility.
-
Add other indicators for signal filtering, e.g. volume, moving averages etc, to make signals more reliable.
-
Optimize stop loss mechanisms with trailing stops, zone stops etc to better control risks.
-
Test over longer time frames to verify stability; adjust holding period to maximize returns.
This strategy identifies price reversal points based on Fibonacci theory, belonging to the breakout trading category. It has academic merits in seizing turning point opportunities ahead of the market, but also bears certain probability of losses. Continual optimizations around adaptive parameters, stop losses, extra signal filtering etc can enhance its profitability and stability.
[/trans]
Strategy Arguments
| Argument | Default | Description |
|---|---|---|
| v_input_1 | 50 | 斐波那契周期长度 |
| v_input_2 | 0.236 | 斐波那契水平1 |
| v_input_3 | 0.382 | 斐波那契水平2 |
| v_input_4 | 0.618 | 斐波那契水平3 |
Source (PineScript)
/*backtest
start: 2023-10-21 00:00:00
end: 2023-11-20 00:00:00
period: 1h
basePeriod: 15m
exchanges: [{"eid":"Futures_Binance","currency":"BTC_USDT"}]
*/

//@version=5
strategy("斐波那契回撤交易策略", overlay=true, initial_capital=10000)

// 参数
length = input(50, title="斐波那契周期长度")
fib1 = input(0.236, title="斐波那契水平1")
fib2 = input(0.382, title="斐波那契水平2")
fib3 = input(0.618, title="斐波那契水平3")

// 计算斐波那契水平
highLevel = ta.highest(high, length)
lowLevel = ta.lowest(low, length)
range1 = highLevel - lowLevel
fibLevel1 = highLevel - range1 * fib1
fibLevel2 = highLevel - range1 * fib2
fibLevel3 = highLevel - range1 * fib3

// 条件
longCondition = ta.crossover(close, fibLevel3)
shortCondition = ta.crossunder(close, fibLevel1)

// 下单
strategy.entry("Buy", strategy.long, when=longCondition)
strategy.close("Buy", when=shortCondition)

// 图表标记
plot(fibLevel1, title="Fib 0.236", color=color.red)
plot(fibLevel2, title="Fib 0.382", color=color.orange)
plot(fibLevel3, title="Fib 0.618", color=color.green)
Detail
https://www.fmz.com/strategy/432798
Last Modified
2023-11-21 15:57:11
