Name
基于日线枢轴的多空自动交易策略Automatic-Long-Short-Trading-Strategy-Based-on-Daily-Pivot-Points
Author
ChaoZhang
Strategy Description
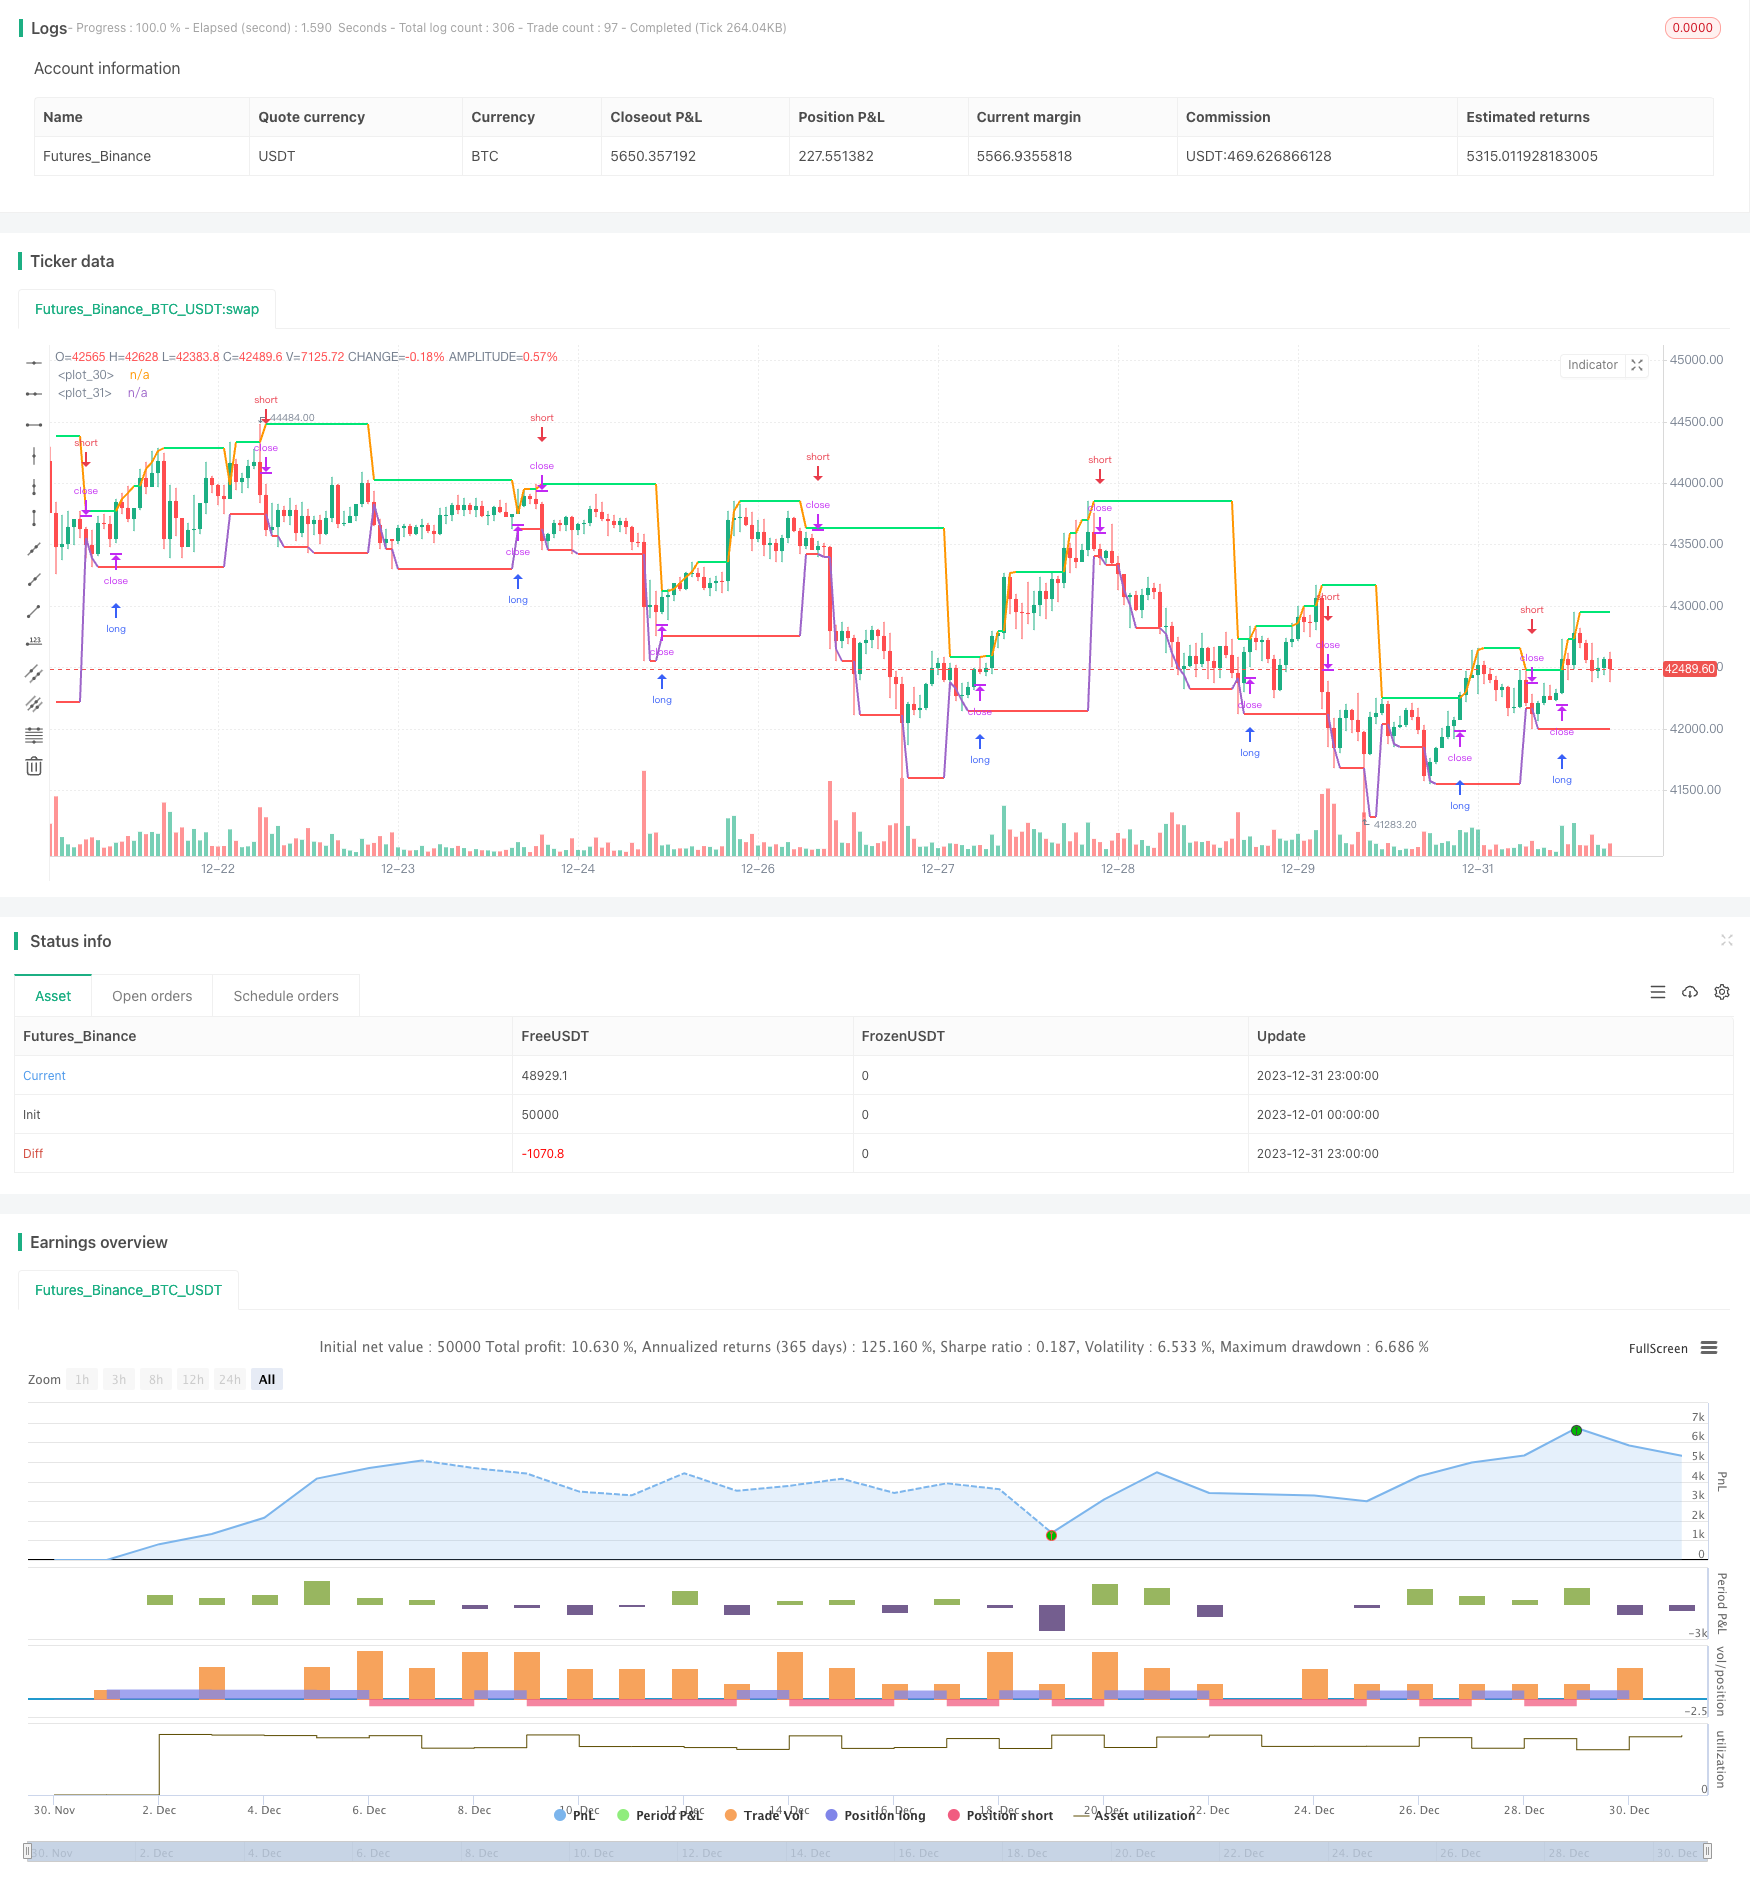
该策略基于日线的最高价和最低价绘制两条线,作为多空判断的依据。当价格上穿最高价线时,做多;当价格下穿最低价线时,做空。可以自动进行多空切换。
该策略主要利用了日线的枢轴点来判断多空。所谓“枢轴”,就是昨日的最高价和最低价。这两条线构成一个交易区间,如果今日的价格突破这两个点中的任一个,那么就可以判断趋势发生转折。
具体来说,策略主要逻辑如下:
- 最高价线:绘制昨日的最高价水平线,如果今日收盘价突破该线则为多头信号
- 最低价线:绘制昨日的最低价水平线,如果今日收盘价突破该线则为空头信号
- 多头入场:收盘价上穿最高价线时,开多仓
- 空头入场:收盘价下穿最低价线时,开空仓
- 止损:多头止损位于最低价线附近,空头止损位于最高价线附近
这样,通过最高、最低价的突破来捕捉趋势,实现自动的多空切换。
该策略主要有以下几个优势:
- 策略思路清晰,容易理解和实现
- 基于日线交易,时间周期长,不容易被短线噪音干扰
- 自动切换多空,最大程度规避非趋势市
- 止损点明确,有利于风险控制
该策略也存在一些风险:
- 日线交易时间周期较长,无法及时止损
- 突破的假突破可能导致不必要的损失
- 持仓时间过长可能导致亏损扩大
针对这些风险,我们可以从以下几个方面进行优化:
- 在日线突破的同时,加入其他更高频指标的确认
- 优化突破判定的参数,过滤掉部分假突破
- 采用移动止损或trailers等方式及时止损
该策略还有进一步优化的空间:
- 可以在更多品种和更长的数据上进行回测,验证策略的稳定性
- 可以探索其他突破指标的使用,如通道、布林带等
- 可以结合交易量指标,避免无量突破
- 可以加入更多过滤条件,减少假突破概率
- 可以尝试机器学习等方法对参数进行优化
总的来说,该策略基于简单的日线枢轴思路,实现了多空自动切换。策略逻辑清晰易懂,通过优化可以进一步提高稳定性。投资者可以根据自己的风险偏好,选择合适的参数应用于实盘交易。
||
This strategy draws two lines based on the highest and lowest prices of daily candlesticks for judgments of long/short trends. It goes long when price breaks through the highest price line and goes short when price breaks through the lowest price line. It can automatically switch between long and short positions.
This strategy mainly utilizes the pivot points of daily candlesticks to determine long/short trends. The so-called "pivot points" refer to yesterday's highest and lowest prices. These two lines form a trading range. If today's price breaks through either of them, it indicates a reversal of the trend.
Specifically, the main logic is as follows:
- Highest price line: Plot yesterday's highest price level. A break-through signals long trend.
- Lowest price line: Plot yesterday's lowest price level. A break-through signals short trend.
- Long entry: Open long position when closing price breaks through highest price line.
- Short entry: Open short position when closing price breaks through lowest price line.
- Stop loss: Long stop loss near lowest price line, short stop loss near highest price line.
By capturing trends through break-throughs of highest/lowest prices, it realizes automatic switching between long and short.
The main advantages of this strategy are:
- Simple logic, easy to understand and implement
- Based on daily bars, long cycle, less susceptible to short-term noises
- Automatic switch between long and short, avoid non-trending markets
- Clear stop loss, beneficial for risk control
Some risks:
- Daily bars have lower frequency, unable to stop loss timely
- Fake break-throughs may cause unnecessary losses
- Long holding may lead to expanded losses
Improvements:
- Add other higher frequency indicators for confirmation
- Optimize parameters to filter out fake break-throughs
- Adopt progressive stop loss methods for timely stop loss
Some directions:
- More backtesting on different products and longer datasets to test stability
- Explore other break-through indicators like channels, Bollinger Bands etc.
- Incorporate trading volume to avoid false breaks without volume
- Add more filters to reduce false breaks
- Utilize machine learning for parameter optimization
In summary, this simple strategy realizes auto long/short based on daily pivots. The logic is clear and easy to understand. Further optimizations can improve stability. Investors can apply it to live trading based on personal risk preference.
[/trans]
Strategy Arguments
| Argument | Default | Description |
|---|---|---|
| v_input_1 | true | Long |
| v_input_2 | false | Short |
| v_input_3 | 100 | Lot |
| v_input_4 | true | Show lines |
| v_input_5 | false | Show background |
| v_input_6 | false | Show new day |
| v_input_7 | 1900 | From Year |
| v_input_8 | 2100 | To Year |
| v_input_9 | true | From Month |
| v_input_10 | 12 | To Month |
| v_input_11 | true | From day |
| v_input_12 | 31 | To day |
Source (PineScript)
/*backtest
start: 2023-12-01 00:00:00
end: 2023-12-31 23:59:59
period: 1h
basePeriod: 15m
exchanges: [{"eid":"Futures_Binance","currency":"BTC_USDT"}]
*/

//Noro
//2019

//@version=3
strategy(title = "Noro's DEX Strategy", shorttitle = "DEX str", overlay = true, default_qty_type = strategy.percent_of_equity, default_qty_value = 100, pyramiding = 0)

//Settings
needlong = input(true, defval = true, title = "Long")
needshort = input(false, defval = false, title = "Short")
capital = input(100, defval = 100, minval = 1, maxval = 10000, title = "Lot")
showlines = input(true, title = "Show lines")
showbg = input(false, title = "Show background")
showday = input(false, title = "Show new day")
fromyear = input(1900, defval = 1900, minval = 1900, maxval = 2100, title = "From Year")
toyear = input(2100, defval = 2100, minval = 1900, maxval = 2100, title = "To Year")
frommonth = input(01, defval = 01, minval = 01, maxval = 12, title = "From Month")
tomonth = input(12, defval = 12, minval = 01, maxval = 12, title = "To Month")
fromday = input(01, defval = 01, minval = 01, maxval = 31, title = "From day")
today = input(31, defval = 31, minval = 01, maxval = 31, title = "To day")

//New day trand
bar = close > open ? 1 : close < open ? -1 : 0
newday = request.security(syminfo.tickerid, 'D', time)

//Lines
uplevel = request.security(syminfo.tickerid, 'D', high)
dnlevel = request.security(syminfo.tickerid, 'D', low)
upcolor = uplevel == uplevel[1] and showlines ? lime : na
dncolor = dnlevel == dnlevel[1] and showlines? red : na
plot(uplevel, offset = 1, linewidth = 2, color = upcolor)
plot(dnlevel, offset = 1, linewidth = 2, color = dncolor)

//Background
size = strategy.position_size
col = time == newday + 86400000 and showday ? blue : showbg and size > 0 ? lime : showbg and size < 0 ? red : na
bgcolor(col)

//Orders
lot = 0.0
lot := size != size[1] ? strategy.equity / close * capital / 100 : lot[1]
truetime = true
if uplevel > 0 and dnlevel > 0
    strategy.entry("Long", strategy.long, needlong ? lot : 0, stop = uplevel, when = truetime)
    strategy.entry("Close", strategy.short, needshort ? lot : 0, stop = dnlevel, when = truetime)
Detail
https://www.fmz.com/strategy/439740
Last Modified
2024-01-23 14:24:22
