Name
基于波浪通道和资金流指标的趋势跟踪策略WaveTrend-and-CMF-Based-Trend-Following-Strategy
Author
ChaoZhang
Strategy Description
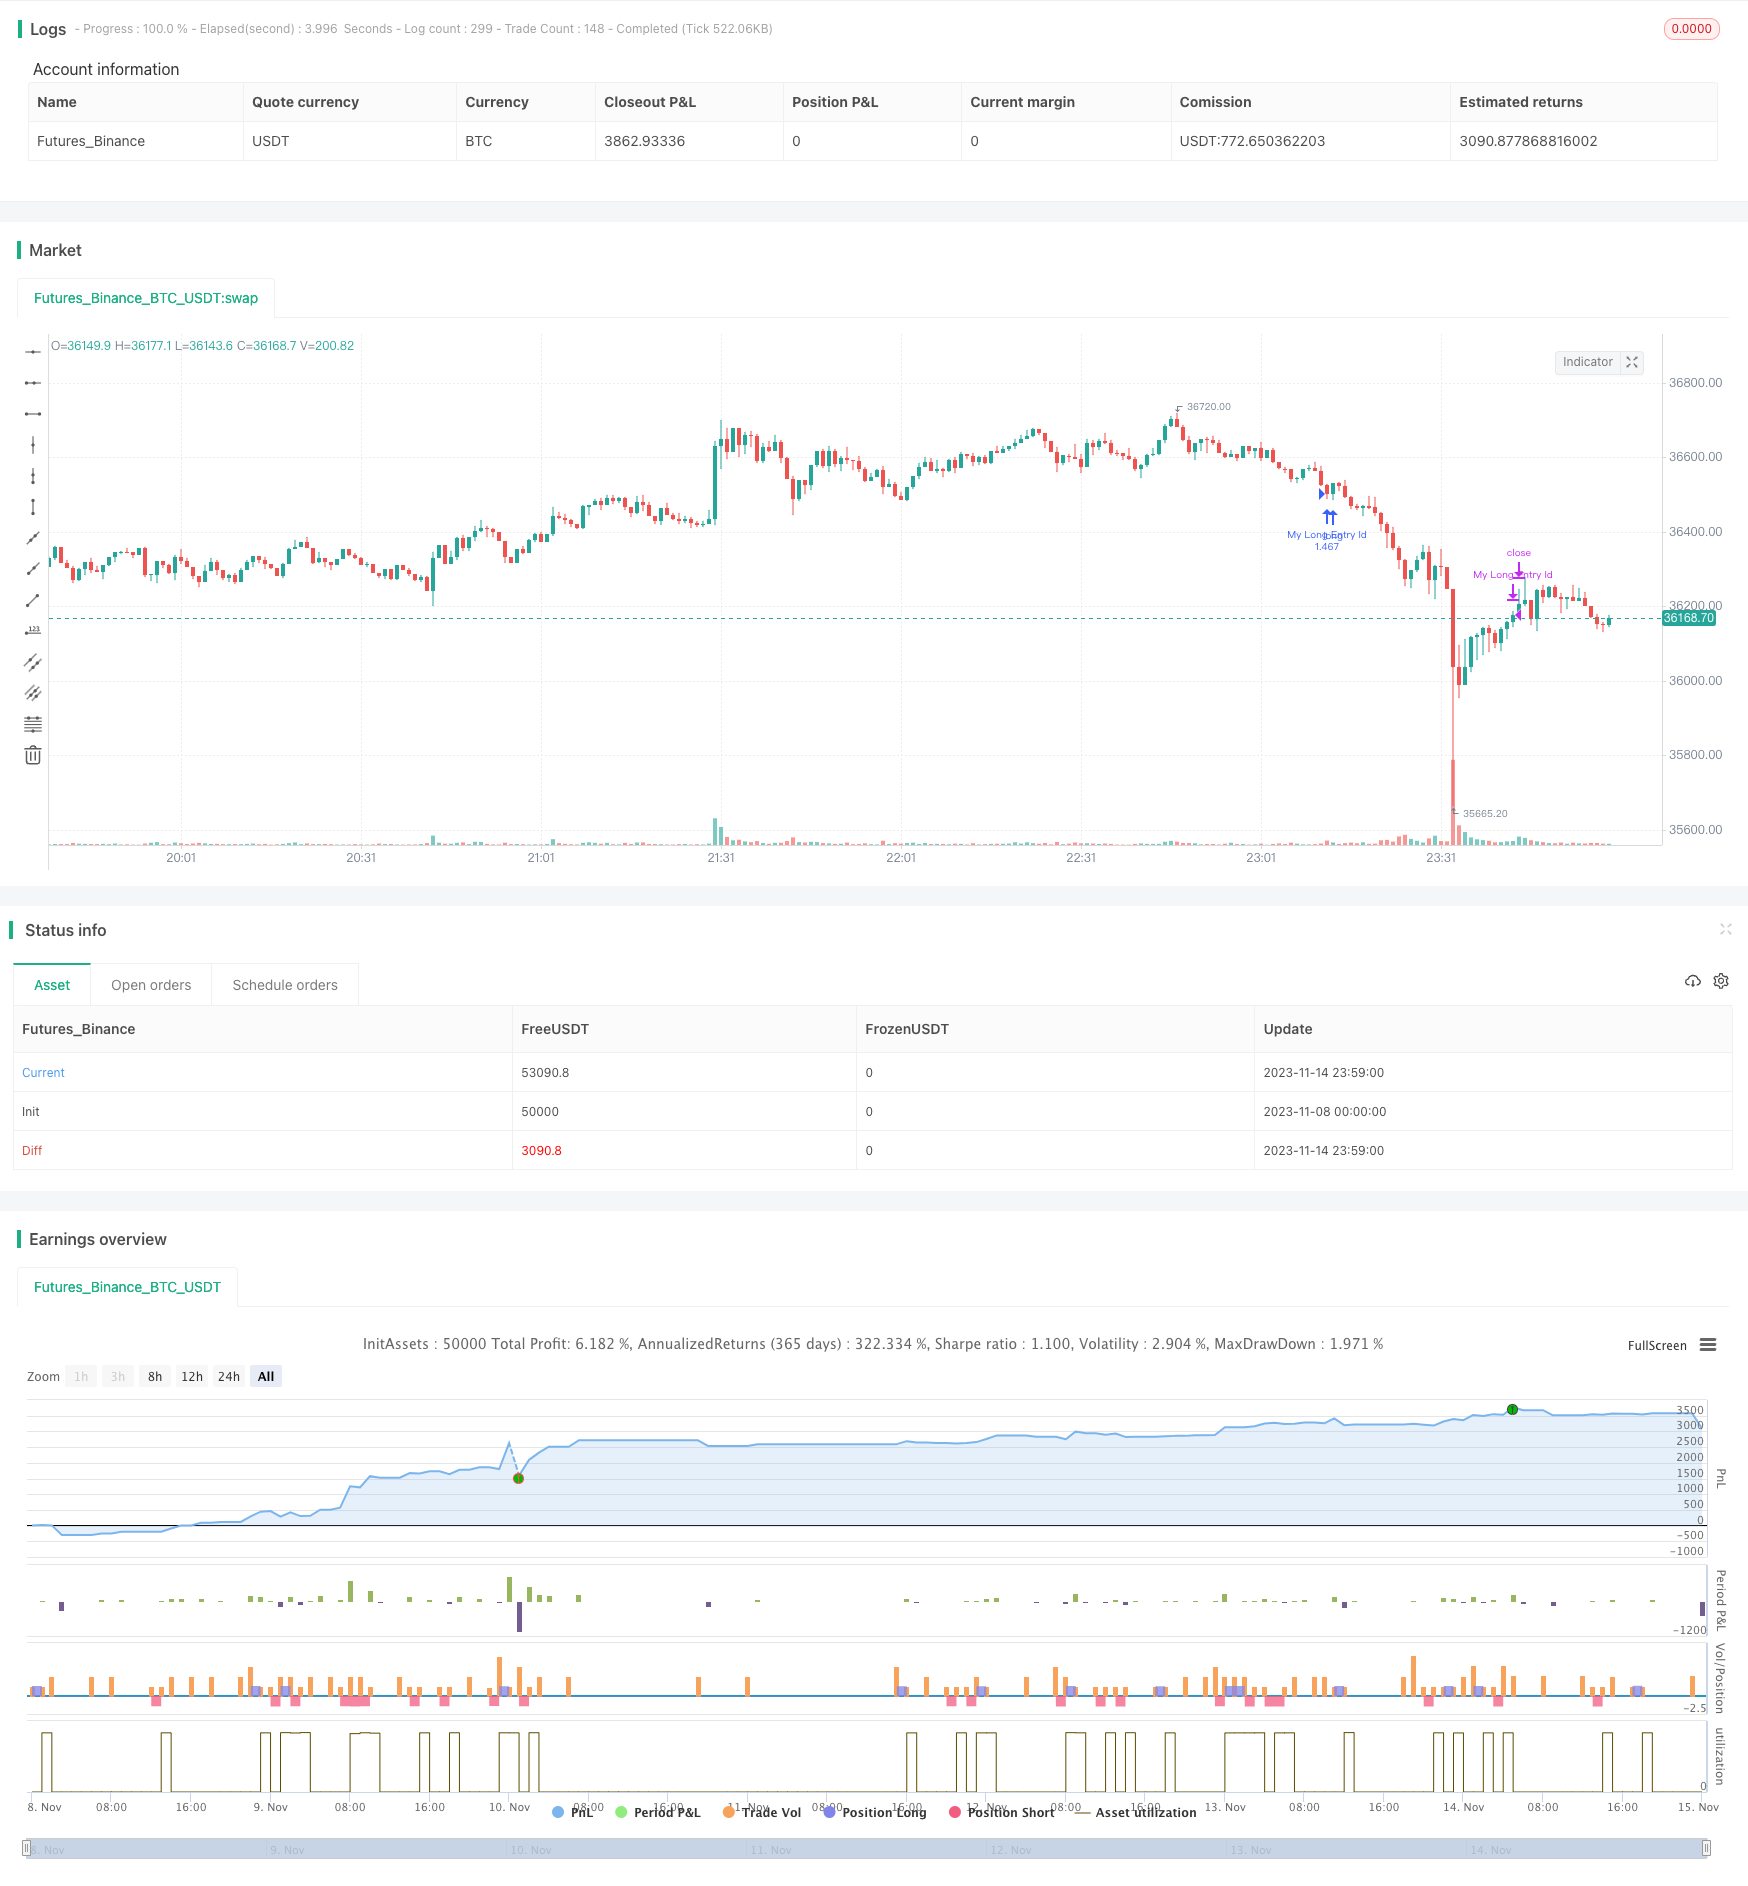
该策略采用波浪通道指标和资金流指标相结合的方式,识别趋势方向并进行趋势跟踪。策略以15分钟时间周期运行,通过波浪通道判断价格趋势方向,再利用资金流指标进行趋势确认,实现超短线的趋势追踪。
波浪通道指标(WaveTrend)可以有效识别价格的趋势方向。它由通道均线、通道均价和通道索引组成。通道均线是价格的指数移动平均线,反映价格趋势;通道均价是通道均线的移动平均,用来定位通道均线;通道索引则反映价格对通道均线的偏离程度,并给出超买超卖信号。
资金流指标(CMF)则可以判断资金的流入流出,确认趋势。该指标基于成交量调整后的积累/派发线,反映买卖双方力量对比。值在0附近表示资金流入流出平衡;低于0表示资金流出,高于0表示资金流入。
本策略以15分钟周期运行,通过波浪通道指标判断价格趋势方向后,再利用资金流指标进行确认,从而实现趋势的跟踪。具体来说,如果波浪通道指标通道索引低于-60同时资金流指标小于-0.2,则做多;如果波浪通道指标通道索引高于60同时资金流指标大于0.2,则做空。平仓条件则以资金流指标为主,多仓资金流指标大于0.18时平多仓,空仓资金流指标小于-0.18时平空仓。
- 波浪通道指标可有效判断价格趋势方向
- 资金流指标可确认趋势方向,避免错误交易
- 结合波浪通道和资金流指标,可实现超短线的趋势跟踪
- 15分钟周期运行,更适合短线操作
- 波浪通道指标在盘整期间可能产生错误信号
- 资金流指标可能滞后,错过趋势转折点
- 单一周期操作风险较大,应适当放宽持仓周期
- 缺乏止损策略,无法控制单笔损失
风险解决方法:
- 结合其他指标进行确认,避免错误信号
- 适当调整资金流指标参数,提高敏感性
- 可适当延长持仓周期,降低单一周期风险
- 增加移动止损、转仓止损等策略,控制损失
- 增加仓位数优化,让策略能更好跟踪趋势
- 增加止损策略,控制单笔损失
- 结合 stoch多空指标等,避免因单一指标出现错误信号
- 测试不同持仓时间,寻找最佳持仓周期
- 对资金流指标参数进行优化,找到最佳参数组合
该策略采用波浪通道指标判断趋势方向,和资金流指标进行确认,实现超短线的趋势跟踪操作。策略优势是指标组合合理,可有效跟踪趋势,且15分钟周期运行更适合短线操作。但也存在风险,比如指标信号不准、持仓时间过短等。未来可通过止损策略、参数优化、增加信号过滤等方式进一步优化,使策略的稳定性和收益率得到提升。
||
This strategy combines WaveTrend indicator and Chaikin Money Flow (CMF) indicator to identify trend direction and follow trends. It runs on 15-minute timeframe, using WaveTrend to determine price trend and CMF to confirm the trend, thus implementing ultra short-term trend following.
WaveTrend indicator can effectively identify the trend direction of prices. It consists of channel midline, channel average and channel index. The channel midline is an exponential moving average of price, reflecting price trend. The channel average is a moving average of channel midline, used to locate channel midline. The channel index reflects the degree of deviation of price from channel midline and generates overbought/oversold signals.
The CMF indicator can judge the inflow and outflow of funds and confirm trends. This indicator is based on the accumulation/distribution line adjusted by volume, reflecting the comparison of buying and selling power. A value around 0 indicates a balance between fund inflow and outflow. Below 0 indicates fund outflow and above 0 indicates fund inflow.
This strategy runs on 15-minute timeframe. It first uses WaveTrend indicator to determine price trend direction, then uses CMF indicator to confirm, so as to follow trends. Specifically, when WaveTrend channel index is below -60 and CMF is less than -0.2, it goes long. When WaveTrend channel index is above 60 and CMF is greater than 0.2, it goes short. The exit conditions are mainly based on CMF indicator - it closes long position when CMF is greater than 0.18, and closes short position when CMF is less than -0.18.
- WaveTrend indicator can effectively determine price trend direction.
- CMF indicator can confirm trend direction and avoid wrong trades.
- Combining WaveTrend and CMF can achieve ultra short-term trend following.
- 15-minute timeframe makes it more suitable for short-term trading.
- WaveTrend may generate wrong signals during consolidation.
- CMF may lag and miss trend turning points.
- Trading on single timeframe has higher risks, should expand holding period.
- Lack of stop loss strategy, unable to control single loss.
Solutions:
- Add other indicators for confirmation to avoid wrong signals.
- Adjust CMF parameters for higher sensitivity.
- Expand holding period to lower risks on single timeframe.
- Add moving stop loss, breakeven stop etc to control loss.
- Add position sizing for better trend following.
- Add stop loss strategy to limit single loss.
- Add indicators like stochastics to avoid errors from single indicator.
- Test different holding periods to find optimal.
- Optimize CMF parameters to find best combination.
This strategy uses WaveTrend to determine trend and CMF to confirm, for ultra short-term trend following. Its advantages lie in reasonable indicator combination and effective trend following, with 15-minute timeframe making it suitable for short-term trading. But risks exist such as inaccurate signals and overshort holding period. Future improvements like stop loss, parameter optimization and more signal filtering can further enhance its stability and profitability.
[/trans]
Strategy Arguments
| Argument | Default | Description |
|---|---|---|
| v_input_1 | 20 | Length |
| v_input_2 | 0 | Aggregation: SUM |
| v_input_3 | 10 | Volume Exponent (0-10 reduces & 10+ increases volume effect) |
| v_input_4 | false | Show in Percentage |
| v_input_5 | false | Factor in Price (Money Volume) |
| v_input_6_hlc3 | 0 | Source for price factor: hlc3 |
| v_input_7 | 10 | Channel Length |
| v_input_8 | 21 | Average Length |
| v_input_9 | 60 | Over Bought Level 1 |
| v_input_10 | 53 | Over Bought Level 2 |
| v_input_11 | -60 | Over Sold Level 1 |
| v_input_12 | -53 | Over Sold Level 2 |
Source (PineScript)
/*backtest
start: 2023-11-08 00:00:00
end: 2023-11-15 00:00:00
period: 1m
basePeriod: 1m
exchanges: [{"eid":"Futures_Binance","currency":"BTC_USDT"}]
*/

//@version=3
strategy(title = "CMF - WaveTrend", shorttitle = "CMF - WaveTrend", overlay = true, pyramiding = 0, default_qty_type = strategy.percent_of_equity, default_qty_value = 100, currency = currency.EUR)

//Chaikin Money Flow

len = input(20, minval=1, title="Length")
mas = input(title="Aggregation", defval="SUM", options=["SUM", "EMA", "WMA"])
e = input(10.0, title="Volume Exponent (0-10 reduces & 10+ increases volume effect)")
p = input(false, title="Show in Percentage")
mvs = input(false, "Factor in Price (Money Volume)")
src=input(hlc3, title="Source for price factor")

trl = min(low,close[1]), trh = max(high,close[1]) // 'true range' fixes issues caused by gaps in price
wv = pow(volume,e/10.0)*(mvs ? src : 1)
ad = (trh==trl ? 0 : (2*close-(trh+trl))/tr(true))*wv
cmf = mas=="SUM" ? sum(ad, len)/sum(wv, len) : mas=="EMA" ? ema(ad, len)/ema(wv, len) : mas=="WMA" ? wma(ad, len)/wma(wv, len) : na
cmf_p  = if p
    50*cmf+50
else
    cmf
b = p ? 50 : 0


//WaveTrend
n1 = input(10, "Channel Length")
n2 = input(21, "Average Length")
obLevel1 = input(60, "Over Bought Level 1")
obLevel2 = input(53, "Over Bought Level 2")
osLevel1 = input(-60, "Over Sold Level 1")
osLevel2 = input(-53, "Over Sold Level 2")

ap = hlc3
esa = ema(ap, n1)
d = ema(abs(ap - esa), n1)
ci = (ap - esa) / (0.015 * d)
tci = ema(ci, n2)

wt1 = tci
wt2 = sma(wt1,4)
//


longCondition = wt1 < -60 and cmf < - 0.20
if (longCondition)

    strategy.entry("My Long Entry Id", strategy.long)


shortCondition = wt1 > 60 and cmf > 0.20
if (shortCondition)

    strategy.entry("My Short Entry Id", strategy.short)

closeLongCondition = cmf_p > 0.18 ? true : false
closeShortCondition = cmf_p < -0.18 ? true : false


strategy.close("My Long Entry Id", when=(closeLongCondition == true))
strategy.close("My Short Entry Id", when=(closeShortCondition == true))
Detail
https://www.fmz.com/strategy/432343
Last Modified
2023-11-16 16:38:03
