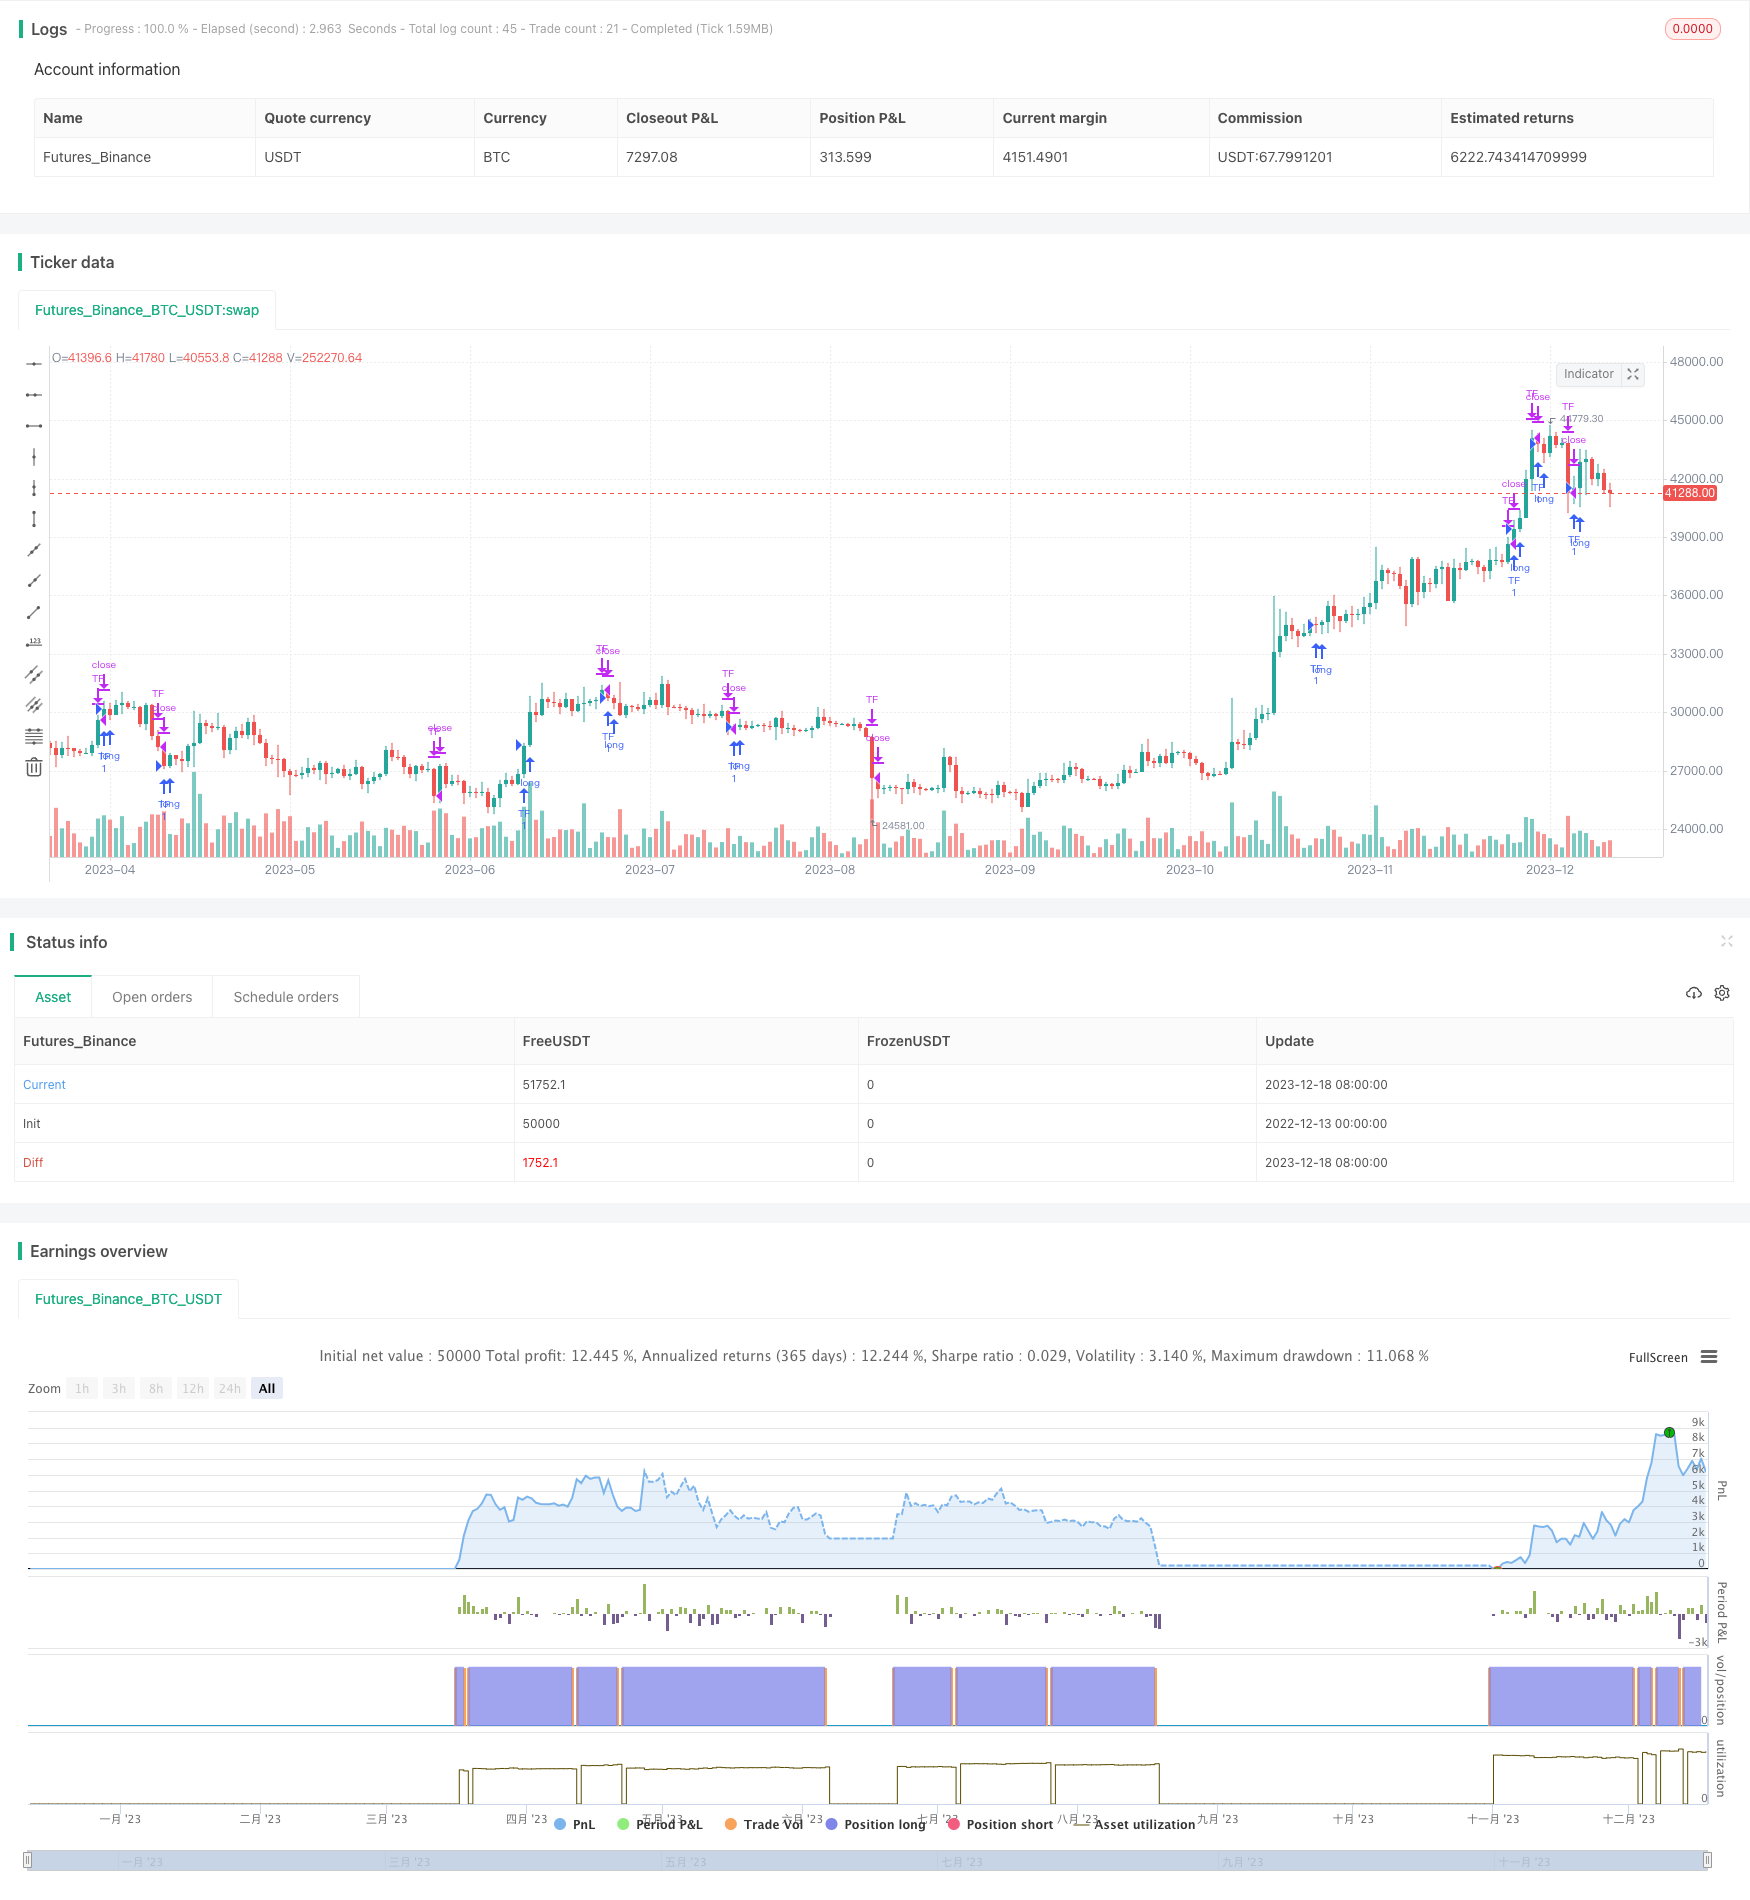
Name
基于移动平均线的趋势追踪策略Trend-Following-Strategy-Based-on-Moving-Average
Author
ChaoZhang
Strategy Description
该策略根据马克·米内维尼的股票选股模板,结合移动平均线指标判断股价趋势,实现自动买入和止损。策略主要判断股价是否处于上涨趋势,以及是否突破关键的移动平均线,从而产生买入信号。同时,策略设置了止损线,当股价出现回撤时主动止损。
该策略主要判断以下条件,当条件同时满足时产生买入信号:
- 当前股价高于150日和200日移动平均线
- 150日移动平均线高于200日移动平均线
- 200日移动平均线最近1个月处于上涨趋势
- 50日移动平均线高于150日和200日移动平均线
- 当前股价高于50日移动平均线
- 当前股价较52周最低价上涨25%以上
- 当前股价接近52周最高价
当上述条件满足时,策略判断股价处于上涨阶段,产生买入信号。
此外,策略同时设置了止损线,当股价从最高点回撤5%或上涨10%时,进行止损或止盈。
- 使用马克·米内维尼的股票选股思路,提高获利概率
- 运用多重移动平均线确认趋势,避免错过买点
- 设置止损机制规避大额亏损
- 股价短期内可能出现调整,导致止损被触发
- 移动平均线并不能完全判断趋势,可能出现假突破
- 设置止损止盈比例并不完美,可能过早止盈或亏损扩大
- 可以测试不同参数的移动平均线组合
- 可以加入其他技术指标判断买入时机
- 可以优化止损止盈的比例设置
该策略整体遵循趋势交易的思路,在确认股价上涨趋势的前提下产生买入信号。同时设置止损机制控制风险。通过优化各项细节参数,可以进一步提高策略的稳定性和盈利能力。但任何策略都难以完全规避市场风险,需要投资者谨慎对待。
||
This strategy uses Mark Minervini’s stock selection template and moving average indicators to determine price trends for automated entry and stop-loss. It mainly judges whether stock prices are in an uptrend and whether they have broken through key moving averages to generate buy signals. At the same time, the strategy sets a stop-loss line to actively stop losses when prices fall back.
The strategy mainly judges the following conditions and generates a buy signal when they are met at the same time:
- The current stock price is above both the 150-day and 200-day moving average lines.
- The 150-day moving average is above the 200-day moving average.
- The 200-day moving average has been trending up for at least 1 month.
- The 50-day moving average is above both the 150-day and 200-day moving averages.
- The current stock price is above the 50-day moving average.
- The current stock price is at least 25% above its 52-week low.
- The current stock price is within at least 25% of its 52-week high.
When the above conditions are met, the strategy judges that the stock price is in an upward trend and generates a buy signal.
In addition, the strategy also sets a stop-loss line. When the stock price falls back by 5% from its peak or rises by 10%, it will stop loss or take profit.
- Use Mark Minervini's stock selection ideas to improve profitability.
- Use multiple moving averages to confirm the trend and avoid missing buying points.
- Set stop-loss mechanism to avoid huge losses.
- Stock prices may adjust in the short term, triggering a stop loss.
- Moving averages cannot fully determine trends, and false breakouts may occur.
- The stop loss and take profit ratios set are not perfect, may take profits or expand losses prematurely.
- Test combinations of moving averages with different parameters.
- Add other technical indicators to determine entry timing.
- Optimize stop loss and take profit ratio settings.
The strategy overall follows the idea of trend trading, generating buy signals when the uptrend of stock prices is confirmed. At the same time, a stop-loss mechanism is set to control risks. By optimizing various detailed parameters, the stability and profitability of the strategy can be further improved. However, no strategy can completely avoid market risks, so investors need to treat it cautiously.
[/trans]
Strategy Arguments
| Argument | Default | Description |
|---|---|---|
| v_input_1 | 260 | High Lookback Length |
| v_input_2 | 260 | Low Lookback Length |
Source (PineScript)
/*backtest
start: 2022-12-13 00:00:00
end: 2023-12-19 00:00:00
period: 1d
basePeriod: 1h
exchanges: [{"eid":"Futures_Binance","currency":"BTC_USDT"}]
*/

//@version=4
strategy(title="Pure Mark Minervini 10%TP 5%CL", pyramiding = 0, commission_type=strategy.commission.percent, commission_value=0.08, overlay=true)

ma50 = sma(close,50)
ma150 = sma(close,150)
ma200 = sma(close,200)
ma200_22 = ma200[22]

high_loopback = input(260, "High Lookback Length")
low_loopback = input(260, "Low Lookback Length")
highest_price = highest(high, high_loopback)
lowest_price = lowest(low, low_loopback)
above52lo = ((close/lowest_price)-1)*100
below52hi = (1-(close/highest_price))*100
ep = strategy.position_avg_price

trigger = close>ma150 and close>ma200 and ma150>ma200 and ma200>ma200_22 and ma50>ma150 and ma50>ma200 and close>ma50 and above52lo>=25 and below52hi<=25 and close>0.3
var label maLabel = na
if (trigger)
    yLocation = close>ma150 and close>ma200 and ma150>ma200 and ma200>ma200_22 and ma50>ma150 and ma50>ma200 and close>ma50 and above52lo>=25 and below52hi<=25 and close>0.3 ?
         yloc.abovebar :
         yloc.belowbar

    // labelStyle = close>ma150 and close>ma200 and ma150>ma200 and ma200>ma200_22 and ma50>ma150 and ma50>ma200 and close>ma50 and above52lo>=25 and below52hi<=25 and close>0.3 ?
    //      label.style_labeldown :
    //      label.style_labelup

buy = close>ma150 and close>ma200 and ma150>ma200 and ma200>ma200_22 and ma50>ma150 and ma50>ma200 and close>ma50 and above52lo>=25 and below52hi<=25 and close>0.3
sell = close>ep*1.1 or close<ep*0.95

strategy.entry("TF", strategy.long, when = buy)
strategy.close("TF", when = sell)
Detail
https://www.fmz.com/strategy/435962
Last Modified
2023-12-20 14:23:49
