Name
基于移动快慢均线交叉策略Moving-Average-Crossover-Strategy
Author
ChaoZhang
Strategy Description
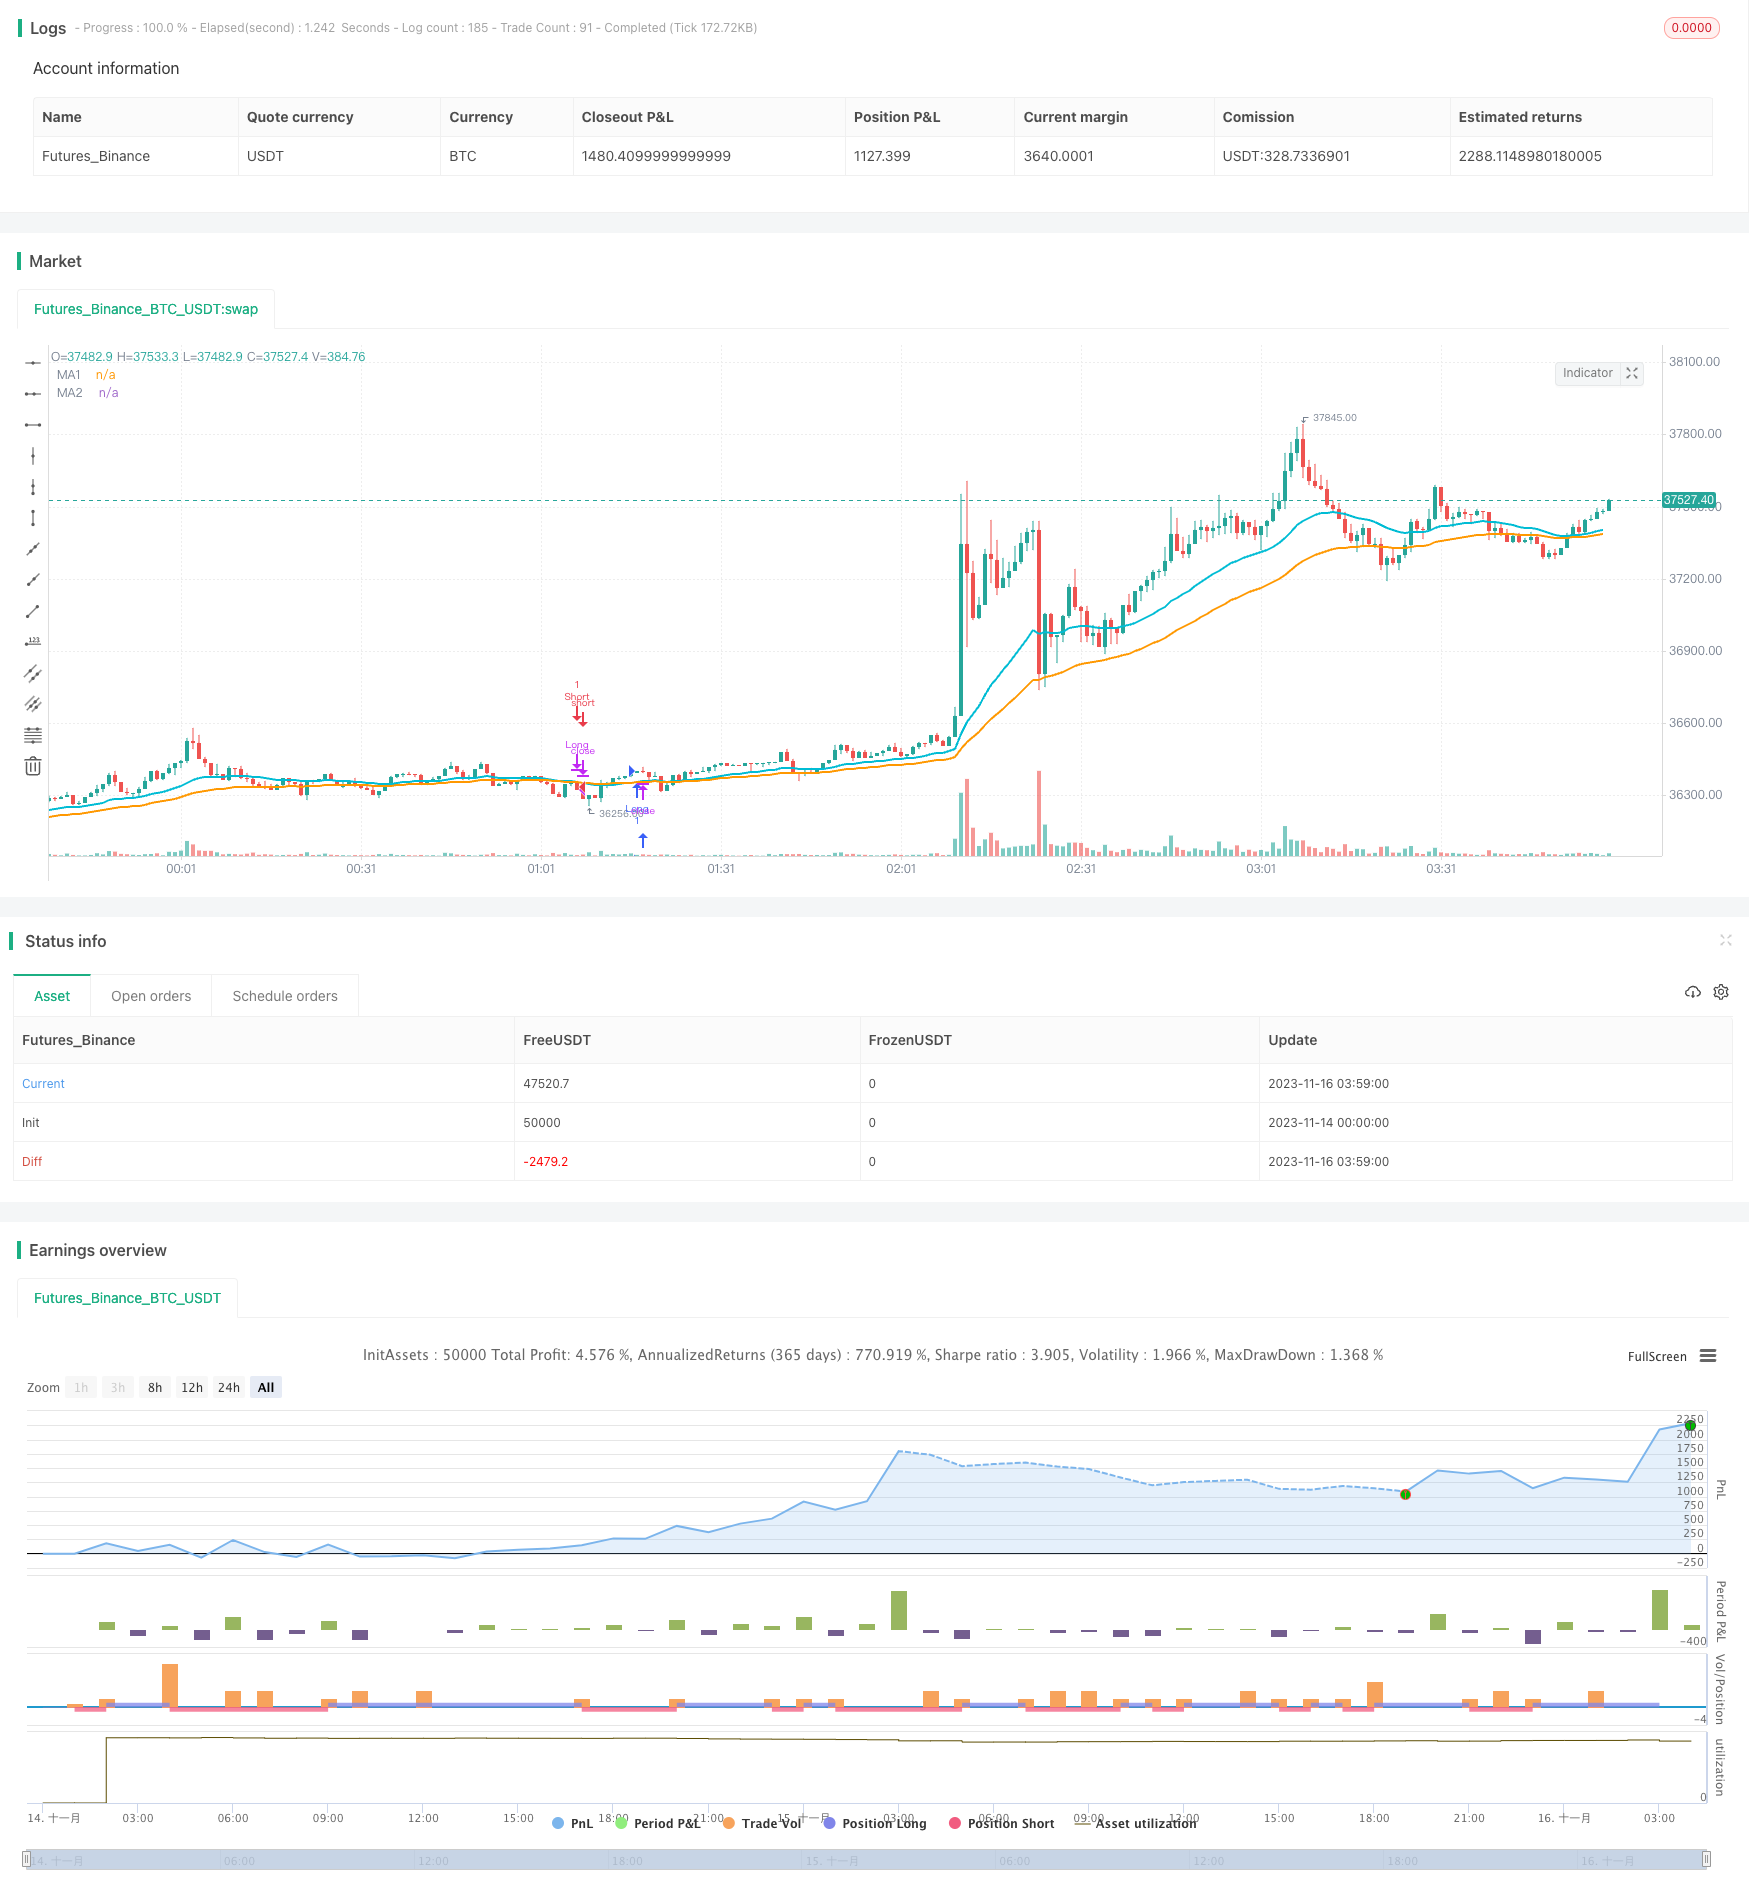
移动平均线交叉策略是一种基于移动平均线的简单有效的量化交易策略。该策略利用快速移动平均线和慢速移动平均线的交叉作为买入和卖出信号。当快线从下方向上突破慢线时,产生买入信号;当快线从上方向下跌破慢线时,产生卖出信号。
该策略的核心逻辑在于利用移动平均线来判断市场趋势。移动平均线本身就具有滤波随机市场噪音的功能。快速移动平均线能较快地响应价格变化,反映最新趋势;而慢速移动平均线对最新价格变化响应较慢,代表着中长期趋势。快线突破慢线意味着短期趋势反转到与中长期一致,因此产生交易信号。
具体来说,该策略首先定义快速移动平均线sig1和慢速移动平均线sig2。然后根据sig1和sig2的交叉关系判断买卖点。当sig1从下方突破sig2时产生买入信号longCondition;当sig1从上方向下跌破sig2时产生卖出信号shortCondition。策略接着在满足买入和卖出条件时下单,并设置止损和止盈退出订单。
该策略优势显著:
- 逻辑简单,容易理解和实现
- 参数调整灵活,不同市场条件下可调优
- 可结合其他指标过滤信号,提高稳定性
- 绩效良好,举例EMA15-EMA30组合在EURCHF日线数据上获胜率可达83%
该策略也存在一定风险:
- whipsaw效应严重,止损设置很重要
- 大盘震荡行情效果不佳
- 需要反复测试调参才能适应不同品种和周期
优化措施:
- 增加其他指标判断,避免whipsaw
- 调整移动平均线类型和参数,适应不同品种
- 优化止损止盈比例,控制风险
移动平均线交叉策略整体而言是一种逻辑简单、实用性强的量化策略。通过参数调优和适当优化,能够在多种市场环境下稳定盈利。值得量化交易者重点研究和应用。
||
The moving average crossover strategy is a simple yet effective quantitative trading strategy based on moving averages. It uses the crossover of a fast moving average line and a slow moving average line to generate buy and sell signals. When the fast line breaks through the slow line from below, a buy signal is generated. When the fast line breaks down through the slow line from above, a sell signal is generated.
The core logic of this strategy lies in using moving averages to judge market trends. Moving averages themselves have the functionality of filtering out random market noise. The fast moving average can respond to price changes faster and reflect the latest trends, while the slow moving average responds slower to the latest price changes and represents medium to long term trends. The breakthrough of the fast line through the slow line means that the short-term trend has reversed to be consistent with the medium-long term trend, thus generating trading signals.
Specifically, this strategy first defines the fast moving average sig1 and the slow moving average sig2. Then, buy and sell points are determined according to the crossover relationships between sig1 and sig2. When sig1 breaks through sig2 from below, a long condition longCondition is generated. When sig1 breaks down through sig2 from above, a short condition shortCondition is generated. The strategy then places orders when long and short conditions are met, and sets stop loss and take profit to exit orders.
The advantages of this strategy are significant:
- Simple logic, easy to understand and implement
- Flexible parameter tuning, can be optimized under different market conditions
- Can be combined with other indicators to filter signals and improve stability
- Good performance, for example the EMA15-EMA30 combo can achieve 83% win rate on the EURCHF daily data
There are also some risks with this strategy:
- Severe whipsaw effects, stop loss configuration is crucial
- Poor performance in ranging, sideways markets
- Requires extensive testing and parameter tuning to fit different products and timeframes
Optimization measures:
- Add other indicators for judgement to avoid whipsaws
- Adjust MA types and parameters to suit different products
- Optimize stop loss and take profit ratios to control risks
In general, the moving average crossover strategy is a quant strategy with simple logic, strong practicality and stability. With parameter tuning and proper optimizations, it can generate steady profits in various market environments. Worth focusing on and applying for quantitative traders.
[/trans]
Strategy Arguments
| Argument | Default | Description |
|---|---|---|
| v_input_1 | 2016 | Starting year to analyse |
| v_input_2_close | 0 | Source: close |
| v_input_3 | 0 | MA Type: EMA |
| v_input_4 | false | Is JPY or XAU involved? |
| v_input_5 | 26 | MA fast period |
| v_input_6 | 51 | MA slow period |
| v_input_7 | 14 | ATR period |
| v_input_8 | 1.5 | SL ATR multiplicator |
| v_input_9 | true | TP ATR multiplicator |
Source (PineScript)
/*backtest
start: 2023-11-14 00:00:00
end: 2023-11-16 04:00:00
period: 1m
basePeriod: 1m
exchanges: [{"eid":"Futures_Binance","currency":"BTC_USDT"}]
*/

//@version=3
// Simple yet effective MA cross strategy.
// You'll have to tune the parameters to get an optimal win ratio.
// If JPY or XAU or any other currency with pips defined as the
// second decimal digit are involved, do not forget to set the respective flag on.
//
// Created by vitelot/yanez/Vts, who's the same fellow with different user names
// December 2018 -- Merry Xmas
//
strategy("MA cross strategy Vts", overlay=true, initial_capital=1000, currency="EUR", pyramiding=0)

yr  = input(2016, title="Starting year to analyse")
src = input(close, title="Source")
maType = input( defval="EMA", title="MA Type", options=["SMA","EMA","HMA","McG","WMA"])
//
isJPY = input(false, title="Is JPY or XAU involved?") // JPY and Gold have the pips defined as the 2 decimal digit

maPar1 = input(26, minval=1, title="MA fast period")
maPar2 = input(51, minval=2, title="MA slow period")

atrPar = input(14,minval=1, title="ATR period")
atrMulSL = input(1.5, title="SL ATR multiplicator")
atrMulTP = input(1.0, title="TP ATR multiplicator")

hma(sig, n) => // Hull moving average definition
    wma( 2*wma(sig,round(n/2))-wma(sig,n), round(sqrt(n)))

mcg(sig,length) => // Mc Ginley MA definition
    mg = 0.0
    mg := na(mg[1]) ? ema(sig, length) : mg[1] + (sig - mg[1]) / (length * pow(sig/mg[1], 4))

ma(t,sig,len) =>
    if t =="SMA"
        sma(sig,len)
    else
        if t == "EMA"
            ema(sig,len)
        else
            if t == "HMA"
                hma(sig,len)
            else
                if t == "McG" // Mc Ginley
                    mcg(sig,len)
                else
                    wma(sig,len)


sig1 = ma(maType, src, maPar1)
sig2 = ma(maType, src, maPar2)

tickFactor = isJPY? 1e3: 1e5
sl = atrMulSL*atr(atrPar)*tickFactor
tp = atrMulTP*atr(atrPar)*tickFactor

plot(sig1, color=aqua, title="MA1", linewidth=2)
plot(sig2, color=orange, title="MA2", linewidth=2)

longCondition = crossunder(sig2, sig1) and year>=yr // change the >= to == if you like exact years not a range
if (longCondition)
    strategy.entry("Long", strategy.long, qty=1) // exit trade when SL and TP are hit
    strategy.exit("Exit Long", "Long", loss=sl, profit=tp)
if (crossunder(sig1, sig2)) // or when the short condition is met
    strategy.close("Long")

shortCondition = crossover(sig2,sig1) and year>=yr // change the >= to == if you like exact years not a range
if (shortCondition)
    strategy.entry("Short", strategy.short, qty=1)
    strategy.exit("Exit Short", "Short", loss=sl, profit=tp)
if (crossover(sig1,sig2))
    strategy.close("Short")
Detail
https://www.fmz.com/strategy/432913
Last Modified
2023-11-22 16:38:26
