Name
基于线性回归RSI的量化交易策略Quantitative-Trading-Strategy-Based-on-Linear-Regression-RSI
Author
ChaoZhang
Strategy Description
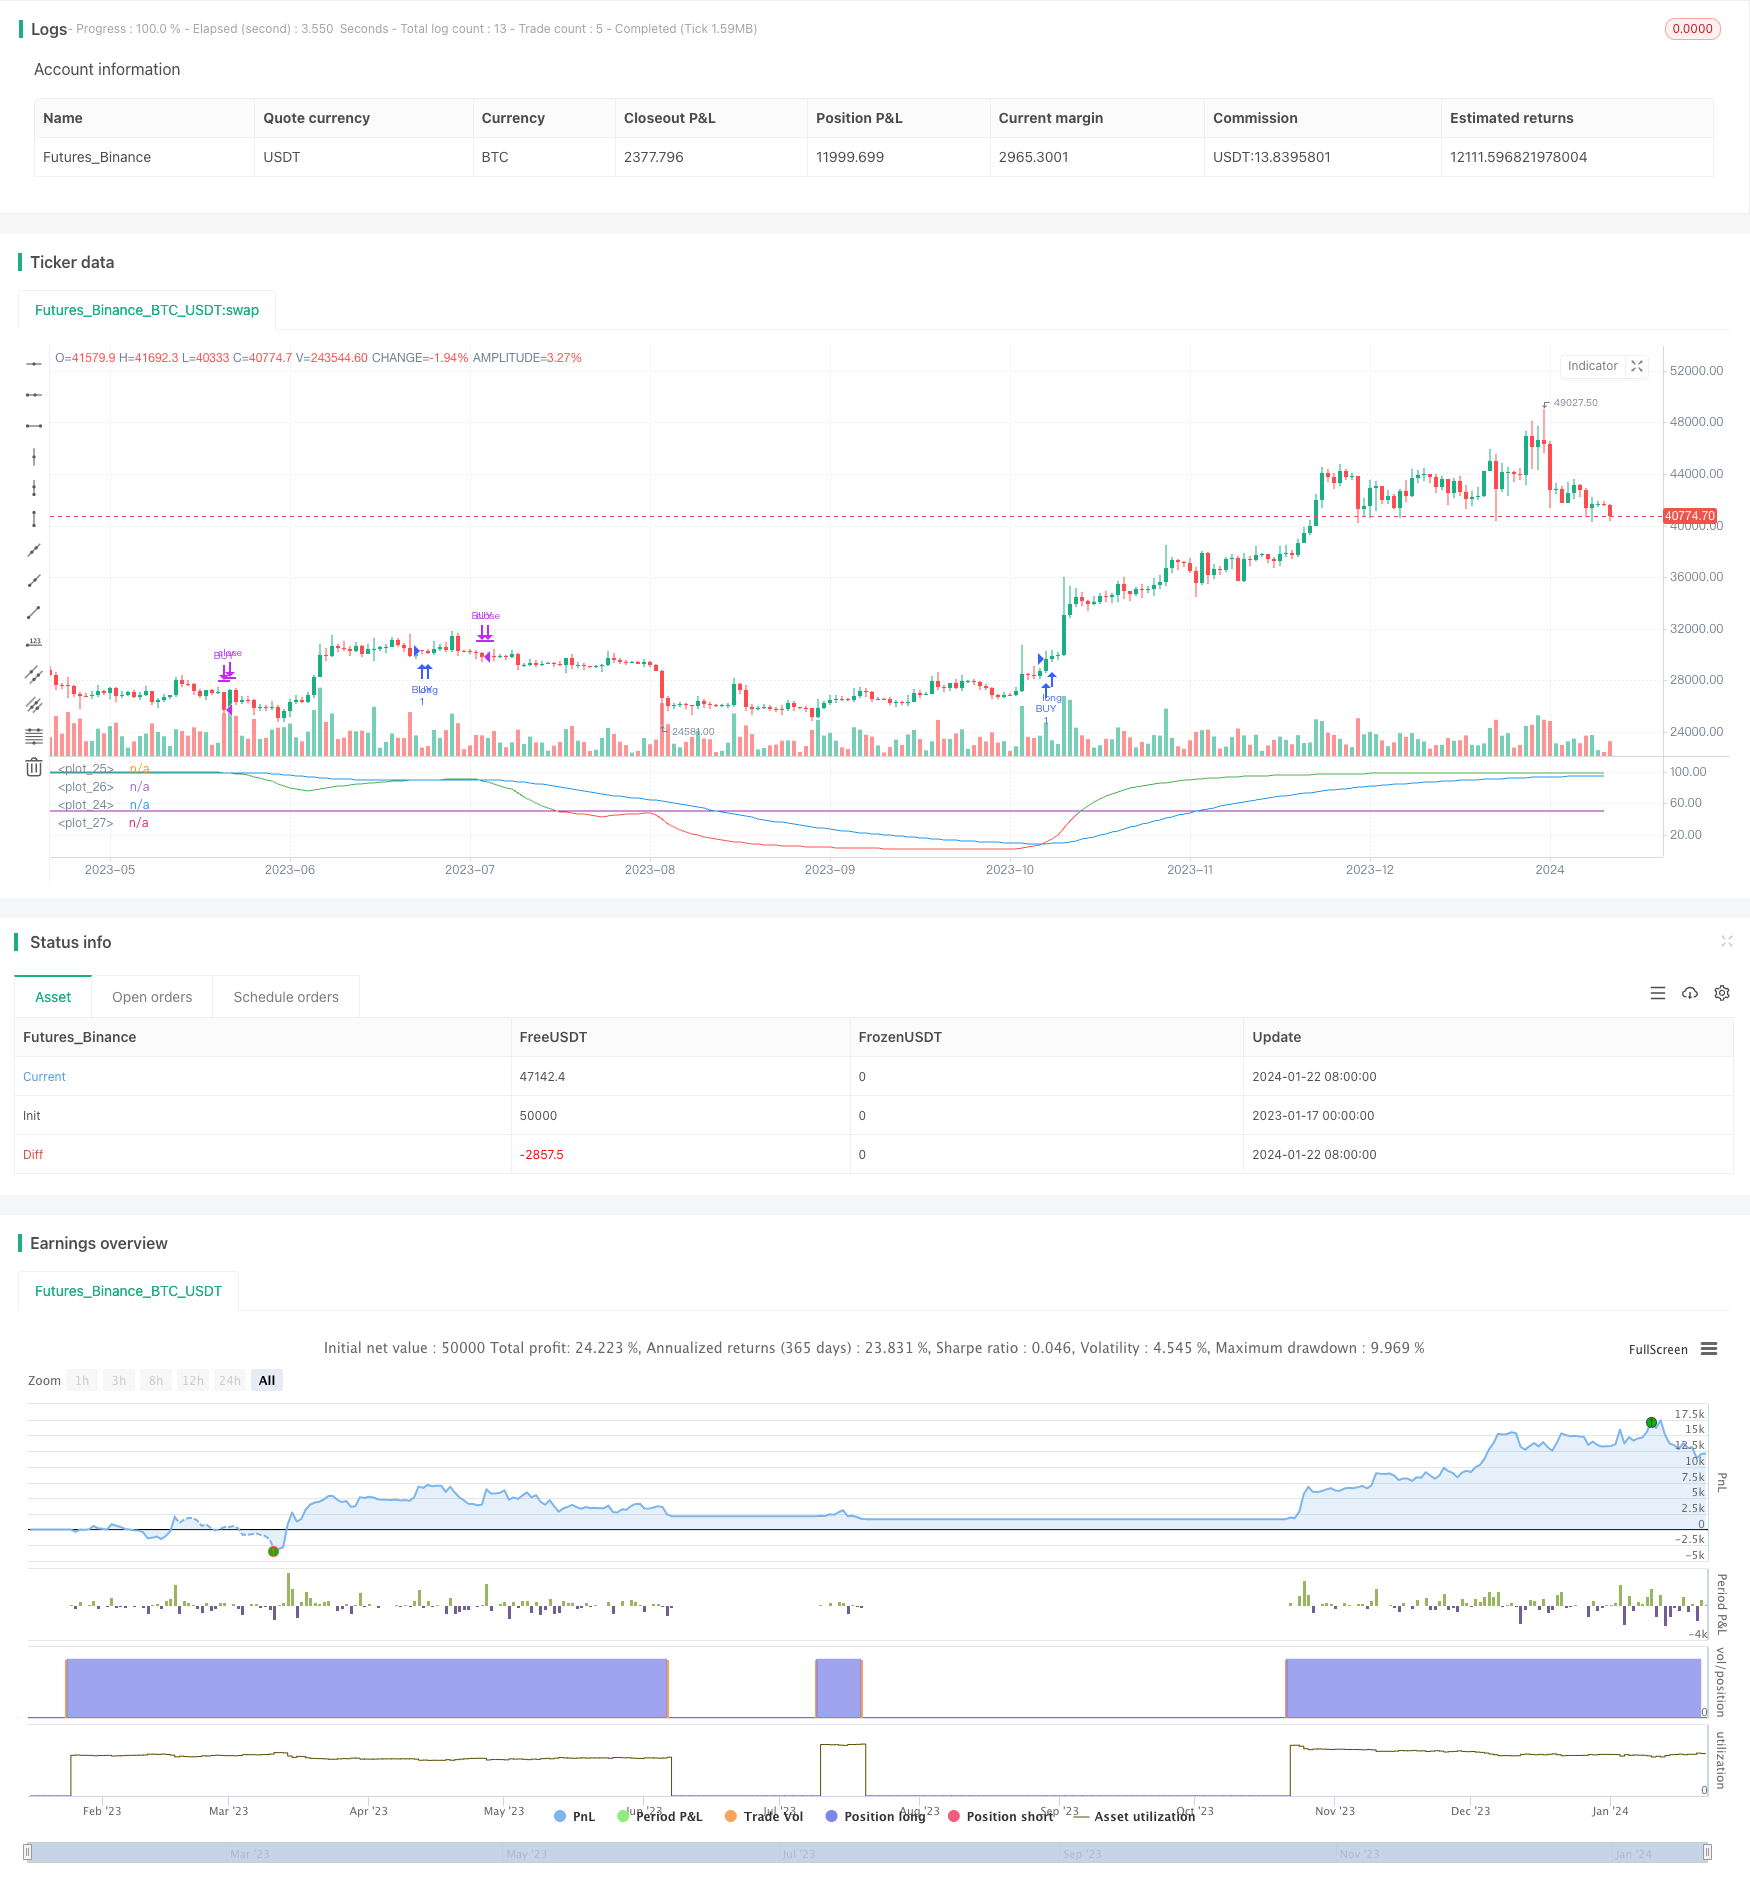
该策略基于线性回归RSI指标设计。策略通过计算线性回归RSI和EMA的交叉来产生买入和卖出信号。该策略同时提供两种买入逻辑选择,可以根据需要选用。
策略首先计算长度为200周期的线性回归,然后基于线性回归结果计算21周期的RSI。之后计算长度为50周期的EMA。当RSI上穿EMA时产生买入信号,当RSI下穿EMA时产生卖出信号,实现获利了结。
该策略提供两种买入逻辑:
- RSI上穿EMA时买入
- RSI高于EMA并且高于超买线时买入
可以根据市场情况选择使用哪种买入逻辑。
该策略结合了线性回归RSI和EMA的优点,可以有效滤除价格的部分噪音,产生更可靠的交易信号。
线性回归RSI能够更好地体现趋势,EMA有助于发现转折点。两者的组合可以在趋势中寻找反转机会,形成mean reversion策略。
该策略提供两种买入逻辑可选,可以根据市场阶段更灵活地调整。例如趋势明显时可以选择第一种逻辑,震荡时可以选择第二种。
该策略主要依赖于RSI和EMA的关系,如果两者之间关系发生改变,会导致交易信号产生错误。这是主要的风险点。
此外,RSI和EMA作为指标本身也会存在一定的滞后,可能导致买入和卖出出现一定程度的延迟,无法完美地捕捉转折点。这也会带来一定程度的实际风险。
为降低风险,可以适当调整RSI和EMA的长度参数,优化两者之间的配合。此外交易单元也要适量把控,避免单笔损失过大。
该策略可以从以下几个方向进行优化:
- 优化线性回归RSI和EMA的长度参数,找到最佳参数组合
- 添加其他指标过滤,如MACD、布林带等,提高信号质量
- 结合波动率指标,调整仓位管理
- 利用机器学习方法自动优化参数
本策略基于线性回归RSI和EMA设计了一个mean reversion策略,通过RSI和EMA的交叉来寻找盘整范围内的反转机会。该策略同时提供两种买入逻辑可供选择,可以灵活应对不同市场情况。总体来说,该策略结合了多个指标的优势,可以有效发现反转机会。通过参数优化和其他指标的辅助过滤,该策略可以获得更好的绩效表现。
||
This strategy is designed based on the linear regression RSI indicator. It generates buy and sell signals by calculating the crossover between the linear regression RSI and EMA. The strategy also provides two options for the buy logic that can be selected as needed.
The strategy first calculates a 200-period linear regression, then computes a 21-period RSI based on the linear regression result. After that, a 50-period EMA is calculated. When the RSI crosses above the EMA, a buy signal is generated. When the RSI crosses below the EMA, a sell signal is triggered to close the position.
The strategy offers two types of buy logic:
- Buy when RSI crosses above EMA
- Buy when RSI is above EMA and also above the overbought line
The appropriate buy logic can be selected based on market conditions.
This strategy combines the strengths of both linear regression RSI and EMA, which effectively filters out some price noise and generates more reliable trading signals.
The linear regression RSI better captures the trend, and the EMA helps identify turning points. The combination of the two can find mean reversion opportunities within trends.
The strategy provides two optional buy logics for more flexibility to adapt to different market stages. For example, the first logic can be used in strong trends, while the second logic fits better for ranging markets.
The main risk of this strategy lies in the potential change of relationship between the RSI and EMA, which may lead to incorrect trade signals.
In addition, the lagging nature of RSI and EMA as indicators can also cause certain delays in entries and exits, failing to perfectly capture turning points. This introduces some degree of practical risks.
To mitigate the risks, parameters like the lengths of RSI and EMA may be optimized for better coordination between the two. Also, proper position sizing is necessary to limit losses on single trades.
The strategy can be improved from the following aspects:
- Optimize lengths of linear regression RSI and EMA to find best parameter combinations
- Add other indicators like MACD, Bollinger Bands etc. for signal quality enhancement
- Incorporate volatility metrics to adjust position sizing
- Utilize machine learning techniques to automatically optimize parameters
This strategy designs a mean reversion strategy based on linear regression RSI and EMA, identifying reversal opportunities within ranges by looking at RSI-EMA crosses. It also provides two optional buy logics for flexibility to adapt to varying markets. Overall, by combining multiple indicators, the strategy can effectively discover reversal chances. With parameter tuning and additional filters, it has the potential for better performance.
[/trans]
Strategy Arguments
| Argument | Default | Description |
|---|---|---|
| v_input_1 | 2017 | Start Year |
| v_input_2 | 12 | Month |
| v_input_3 | 17 | Day |
| v_input_4 | 9999 | End Year |
| v_input_5 | true | Month |
| v_input_6 | true | Day |
| v_input_7 | 200 | LR length |
| v_input_8 | 21 | RSI length |
| v_input_9 | 50 | EMA |
| v_input_10 | 50 | overBought |
| v_input_11 | 50 | overSold |
| v_input_12 | true | Use first logic? |
| v_input_13 | false | Use second logic? |
Source (PineScript)
/*backtest
start: 2023-01-17 00:00:00
end: 2024-01-23 00:00:00
period: 1d
basePeriod: 1h
exchanges: [{"eid":"Futures_Binance","currency":"BTC_USDT"}]
*/

//@version=4
strategy("Linear RSI")

startP = timestamp(input(2017, "Start Year"), input(12, "Month"), input(17, "Day"), 0, 0)
end   = timestamp(input(9999, "End Year"),   input(1, "Month"),   input(1, "Day"),   0, 0)
_testPeriod() => true

//inputs
length = input(defval=200, minval=1, title="LR length")
length2 = input(defval=21, minval=1, title="RSI length")
ema_fast = input(defval=50, minval=1, title="EMA")
lag = 0

overBought = input(50)
overSold = input(50)


//rsi
src = close
Lr = linreg(src, length, lag)
rsi = rsi(Lr, length2)
ema = ema(rsi, ema_fast)

plot(rsi, color = rsi > overBought ? color.green : rsi < overSold ? color.red : color.silver)
plot(overBought, color=color.purple)
plot(overSold, color=color.purple)
plot(ema, color=color.blue)

first_type = input(true, title="Use first logic?")
second_type =  input(false, title="Use second logic?")

long_condition = (first_type ? crossover(rsi, ema) and _testPeriod() : false) or (second_type ? rsi > ema and rsi > overBought and _testPeriod() : false)
strategy.entry('BUY', strategy.long, when=long_condition)

short_condition = crossunder(rsi, ema)
strategy.close('BUY', when=short_condition)
Detail
https://www.fmz.com/strategy/439839
Last Modified
2024-01-24 11:35:19
