Name
基于超级趋势的以太坊交易策略SuperTrend-Strategy-for-Ethereum-Trading
Author
ChaoZhang
Strategy Description
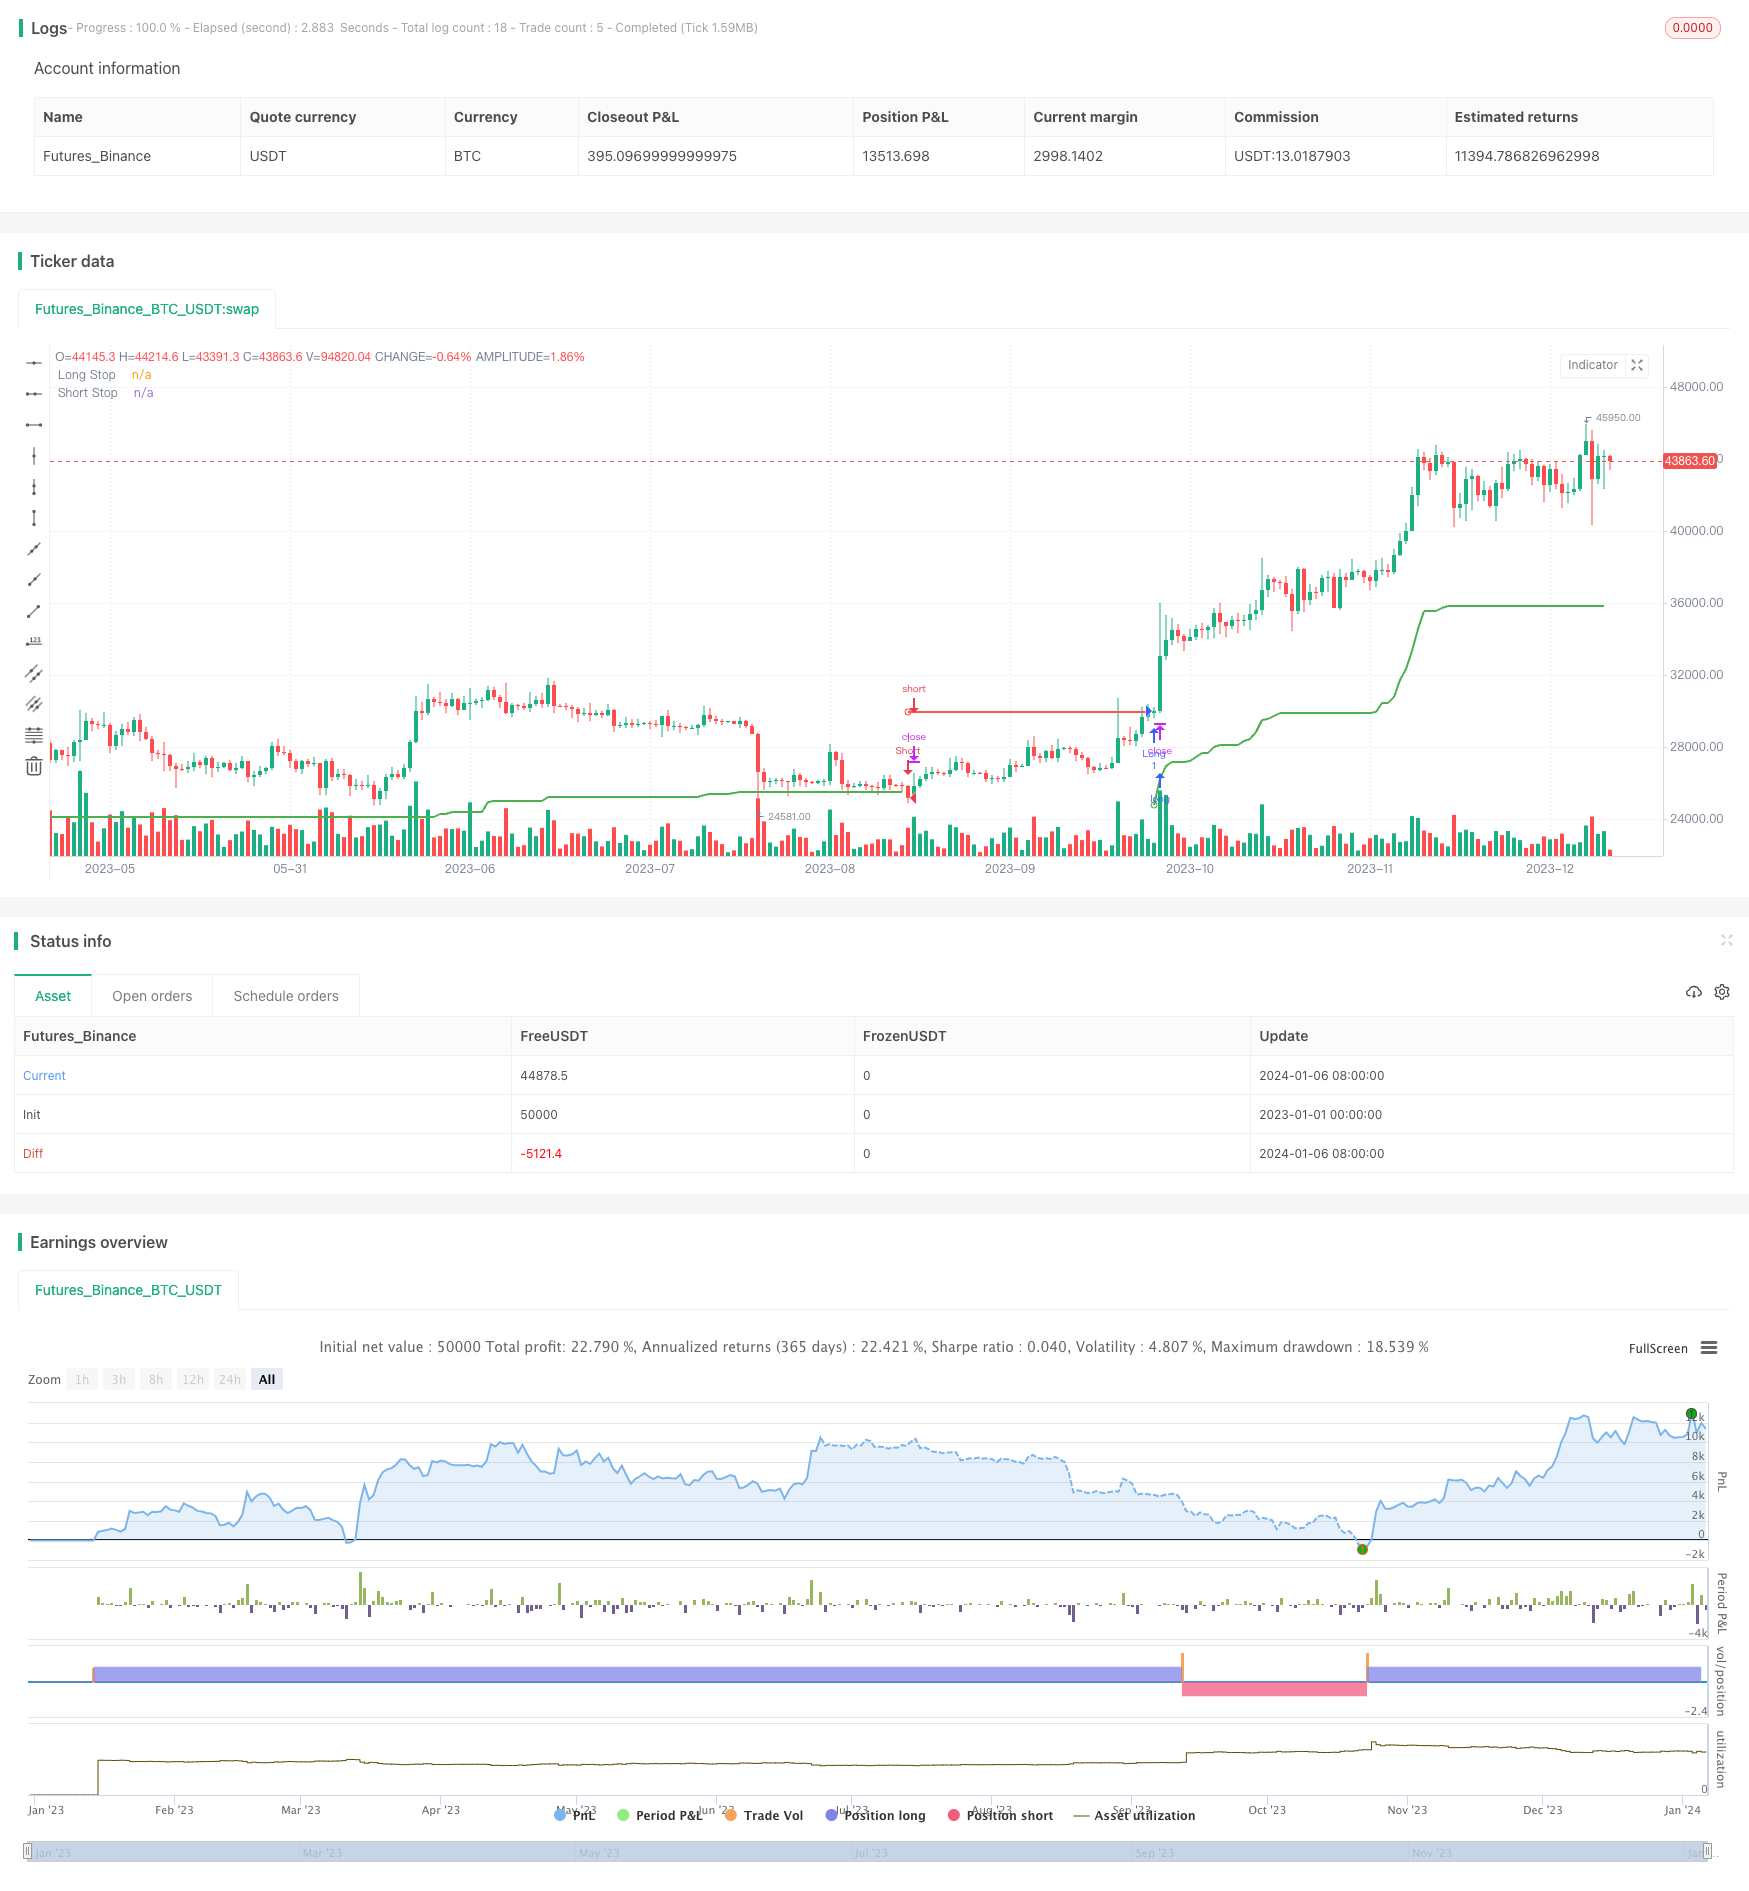
该策略基于超级趋势指标,结合ATR来动态设定止损线,从而在以太坊的强势趋势中获利。它可以在Coinbase交易所的ETH/USD交易对上运行。
该策略使用了一个经典的趋势跟踪指标——超级趋势指标来判断趋势方向。超级趋势指标由两个曲线组成,分别是:
- 上升趋势止损线,在涨势中持有多单;
- 下跌趋势止损线,在跌势中持有空单。
当价格从上升趋势转为下降趋势时,进行空头开仓;当价格从下降趋势转为上升趋势时,进行多头开仓。
此外,策略还利用ATR指标来动态调整止损线的位置。具体来说,上升止损线的位置为最高价与最低价的均值减去ATR乘以一个系数;下跌止损线的位置为最高价与最低价的均值加上ATR乘以一个系数。这样可以根据市场波动程度来调整止损线。
进入信号发出后,如果价格重新回破止损线,则进行止损退出。
这是一个较为成熟的趋势跟踪策略,具有如下优势:
- 使用超级趋势指标判断趋势方向,可靠性较高;
- 应用ATR自适应调整止损线,可以有效控制风险;
- 策略逻辑简单清晰,容易理解与修改;
- 可在高波动的数字货币市场中获利。
该策略也存在一些风险:
- 超级趋势指标判断错误的概率存在,可能引发不必要的亏损;
- ATR止损可能过于激进,被价格反转止出;
- 数字货币市场波动大,止损被突破的概率较大;
- 交易手续费较高的交易所,会影响最终盈利。
为降低上述风险,可以适当调整ATR系数,或结合其他指标过滤交易信号。 止损位置也可以考虑留有一定缓冲。
该策略还有进一步优化的空间:
- 可以引入更多指标组合,提高信号的准确性;
- 可以研究ATR系数和长度参数的最优值;
- 可以设定风险止损比来动态调整头寸规模;
- 可以在更多数字货币交易对上测试策略的有效性。
本策略整体来说是一个成熟可靠的趋势跟踪策略。它使用超级趋势指标判断趋势方向,并利用ATR来调整止损位置,以控制风险的同时获利。该策略适用于高波动的数字货币交易,在以太坊等主流币种上效果较好。通过进一步优化,可以使策略在更广泛的市场中应用,获得更稳定的超额收益。
||
This strategy is based on the SuperTrend indicator and uses ATR to dynamically set stop loss lines to profit from strong trends in Ethereum. It can run on the ETH/USD trading pair on Coinbase exchange.
The strategy uses a classic trend-following indicator - SuperTrend indicator to determine the trend direction. The SuperTrend indicator consists of two lines:
- Uptrend stop loss line to hold long positions in uptrends;
- Downtrend stop loss line to hold short positions in downtrends.
When price turns from uptrend to downtrend, open short position. When price turns from downtrend to uptrend, open long position.
In addition, the strategy utilizes the ATR indicator to dynamically adjust the stop loss line. Specifically, the uptrend stop loss line position is the average of highest high and lowest low minus ATR multiplied by a coefficient; the downtrend stop loss line position is the average of highest high and lowest low plus ATR multiplied by a coefficient. This allows adjusting the stop loss based on market volatility.
After entry signals are triggered, if price breaks back above the stop loss line, stop out with loss.
This is a relatively mature trend following strategy with the following advantages:
- Use SuperTrend indicator to determine trend direction reliably;
- Apply adaptive ATR stop loss to effectively control risks;
- Simple and clear strategy logic, easy to understand and modify;
- Profitable in the high volatility cryptocurrency market.
There are also some risks with this strategy:
- Probability of SuperTrend indicator judging wrongly exists, may cause unnecessary losses;
- ATR stop loss may be too aggressive, stopped out by price reversals;
- High volatility in crypto markets increases probability of stop loss being hit;
- Higher transaction fees on some exchanges impacts final profitability.
To mitigate the above risks, ATR coefficient can be adjusted, or add filters with other indicators. Stop loss buffer can also be considered.
There is room for further improvements:
- Introduce more indicators to improve signal accuracy;
- Research optimal values for ATR length and coefficient;
- Implement dynamic position sizing based on risk-reward ratio;
- Test strategy effectiveness across more crypto trading pairs.
Overall this is a mature and reliable trend following strategy. It uses SuperTrend indicator to determine trend direction and adapts stop loss with ATR to control risks while profiting. The strategy works well for high volatility cryptocurrencies like Ethereum. Further optimizations can expand its application across more markets for steady outperformance.
[/trans]
Strategy Arguments
| Argument | Default | Description |
|---|---|---|
| v_input_1 | 21 | ATR Period |
| v_input_2 | 6.2 | ATR Multiplier |
| v_input_3 | false | Take Wicks into Account ? |
| v_input_4 | false | Start from Specific Date ? |
| v_input_5 | 2019 | Start Year |
| v_input_6 | true | Start Month |
| v_input_7 | true | Start Day |
Source (PineScript)
/*backtest
start: 2023-01-01 00:00:00
end: 2024-01-07 00:00:00
period: 1d
basePeriod: 1h
exchanges: [{"eid":"Futures_Binance","currency":"BTC_USDT"}]
*/

//@version=4
strategy("SuperTrend Strategy",
     overlay=true,
     initial_capital=2e3,
     process_orders_on_close=true,
     commission_type=strategy.commission.percent,
     commission_value=0.1
     )

length = input(title="ATR Period", type=input.integer, defval=21)
mult = input(title="ATR Multiplier", type=input.float, step=.25, defval=6.2)
wicks = input(title="Take Wicks into Account ?", type=input.bool, defval=false)

useDate = input(title="Start from Specific Date ?", defval=false)
yearStart = input(title="Start Year", defval=2019)
monthStart = input(title="Start Month", minval=1, maxval=12, defval=1)
dayStart = input(title="Start Day", minval=1, maxval=31, defval=1)

startTime = timestamp(yearStart, monthStart, dayStart, 0, 0)
startFrom = useDate ? time(timeframe.period) >= startTime : true

atr = mult * ta.atr(length)

longStop = hl2 - atr
longStopPrev = nz(longStop[1], longStop)
longStop := (wicks ? low[1] : close[1]) > longStopPrev ? math.max(longStop, longStopPrev) : longStop

shortStop = hl2 + atr
shortStopPrev = nz(shortStop[1], shortStop)
shortStop := (wicks ? high[1] : close[1]) < shortStopPrev ? math.min(shortStop, shortStopPrev) : shortStop

dir = 1
dir := nz(dir[1], dir)
dir := dir == -1 and (wicks ? high : close) > shortStopPrev ? 1 : dir == 1 and (wicks ? low : close) < longStopPrev ? -1 : dir

longColor = color.green
shortColor = color.red

plot(dir == 1 ? longStop : na, title="Long Stop", style=plot.style_linebr, linewidth=2, color=longColor)
plotshape(dir == 1 and dir[1] == -1 ? longStop : na, title="Long Start", location=location.absolute, style=shape.circle, size=size.tiny, color=longColor, transp=0)

plot(dir == 1 ? na : shortStop, title="Short Stop", style=plot.style_linebr, linewidth=2, color=shortColor)
plotshape(dir == -1 and dir[1] == 1 ? shortStop : na, title="Short Start", location=location.absolute, style=shape.circle, size=size.tiny, color=shortColor, transp=0)

longCondition = dir[1] == -1 and dir == 1
if longCondition and startFrom
    strategy.entry("Long", strategy.long, stop=longStop)
else
    strategy.cancel("Long")

shortCondition = dir[1] == 1 and dir == -1
if shortCondition and startFrom
    strategy.entry("Short", strategy.short, stop=shortStop)
else
    strategy.cancel("Short")
Detail
https://www.fmz.com/strategy/438035
Last Modified
2024-01-08 14:35:37
