Name
基于超趋势和CCI策略的短线交易Supertrend-and-CCI-Scalping-Strategy
Author
ChaoZhang
Strategy Description
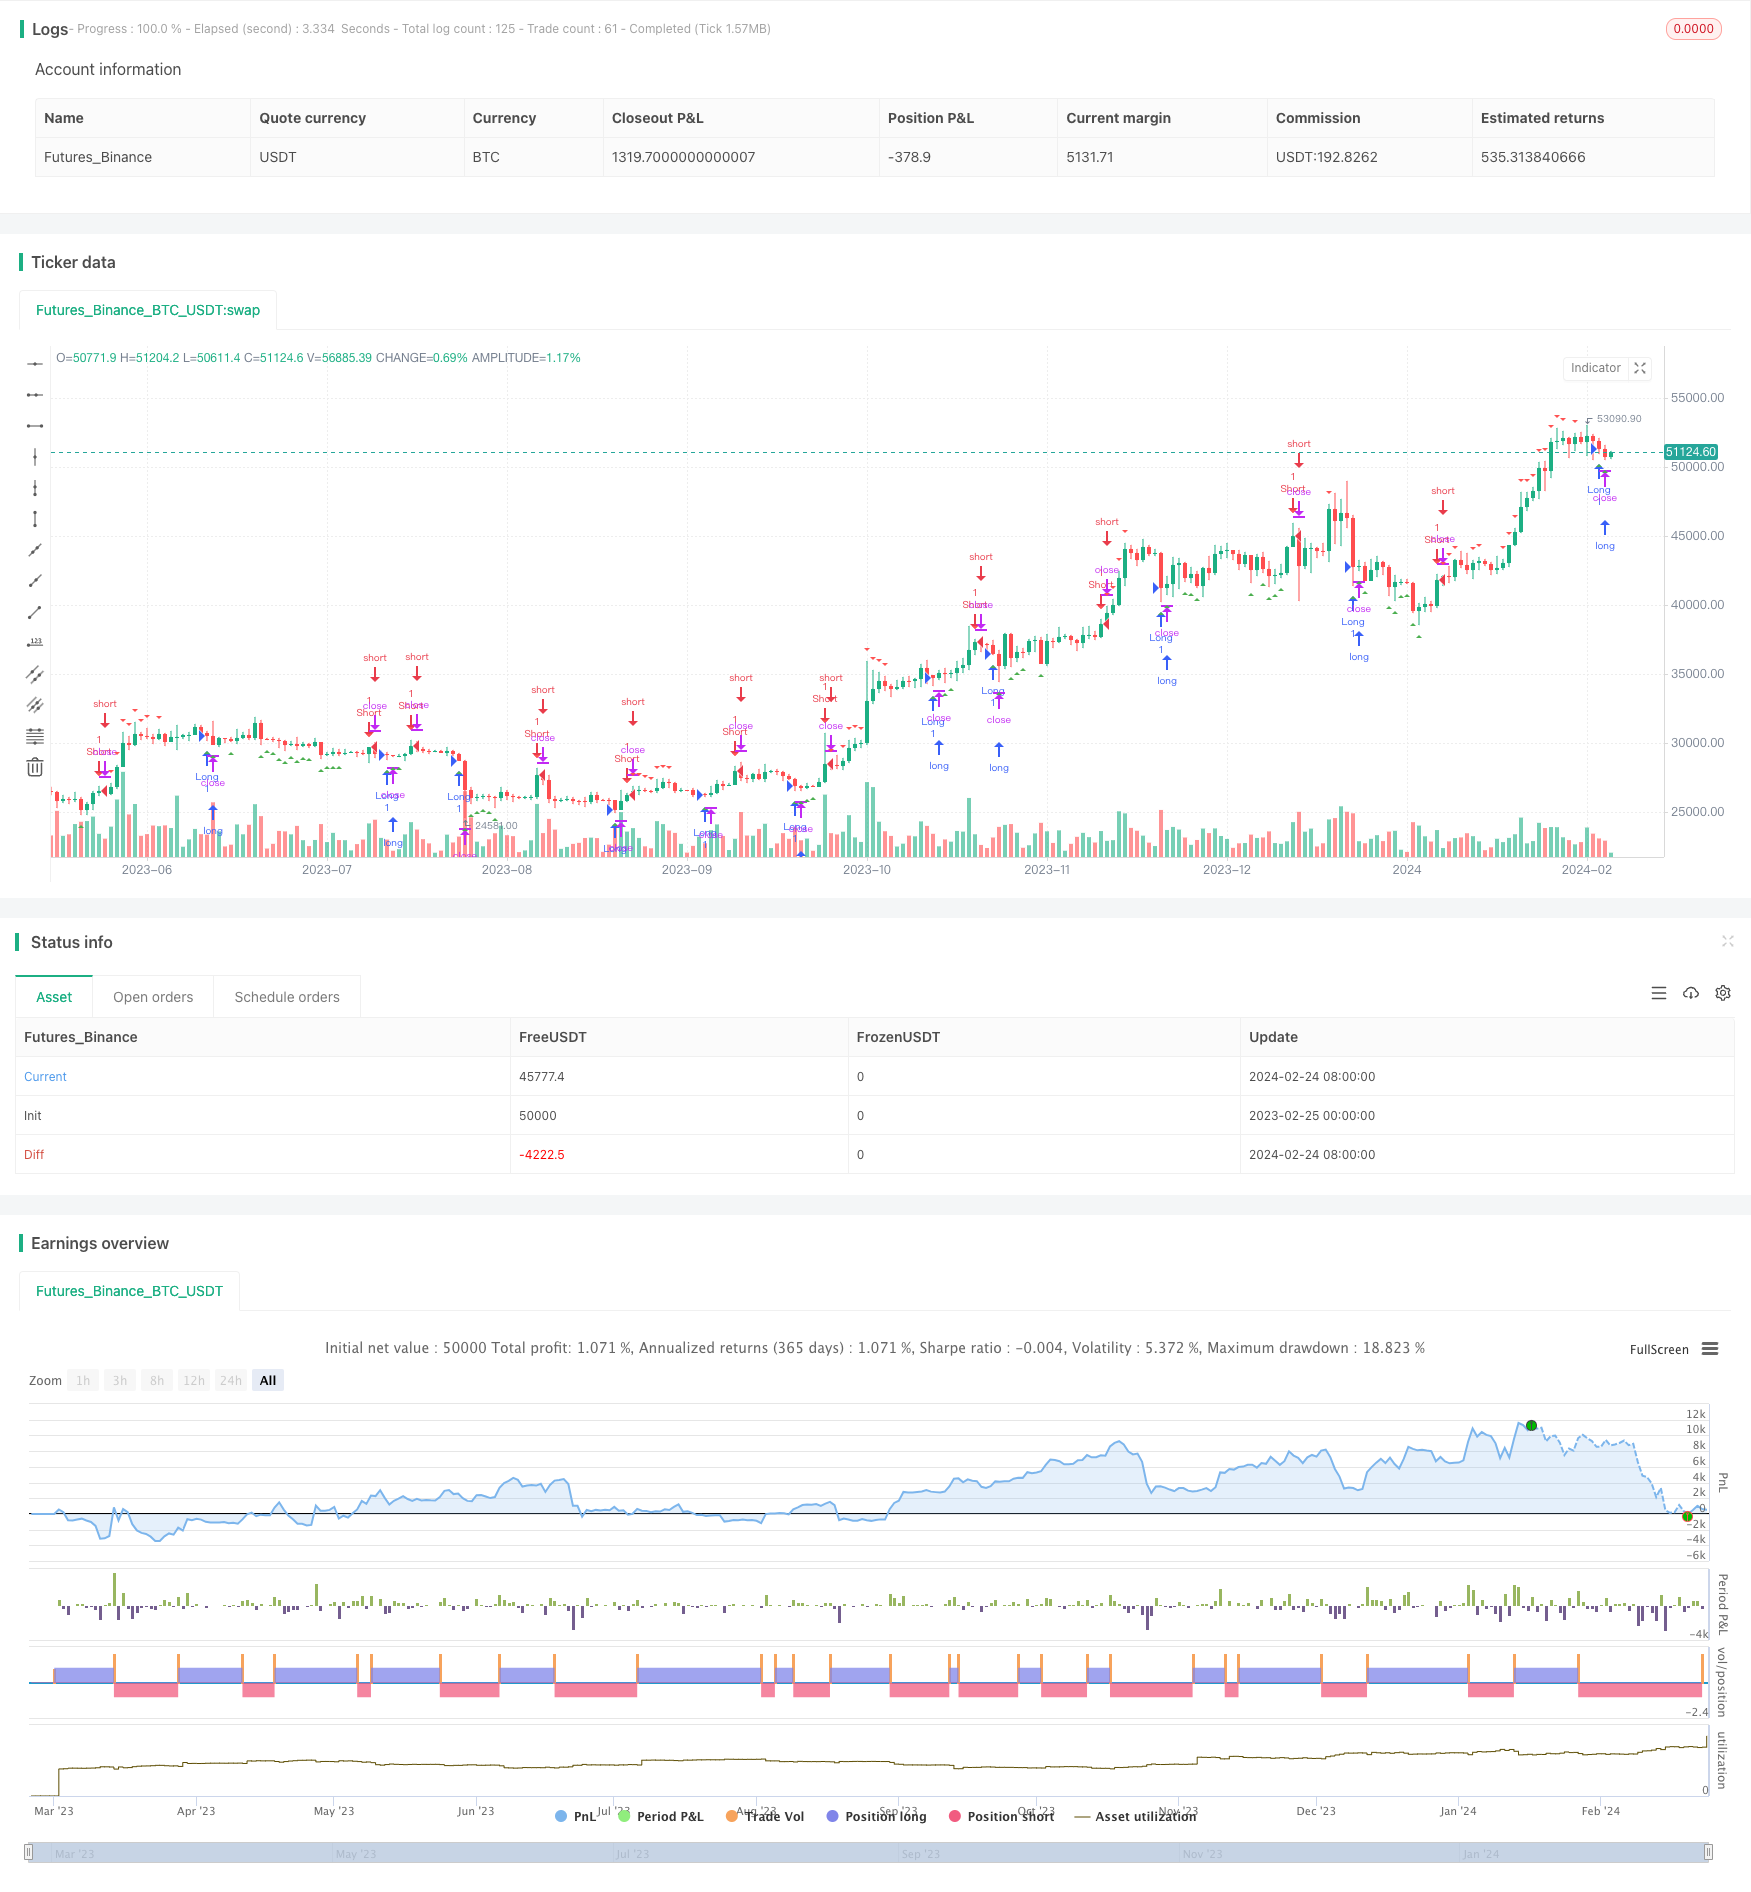
该策略基于两个不同参数设置的超趋势指标和CCI指标,目标是捕捉短线价格波动,实现高频交易。超趋势指标通过动态计算ATR,判断价格的趋势方向;而CCI指标则用于判断市场是否超买超卖。策略结合两者形成交易信号。
-
使用14周期的ATR计算快速超趋势,设置因子为3;使用14周期的ATR计算慢速超趋势,设置因子为6。快速超趋势更敏感,可以捕捉短期变动;慢速超趋势判断主要趋势方向。
-
当快速超趋势下穿价格,且慢速超趋势还在价格之上时,判断为可能的反转信号,做多;当快速超趋势上穿价格,且慢速超趋势还在价格之下时,判断为可能的反转信号,做空。
-
同时,利用CCI判断市场超买超卖状况。CCI高于100时市场为超买,低于-100时市场为超卖。结合CCI信号过滤假突破。
-
在超买超卖情况下,超趋势指标发出反转信号的可能性更大,这是策略的核心逻辑。
-
结合超趋势判断趋势反转点和CCI判断超买超卖状况,可以有效过滤假突破,提高信号质量。
-
快慢超趋势交叉形成交易信号,实现高频出入场。
-
CCI参数和超趋势的参数可以灵活调整,适应不同市场状况。
-
策略思路清晰易理解,参数调整也较为简单。
-
超趋势本身存在时滞,可能错过首次反转机会。可以试验缩短ATR周期。
-
CCI存在回调风险,波动过大也可能造成重复交易。可以试验增大CCI的参数或调整边界。
-
高频交易容易增加交易频次和手续费负担。建议调整持仓时间,降低开平仓频率。
-
可以基于最大回撤或盈亏比等指标对参数组合进行遍历优化,寻找最优参数。
-
可以结合机器学习方法如随机森林针对参数进行特征选择,实现参数的自动优化。
-
可以探索在特定周期内限制最多开仓次数,来控制风险。
该策略充分利用超趋势指标判断短期趋势反转点,辅以CCI指标过滤信号。参数设置合理时,可以实现高效率的短线交易。但也需要警惕过于频繁交易带来的各类风险,通过参数调整及算法优化不断改进,能够获得更好的策略表现。
||
This strategy is based on two Super Trend indicators with different parameter settings and the CCI indicator, aiming to capture short-term price fluctuations for high-frequency trading. The Super Trend indicator judges the trend direction dynamically by calculating the ATR, while the CCI indicator is used to determine whether the market is overbought or oversold. The strategy combines both to form trading signals.
-
Use 14 periods ATR to calculate the fast Super Trend, with a factor set to 3; use 14 periods ATR to calculate the slow Super Trend, with a factor set to 6. The fast Super Trend is more sensitive and can capture short-term changes; the slow Super Trend determines the major trend direction.
-
When the fast Super Trend crosses below the price, and the slow Super Trend is still above the price, it is judged as a possible reversal signal to go long; when the fast Super Trend crosses above the price, and the slow Super Trend is still below the price, it is judged as a possible reversal signal to go short.
-
At the same time, use CCI to judge whether the market is overbought or oversold. CCI above 100 indicates an overbought market, while below -100 means an oversold market. CCI signals are combined to filter out false breakouts.
-
The probability of the Super Trend indicator issuing a reversal signal is higher when the market is overbought or oversold. This is the core logic of the strategy.
-
Combining Super Trend to determine trend reversal points and CCI to judge overbought/oversold conditions can effectively filter out false breakouts and improve signal quality.
-
Fast and slow Super Trend crossovers form trading signals to achieve high-frequency entry and exit.
-
CCI parameters and Super Trend parameters can be flexibly adjusted to adapt to different market conditions.
-
The strategy idea is clear and easy to understand, and parameter adjustment is also relatively simple.
-
Super Trend itself has lagging effect, possibly missing the first reversal opportunity. Can try shortening the ATR period.
-
CCI has callback risks, and excessive fluctuations may also cause repetitive trading. Can try increasing CCI parameters or adjusting boundaries.
-
High frequency trading is prone to increase transaction frequency and trading costs. It is recommended to adjust holding time and reduce open/close frequency.
-
Parameters combination can be traversed and optimized based on max drawdown or profit/loss ratio to find the optimal parameter.
-
Machine learning methods such as Random Forest can be used for feature selection on parameters to achieve automatic parameter optimization.
-
Explore limiting the maximum number of opening positions within a certain cycle to control risks.
The strategy makes full use of the Super Trend indicator to determine short-term trend reversal points, supplemented by the CCI indicator to filter out signals. When parameter settings are reasonable, it can achieve efficient short-term trading. But also need to be wary of risks arising from excessive trading, and continuously improve the strategy performance through parameter tuning and algorithm optimization.
[/trans]
Strategy Arguments
| Argument | Default | Description |
|---|---|---|
| v_input_int_1 | 14 | RSI Length |
| v_input_int_2 | 14 | Stochastic Length |
| v_input_int_3 | 3 | K Smooth |
| v_input_int_4 | 3 | D Smooth |
| v_input_1 | 10 | Oversold Level |
| v_input_2 | 90 | Overbought Level |
Source (PineScript)
/*backtest
start: 2023-02-25 00:00:00
end: 2024-02-25 00:00:00
period: 1d
basePeriod: 1h
exchanges: [{"eid":"Futures_Binance","currency":"BTC_USDT"}]
*/

//@version=5
strategy(title="Stochastic RSI Strategy", shorttitle="StochRSI", overlay=true)

rsiLength = input.int(14, title="RSI Length")
stochLength = input.int(14, title="Stochastic Length")
kSmooth = input.int(3, title="K Smooth")
dSmooth = input.int(3, title="D Smooth")
oversoldLevel = input(10, title="Oversold Level")
overboughtLevel = input(90, title="Overbought Level")

rsi = ta.rsi(close, rsiLength)
stochRsi = ta.stoch(rsi, rsi, rsi, stochLength)

longCondition = stochRsi < oversoldLevel
shortCondition = stochRsi > overboughtLevel

if (longCondition)
    strategy.entry("Long", strategy.long)
if (shortCondition)
    strategy.entry("Short", strategy.short)

if (shortCondition)
    strategy.close("Long")
if (longCondition)
    strategy.close("Short")

plotshape(longCondition, style=shape.triangleup, location=location.belowbar, color=color.green, size=size.small)
plotshape(shortCondition, style=shape.triangledown, location=location.abovebar, color=color.red, size=size.small)
Detail
https://www.fmz.com/strategy/442812
Last Modified
2024-02-26 10:44:43
