Name
基于超趋势支撑阻力与ADX指标的高频交易策ADX-Filtered-SuperTrend-Pivot-Trading-Strategy
Author
ChaoZhang
Strategy Description
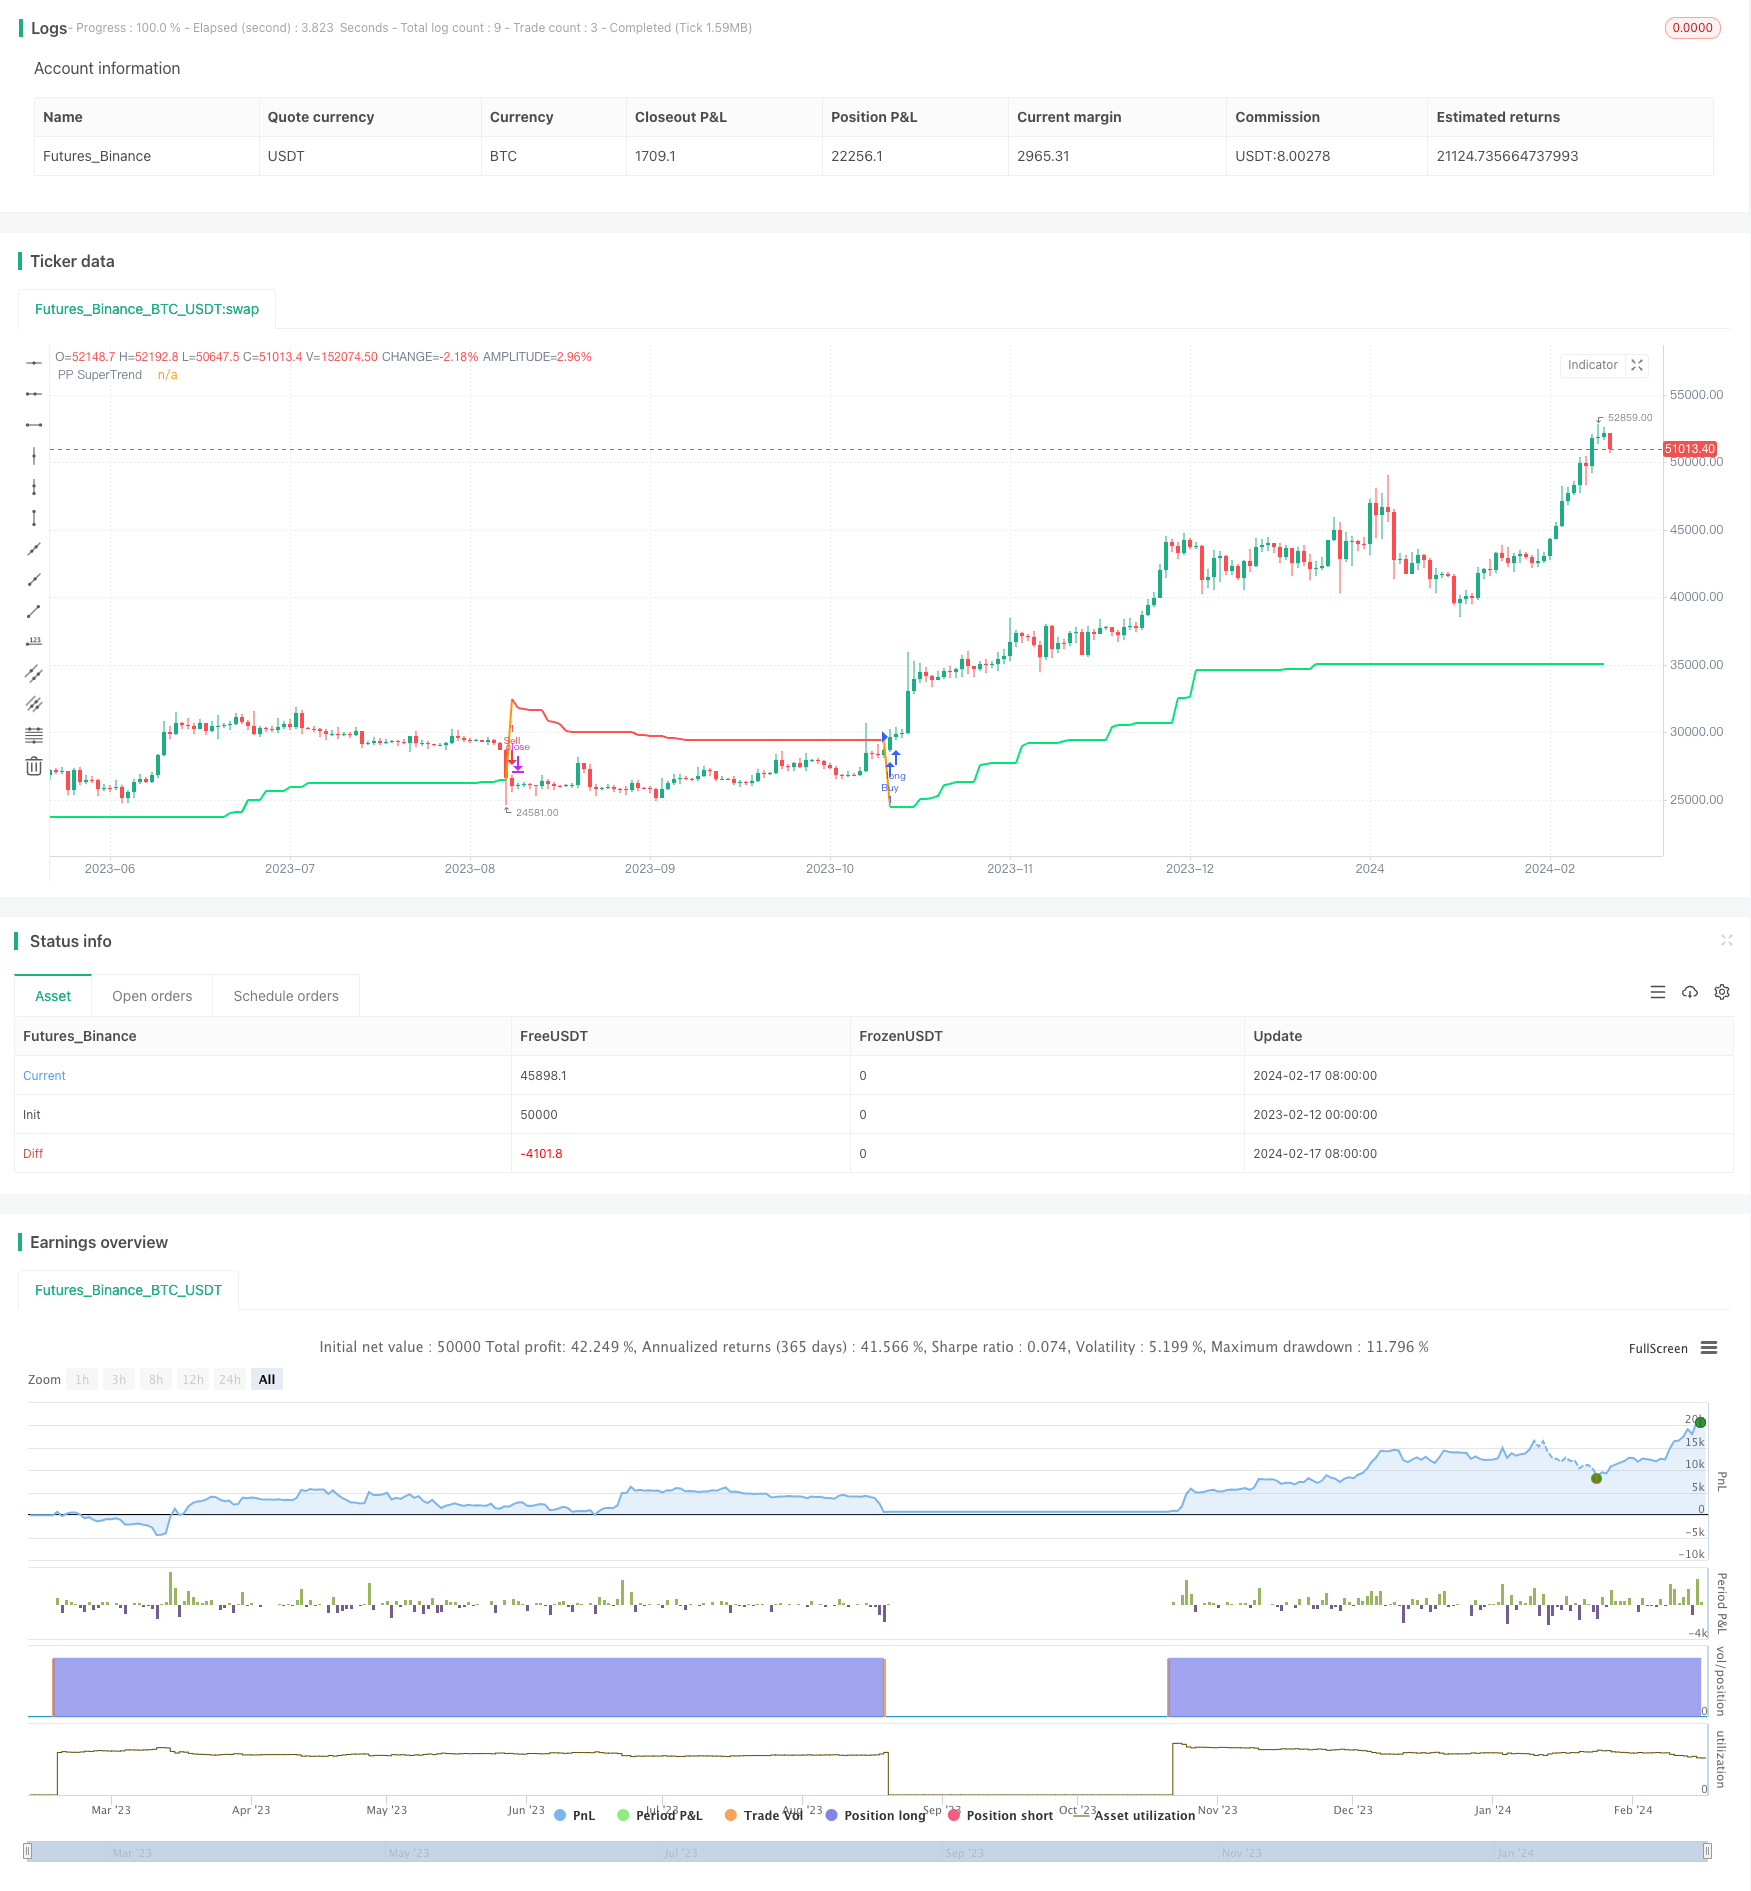
本策略综合运用超趋势支撑阻力线和ADX指标来实现高频交易。超趋势支撑阻力线通过动态计算最新支撑阻力点,来判断价格趋势和发出交易信号。ADX指标用于判断趋势力度,设置ADX值为过滤条件,只在趋势足够强劲时发出交易信号。
-
计算支撑阻力线。以收盘价为基准,上下各添加一个ATR幅度。当价格突破这些线时,判断为趋势反转。
-
ADX指标判断趋势力度。当ADX高于设置值时,认为趋势足够强劲。
-
结合两者发出交易信号。只在突破支撑阻力线且ADX足够大时,做多做空。
该策略具有以下优势:
-
超趋势线动态计算支撑阻力,能快速判断突破。
-
ADX指标有效过滤非趋势场景,减少无效交易。
-
回撤和盈亏比良好。
该策略也存在以下风险:
-
大幅跳空可能致使超趋势线失效。
-
ADX值设定不当也会影响策略表现。
-
高频交易交易费用较高。
对应解决方法:
-
优化超参数,适当放宽突破幅度。
-
测试更优ADX参数。
-
适当降低交易频率。
该策略可从以下方面进行优化:
-
优化ATR倍数参数,使支撑阻力线更稳健。
-
测试不同ADX参数,找到最优值。
-
加入止损机制以控制单次损失。
本策略整合超趋势线和ADX指标的优点,通过动态计算支撑阻力判断趋势反转时机,配合ADX指标过滤低质量信号。经过参数优化和机制调整后,可以成为一个稳定盈利的高频策略。
||
This strategy combines SuperTrend pivot points and the ADX indicator for high-frequency trading. The SuperTrend lines dynamically calculate the latest support and resistance levels to determine price trends and generate trading signals. The ADX indicator measures trend strength and acts as a filter, only taking trades when the trend is strong enough.
-
Calculate pivot support and resistance lines. Take the closing price and add/subtract an ATR range above and below. Breaks of these lines signal trend reversions.
-
ADX determines trend strength. High ADX values indicate a strong trend.
-
Combine both for trade signals. Go long/short only on pivot breaks and high ADX.
Advantages of this strategy:
-
Dynamic SuperTrend lines quickly identify breakouts.
-
ADX filter avoids false signals during range-bound markets.
-
Good risk-reward ratio and drawdown control.
Risks of this strategy:
-
Gap moves can invalidate SuperTrend lines.
-
Poor ADX threshold setting impacts performance.
-
High trading frequency increases transaction costs.
Solutions:
-
Optimize parameters to allow wider breakout ranges.
-
Test for better ADX values.
-
Reduce trade frequency.
Areas for improvement:
-
Optimize ATR multiplier for more robust lines.
-
Test different ADX parameters.
-
Add stop-loss to limit losses.
This strategy combines the strengths of SuperTrend and ADX to identify high-probability trend reversal points, filtered by ADX for quality. With parameter tuning and mechanisms adjustments, it can become a steady profit-generating high-frequency strategy.
[/trans]
Strategy Arguments
| Argument | Default | Description |
|---|---|---|
| v_input_1_close | 0 | EMA Source: close |
| v_input_2 | 2 | Pivot Point Period |
| v_input_3 | 5 | ATR Factor |
| v_input_4 | 20 | ATR Period |
| v_input_5_close | 0 | Source: close |
| v_input_6 | false | Offset |
Source (PineScript)
/*backtest
start: 2023-02-12 00:00:00
end: 2024-02-18 00:00:00
period: 1d
basePeriod: 1h
exchanges: [{"eid":"Futures_Binance","currency":"BTC_USDT"}]
*/

//@version=4
strategy("STPP20 + ADX", overlay = true)

///////////////////////////
// SuperTrend + Pivot Point
//////////////////////////

src =  input(close, title="EMA Source")
PPprd = input(defval = 2, title="Pivot Point Period", minval = 1, maxval = 50)
AtrFactor=input(defval = 5, title = "ATR Factor", minval = 1, step = 0.1)
AtrPd=input(defval = 20, title = "ATR Period", minval=1)

float ph = na
float pl = na
ph := pivothigh(PPprd, PPprd)
pl := pivotlow(PPprd, PPprd)

float center = na
center := center[1]
float lastpp = ph ? ph : pl ? pl : na
if lastpp
    if na(center)
        center := lastpp
    else
        center := (center * 2 + lastpp) / 3

Up = center - (AtrFactor * atr(AtrPd))
Dn = center + (AtrFactor * atr(AtrPd))

float TUp = na
float TDown = na
Trend = 0
TUp := close[1] > TUp[1] ? max(Up, TUp[1]) : Up
TDown := close[1] < TDown[1] ? min(Dn, TDown[1]) : Dn
Trend := close > TDown[1] ? 1: close < TUp[1]? -1: nz(Trend[1], 1)
Trailingsl = Trend == 1 ? TUp : TDown

// Lines
linecolor = Trend == 1 and nz(Trend[1]) == 1 ? color.lime : Trend == -1 and nz(Trend[1]) == -1 ? color.red : na
plot(Trailingsl, color = linecolor ,  linewidth = 2, title = "PP SuperTrend")

bsignalSSPP = close > Trailingsl
ssignalSSPP = close < Trailingsl


///////
// ADX
//////

lenADX = 14
th = 25
TrueRange = max(max(high-low, abs(high-nz(close[1]))), abs(low-nz(close[1])))
DirectionalMovementPlus = high-nz(high[1]) > nz(low[1])-low ? max(high-nz(high[1]), 0): 0
DirectionalMovementMinus = nz(low[1])-low > high-nz(high[1]) ? max(nz(low[1])-low, 0): 0
SmoothedTrueRange = 0.0
SmoothedTrueRange := nz(SmoothedTrueRange[1]) - (nz(SmoothedTrueRange[1])/lenADX) + TrueRange
SmoothedDirectionalMovementPlus = 0.0
SmoothedDirectionalMovementPlus := nz(SmoothedDirectionalMovementPlus[1]) - (nz(SmoothedDirectionalMovementPlus[1])/lenADX) + DirectionalMovementPlus
SmoothedDirectionalMovementMinus = 0.0
SmoothedDirectionalMovementMinus := nz(SmoothedDirectionalMovementMinus[1]) - (nz(SmoothedDirectionalMovementMinus[1])/lenADX) + DirectionalMovementMinus
DIPlus = SmoothedDirectionalMovementPlus / SmoothedTrueRange * 100
DIMinus = SmoothedDirectionalMovementMinus / SmoothedTrueRange * 100
DX = abs(DIPlus-DIMinus) / (DIPlus+DIMinus)*100
ADX = sma(DX, lenADX)


//////
// MA
/////

lenMA = 21
srcMA = input(close, title="Source")
offsetMA = input(title="Offset", type=input.integer, defval=0, minval=-500, maxval=500)
outMA = sma(srcMA, lenMA)


// Buy - Sell Entries
buy = bsignalSSPP and outMA < close and ADX > th
sell = ssignalSSPP

if (buy)
    // .order // Tuned version
    strategy.entry("Buy", strategy.long)


if (sell) and (strategy.position_size > 0)
    strategy.order("Sell", false, when = sell)
Detail
https://www.fmz.com/strategy/442120
Last Modified
2024-02-19 15:01:36
