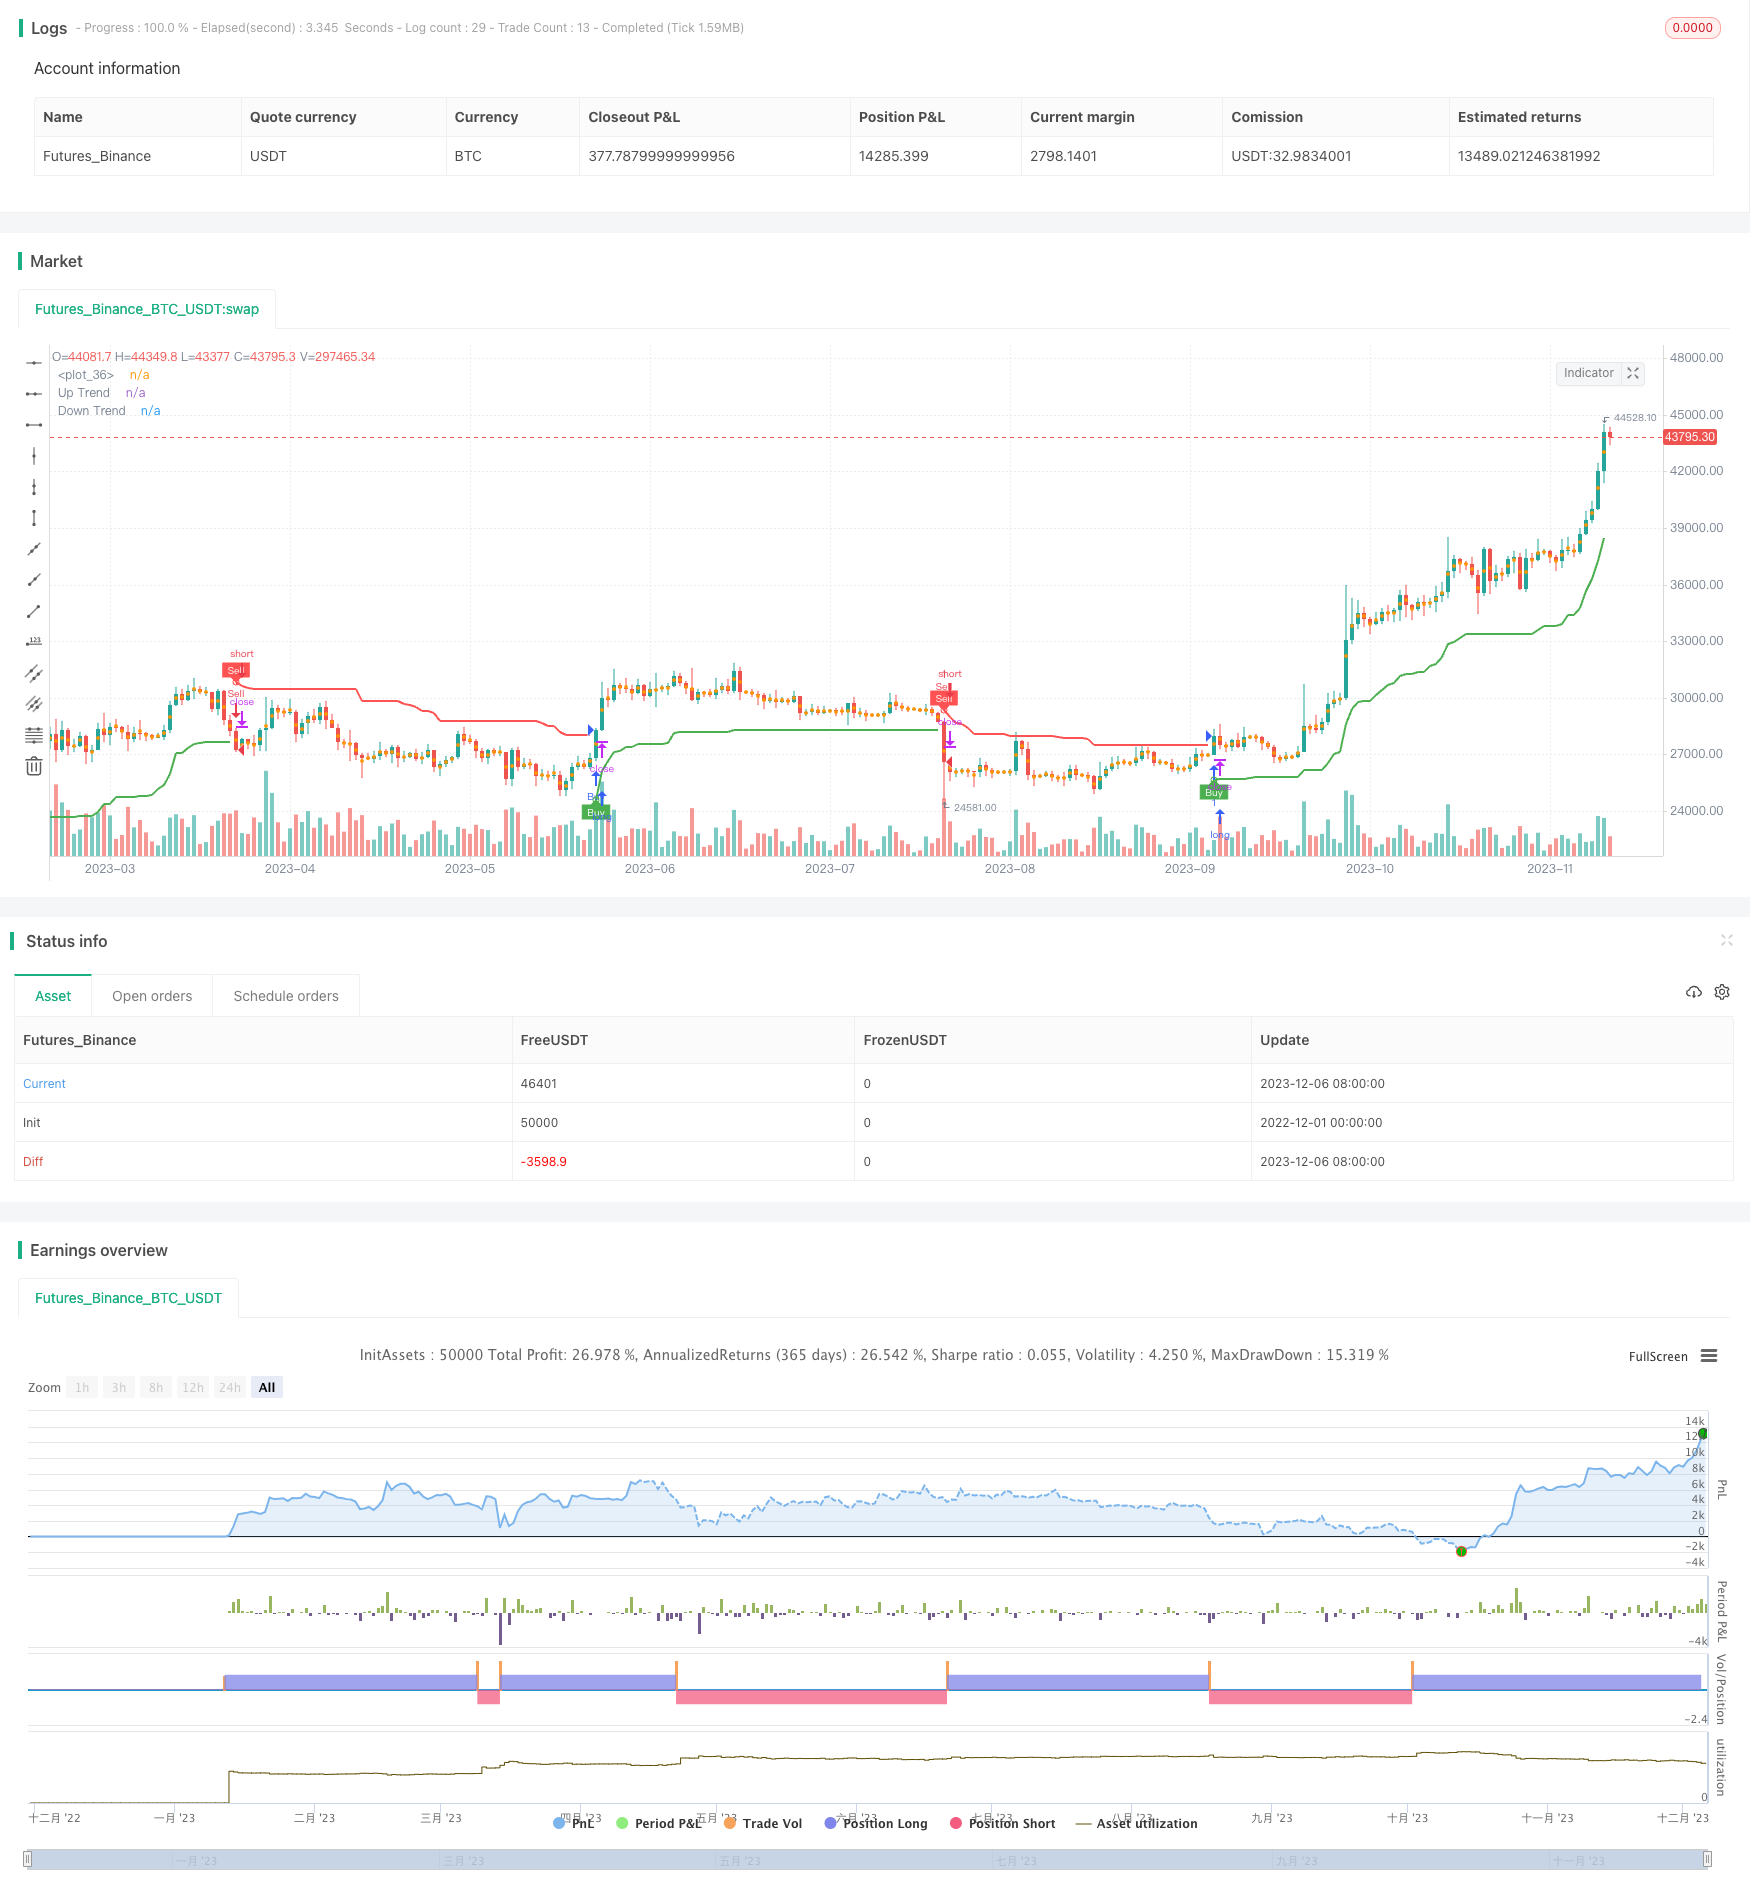
Name
基于超趋势线的趋势跟踪策略SuperTrend-based-Trend-Tracking-Strategy
Author
ChaoZhang
Strategy Description
本策略是基于平均真实波动范围(Average True Range, ATR)指标构建的超趋势线,用于判断市场趋势方向并给出交易信号的趋势跟踪策略。该策略同时具有趋势判断和趋势跟踪双重功能,可用于股指期货、外汇和数字货币等领域。
该策略通过计算一定周期内的ATR指标,并将其与价格比较,判断价格是否处于上升趋势通道内。具体来说,策略首先计算ATR指标,然后根据ATR值乘以系数构建上轨和下轨。当价格高于上轨时,判断为上升趋势;当价格低于下轨时,判断为下降趋势。在上升趋势时,如果价格由下降趋势转为上升趋势,产生买入信号;在下降趋势时,如果价格由上升趋势转为下降趋势,产生卖出信号。
该策略的关键在于构建趋势判断标准——超趋势线。超趋势线是基于ATR指标动态变化的,能够有效过滤市场噪音,判断主要趋势方向。同时,超趋势线具有一定的滞后性,这有助于确认趋势转折点,避免产生错误交易信号。
该策略最大的优势在于结合趋势判断和趋势跟踪的能力。具体来说,主要优势有:
- 使用ATR构建的超趋势线,可有效识别市场趋势,过滤噪音。
- 超趋势线具有一定滞后性,有助于减少错误信号。
- 可同时给出趋势判断和交易信号,操作简单。
- 可Parametrization参数进行优化,适应更广泛的市场。
- 可视化指标,直观判断当前趋势状态。
该策略主要存在以下风险:
- ATR参数设置不当,可能导致超趋势线过于敏感或滞后。
- 无法完全避免噪音的影响,个别情况下可能产生错误信号。
- 行情剧烈波动时,超趋势线判断准确率会有所下降。
- 无法预测趋势反转点,只能追踪已发生的趋势。
对策方面,可通过调整ATR周期、超趋势线系数等参数进行优化,也可以结合其他指标进行验证,降低错误信号概率。此外,可设置止损点,控制单笔损失。
该策略还有进一步优化的空间:
- 结合机器学习算法,实现参数的自动优化。
- 增加指数平滑移动平均线等指标判断和验证。
- 设置止损止盈策略,优化资金管理。
- 结合情绪指标、消息面分析等方法预测潜在的趋势反转。
- 利用深度学习技术分析更大量的历史数据,提高判断准确性。
通过深度优化,有望进一步提高策略的稳定性、适应性和盈利空间。
本策略整体上具有稳定、可靠、收益良好的特点。构建超趋势线判断主要趋势,同时给出交易信号是策略的最大亮点。但也存在一定程度的滞后性和误判风险。通过参数和模型优化,有望获得更好的策略表现。总体上,该策略是基于趋势的一个典型代表,值得实盘验证与应用。
||
This strategy is constructed based on the Average True Range (ATR) indicator to build a SuperTrend line for judging market trend direction and generating trading signals. It has both trend judgment and trend tracking capabilities, applicable to indices futures, forex, and cryptocurrencies.
The strategy calculates the ATR over a certain period and compares it with price to determine if the price is within an uptrend channel. Specifically, it first computes the ATR, then uses the ATR value multiplied by a factor to plot the upper and lower bands. When the price is higher than the upper band, an uptrend is identified. When the price is below the lower band, a downtrend is identified. In an uptrend, if the price changes from downtrend to uptrend, a buy signal is generated. In a downtrend, if the price changes from uptrend to downtrend, a sell signal is triggered.
The key lies in constructing the trend judgment benchmark - SuperTrend line. The SuperTrend line is based on the dynamically changing ATR, which can effectively filter out market noise and determine the major trend direction. Meanwhile, the SuperTrend line has a certain lagging effect, which helps confirm trend reversal points and avoid generating incorrect trading signals.
The biggest advantage of this strategy is the combination of trend identification and tracking abilities:
- The ATR-based SuperTrend line can effectively identify market trends and filter out noise.
- The lagging effect of the SuperTrend line helps reduce incorrect signals.
- It can give both trend judgment and trading signals for easy operation.
- The parameters can be optimized for fitting more diverse markets.
- Visual indicators allow intuitive trend judgments.
The main risks of this strategy include:
- Improper ATR parameter setting may cause too sensitive or lagging SuperTrend lines.
- It cannot completely avoid the impact of noise, which may occasionally trigger incorrect signals.
- The accuracy decreases during violent market fluctuations.
- It cannot predict trend reversal points but can only track existing trends.
Possible solutions include optimizing parameters like ATR period and SuperTrend factor, combining with other indicators for verification, and reducing incorrect signal probabilities. Also, stop losses can control single trade loss.
Further optimization space exists in areas like:
- Adopting machine learning for automatic parameter optimization.
- Adding indicators like exponential moving averages for verification.
- Setting up stop loss/profit taking strategies for refined money management.
- Combining sentiment indicators and news analytics to predict potential trend reversals.
- Leveraging deep learning to analyze more historical data and improve accuracy.
In-depth optimization promises to further lift stability, adaptiveness and profitability of the strategy.
The strategy demonstrates great stability, reliability and profitability overall. Constructing the SuperTrend line for major trend judgment and trading signals is its biggest highlight. But certain degree of lagging effect and misjudgment risks do exist. Parameter and model optimization promises better strategy performance. In summary, as a typical trend-based strategy, it is worthwhile to verify and utilize it in live trading.
[/trans]
Strategy Arguments
| Argument | Default | Description |
|---|---|---|
| v_input_1 | 10 | ATR Period |
| v_input_2_hl2 | 0 | Source: hl2 |
| v_input_3 | 3 | ATR Multiplier |
| v_input_4 | true | Change ATR Calculation Method? |
| v_input_5 | true | Show Buy/Sell Signals? |
| v_input_6 | true | Highlighter On/Off? |
Source (PineScript)
/*backtest
start: 2022-12-01 00:00:00
end: 2023-12-07 00:00:00
period: 1d
basePeriod: 1h
exchanges: [{"eid":"Futures_Binance","currency":"BTC_USDT"}]
*/

//@version=4
strategy("Supertrend Strategy", overlay = true)

Periods = input(10, title="ATR Period")
src = input(hl2, title="Source")
Multiplier = input(3.0, title="ATR Multiplier", step=0.1)
changeATR = input(true, title="Change ATR Calculation Method?")
showsignals = input(true, title="Show Buy/Sell Signals?")
highlighting = input(true, title="Highlighter On/Off?")

atr2 = sma(tr, Periods)
atr = changeATR ? atr(Periods) : atr2

up = src - (Multiplier * atr)
up1 = nz(up[1], up)
up := close[1] > up1 ? max(up, up1) : up

dn = src + (Multiplier * atr)
dn1 = nz(dn[1], dn)
dn := close[1] < dn1 ? min(dn, dn1) : dn

trend = 1
trend := nz(trend[1], trend)
trend := trend == -1 and close > dn1 ? 1 : trend == 1 and close < up1 ? -1 : trend

upPlot = plot(trend == 1 ? up : na, title="Up Trend", style=plot.style_linebr, linewidth=2, color=color.green)
buySignal = trend == 1 and trend[1] == -1
plotshape(buySignal ? up : na, title="UpTrend Begins", location=location.absolute, style=shape.circle, size=size.tiny, color=color.green, transp=0)
plotshape(buySignal and showsignals ? up : na, title="Buy", text="Buy", location=location.absolute, style=shape.labelup, size=size.tiny, color=color.green, textcolor=color.white, transp=0)

dnPlot = plot(trend == 1 ? na : dn, title="Down Trend", style=plot.style_linebr, linewidth=2, color=color.red)
sellSignal = trend == -1 and trend[1] == 1
plotshape(sellSignal ? dn : na, title="DownTrend Begins", location=location.absolute, style=shape.circle, size=size.tiny, color=color.red, transp=0)
plotshape(sellSignal and showsignals ? dn : na, title="Sell", text="Sell", location=location.absolute, style=shape.labeldown, size=size.tiny, color=color.red, textcolor=color.white, transp=0)

mPlot = plot(ohlc4, title="", style=plot.style_circles, linewidth=0)

longFillColor = highlighting ? (trend == 1 ? color.green : color.white) : color.white
shortFillColor = highlighting ? (trend == -1 ? color.red : color.white) : color.white

fill(mPlot, upPlot, title="UpTrend Highlighter", color=longFillColor)
fill(mPlot, dnPlot, title="DownTrend Highlighter", color=shortFillColor)

strategy.entry("Buy", strategy.long, when=buySignal)
strategy.entry("Sell", strategy.short, when=sellSignal)

alertcondition(buySignal, title="SuperTrend Buy", message="SuperTrend Buy!")
alertcondition(sellSignal, title="SuperTrend Sell", message="SuperTrend Sell!")
changeCond = trend != trend[1]
alertcondition(changeCond, title="SuperTrend Direction Change", message="SuperTrend has changed direction!")
Detail
https://www.fmz.com/strategy/434718
Last Modified
2023-12-08 17:07:53
